This protocol aims to optimize the preparation of anti-tuberculosis drug-loaded liposomes and establish a standardized quality evaluation system for the liposomal formulations.
Method Article
Preparation and Quality Evaluation of Anti-Tuberculosis Rifampicin-Loaded Liposomes
In This Article
Summary
Abstract
Tuberculosis (TB), caused by Mycobacterium tuberculosis (MTB), remains a leading global infectious killer with a heavy disease burden in China, exacerbated by the spread of multidrug/rifampicin-resistant TB and critical limitations of conventional chemotherapy—including poor drug penetration, severe systemic toxicities, and low treatment compliance. Liposomal delivery systems offer unique advantages for anti-TB therapy, yet their development is hindered by inconsistent preparation processes, low drug loading efficiency, and the lack of a standardized quality evaluation framework. In this study, the thin-film hydration method, combined with ultrasonic treatment and filtration, was used to prepare rifampicin-loaded nanoliposomes with different phospholipid-to-cholesterol ratios. A validated high-performance liquid chromatography (HPLC) method was established to determine encapsulation efficiency and drug loading. Dynamic light scattering and transmission electron microscopy (TEM) were used to characterize particle size, zeta potential, and microscopic morphology, and in vitro drug release profiles were analyzed by dissolution testing. The optimized liposomes exhibited high encapsulation efficiency, ideal drug loading, uniform nanoscale particle size, good storage stability, and sustained in vitro drug release. This work provides standardized experimental methods and a comprehensive quality evaluation system for the development of anti-TB liposomes, supporting the clinical translation of liposomal delivery systems for TB treatment.
Introduction
Tuberculosis (TB), a chronic infectious disease caused by Mycobacterium tuberculosis (MTB), remains the leading cause of mortality among infectious diseases attributed to a single pathogen, posing a persistent and severe threat to both human health and global public health security. According to the World Health Organization (WHO) Global Tuberculosis Report 2025, there were an estimated 10.7 million new TB cases and approximately 1.23 million TB-related deaths worldwide in 20241. Among these, approximately 390,000 new cases of multidrug-resistant/rifampicin-resistant tuberculosis (MDR/RR-TB) were reported, with only 42% of affected individuals enrolled in treatment. The ongoing transmission of drug-resistant TB has emerged as a core obstacle to the implementation of the WHO’s global End TB Strategy.
Currently, chemotherapy remains the mainstay of clinical treatment for TB. The standard first-line regimen comprises a combination of isoniazid, rifampicin, pyrazinamide, and ethambutol, with a prolonged treatment duration of 6 to 9 months2. For MDR/RR-TB, the regimen necessitates the inclusion of second-line anti-TB drugs, extending the treatment course to 18–24 months3, accompanied by substantially increased costs and a marked rise in adverse drug reactions4. Although novel anti-TB agents—such as bedaquiline, delamanid, and pretomanid—have been approved in recent years, offering new therapeutic options for drug-resistant TB5, they have yet to overcome the fundamental bottlenecks inherent in existing anti-TB therapy6,7.
First, M. tuberculosis is a typical intracellular pathogen that primarily resides within host alveolar macrophages. Free drugs exhibit poor penetration across the macrophage membrane, resulting in intracellular drug concentrations far below the minimum inhibitory concentration (MIC)8. The consequent failure to eliminate intracellular persisters serves as a key driver of TB relapse and the emergence of drug resistance9. Second, TB lesions present multiple biological barriers, including caseous necrotic tissue and fibrotic capsules, which impede the penetration of free drugs into the lesion core, leading to suboptimal local drug concentrations and compromised bactericidal efficacy10,11. Third, long-term systemic administration at high doses is prone to severe adverse reactions—such as rifampicin-induced hepatotoxicity, aminoglycoside-related ototoxicity and nephrotoxicity, and fluoroquinolone-associated tendinopathy and cardiotoxicity—which are primary causes of treatment interruption and poor patient adherence12,13. Fourth, monotherapy or sequential administration readily selects for drug-resistant mutations in M. tuberculosis, whereas multidrug combination regimens further amplify the risk of cumulative toxicity, creating a persistent clinical dilemma14.
The development of nanomedicine delivery systems offers a promising strategy to address the aforementioned bottlenecks in anti-TB therapy. Among these, liposomes—nanoscale, closed vesicular carriers self-assembled from phospholipid bilayers—have emerged as one of the most clinically translational nanocarrier platforms for anti-infective therapy, owing to their excellent biocompatibility, biodegradability, targeted delivery capability, and controlled sustained-release properties15,16. Compared with free anti-TB drugs, liposomal delivery systems possess several irreplaceable advantages for TB treatment.
First, they enable targeted enrichment in macrophages. Liposomes are preferentially taken up by phagocytes of the reticuloendothelial system (RES), leading to specific accumulation in major MTB-harboring organs such as the lungs, liver, and spleen. Moreover, they efficiently penetrate the macrophage membrane17, substantially elevating intracellular drug concentrations, eliminating persistent intracellular bacteria, and thereby fundamentally reducing TB relapse and drug resistance. Second, they exhibit enhanced penetration into TB lesions. By modulating particle size, surface charge, and surface modifications, liposomes can effectively traverse the fibrotic capsule and caseous necrotic barrier of TB lesions, significantly increasing local drug concentrations and improving bactericidal efficacy18. Third, they markedly reduce drug toxicity. Liposomes alter the in vivo biodistribution of drugs, limiting exposure to healthy tissues and organs and thereby significantly reducing the systemic toxicity of anti-TB agents. For example, aminoglycoside-loaded liposomes greatly reduce drug accumulation in the cochlea and kidneys, nearly eliminating the risks of ototoxicity and nephrotoxicity19. Fourth, they provide long-acting sustained release. The phospholipid bilayer structure enables controlled, slow drug release, prolonging in vivo circulation half-life and duration of action, reducing dosing frequency, and substantially improving patient adherence20. Fifth, they allow co-delivery of multiple drugs. Liposomes can simultaneously encapsulate multiple anti-TB drugs with differing physicochemical properties, achieving synchronized delivery and synergistic bactericidal effects, thereby effectively suppressing the emergence of drug-resistant MTB mutants21.
Significant progress has been made in the clinical translation of liposomal drug delivery systems for anti-TB therapy. The amikacin liposome inhalation suspension (ALIS) has received approval from the U.S. Food and Drug Administration (FDA) for the treatment of Mycobacterium avium complex (MAC) lung disease22 and has since been incorporated into multidrug-resistant tuberculosis (MDR-TB) treatment regimens in multiple countries, underscoring the clinical value and broad application prospects of liposomal platforms in TB management23. Nevertheless, the development and industrialization of anti-TB liposomes continue to face several critical technical bottlenecks, including poor reproducibility of preparation processes, low drug loading capacity and encapsulation efficiency, inhomogeneous particle size distribution, aggregation and drug leakage during storage, and a poorly understood correlation between in vitro dissolution/release behavior and in vivo efficacy. These challenges severely impede the research and development process and clinical translation of novel anti-TB liposomal formulations24,25.
This study establishes a thin‑film hydration–ultrasonication–filtration method suitable for encapsulating hydrophobic or weakly lipophilic small‑molecule drugs (e.g., rifampicin) within the phospholipid bilayer. For highly hydrophilic drugs, the conventional thin‑film method gives low encapsulation efficiency unless additional optimization (e.g., ammonium sulfate gradient loading) is applied. The procedure employs standard equipment (rotary evaporator, ultrasonic cleaner, HPLC, DLS, TEM), ensuring easy replication without specialized instruments. The current 10 mL lab‑scale setup yields stable quality and good batch consistency. Industrial scale‑up would require optimization of evaporation vacuum, rotation speed, ultrasonic power, and membrane specifications. Notably, liposomes remain stable within 30 days at 4 °C but exhibit oxidation, aggregation, and stratification after 60 days, necessitating freeze‑drying or formulation modification for long‑term preservation. We systematically optimized the phospholipid-to-cholesterol ratio, standardized the preparation workflow, and established a comprehensive quality evaluation system encompassing encapsulation efficiency, drug loading, particle size, zeta potential, morphology, in vitro release, and storage stability. This protocol provides clear guidance for researchers to assess method suitability for hydrophobic drug delivery and serves as a reference for formulation adaptation, experimental design, and preliminary scale‑up exploration.
Protocol
This study did not involve human participants or animals, and ethics approval was not required.
1. Preparation of rifampicin-loaded nanoliposomes
NOTE: Prepare all formulations in triplicate.
- Weigh the liposome components using a one-hundred-thousandth analytical balance. The mass ratios of phospholipid to cholesterol were set as 95:5, 90:10, 85:15, 80:20, 75:25, and 70:30, respectively (Table 1).
- Place three components into a 100 mL eggplant-shaped flask suitable for rotary evaporation. Dissolve all lipid components in 6 mL of chloroform. Sonicate the mixture in a water bath (40 kHz, 100 W) for 1 min until a clear solution is obtained.
CAUTION: Chloroform is a volatile organic solvent, harmful if inhaled or absorbed through skin. Perform all steps involving chloroform (1.3–1.5) inside a certified chemical fume hood. Wear nitrile gloves, a lab coat, and chemical safety goggles. - Remove the chloroform using a rotary evaporator with the following parameters:
- Set the condenser temperature to no higher than -5 °C.
- Set the water bath temperature to 37 °C
- Set the rotation speed to 60 rpm
- Adjust the Vacuum to 330 mbar to reduce the boiling point of chloroform
CAUTION: The rotary evaporator must be operated inside a fume hood. Ensure the cold trap is properly connected to prevent solvent vapor from entering the vacuum pump.
- Run at 330 mbar for 20 min, then increase the vacuum to 80 mbar and continue for another 10 min to completely remove residual solvent and form a thin lipid film26.
NOTE: Collect the evaporated solvent condensed in the condenser as organic halogen-containing waste. Dispose of all chloroform waste in a properly labeled halogenated organic solvent container. Do not pour down the sink. - Dry the lipid film under vacuum (≤ 80 mbar) at 25 °C for 12 h.
NOTE: The drying step is performed in a vacuum desiccator inside a fume hood to prevent any residual solvent from being released. - Hydrate the dried film with 10 mL of phosphate-buffered saline (PBS) buffer. Place the flask on the rotary evaporator (without vacuum) at 100 rpm and 37 °C for 1 h until the lipid film is fully detached. The final concentration of rifampicin is 1 mg/mL.
- Sonicate in a water bath (40 kHz, 100 W) at 37 °C for 10 min. Ensure the water bath temperature remains at 37 °C. The total volume of the treated sample is 10 mL.
- Filter the sonicated suspension sequentially. Pre‑wet a 0.45 µm PES syringe filter (13 mm diameter) with 1 mL of PBS. Using a 10 mL syringe, pass the entire 10 mL sample through the 0.45 µm filter once. Then, pre‑wet a 0.22 µm PES syringe filter (13 mm diameter) and pass the filtrate through it once. Do not use a liposome extruder (Figure 1).
2. Encapsulation efficiency
NOTE: Encapsulation efficiency (EE) was determined by ultrafiltration centrifugation, which rapidly separates free drug from liposome-entrapped drug based on physical retention. Then, measure the drug content in both fractions and calculate the encapsulation efficiency27.
- Add exactly 200 µL of liposome suspension to the sample reservoir of a 0.5 mL ultrafiltration tube (3 kDa MWCO), then centrifuge to separate free drug from liposomes.
- Centrifuge at 7,000 x g (fixed‑angle rotor) at 25 °C for 15 min. Collect the filtrate in the collection tube, repeat 4–5 cycles.
- Combine all the filtrate and dilute to 10 mL with Methanol in a volumetric flask. Filter through a 0.22 µm Nylon66 syringe filter before HPLC injection.
- Set the HPLC Conditions as follows: Column: C18 column (4.6 mm x 250 mm, 5 µm); Mobile phase: acetonitrile: aqueous phosphoric acid = 45: 55 (V/V); Detection wavelength: 475 nm; Flow rate: 1.0 mL/min; Column temperature: 40 °C; Injection volume: 20 µL; Run time: 20 min
CAUTION: Acetonitrile is flammable and toxic. Prepare and handle the mobile phase in a fume hood. Wear appropriate personal protective equipment (PPE). - Calculate the encapsulation efficiency (EE) using the following equation: Encapsulation Efficiency (EE, %) = [(Wrfb − Wfree) / Wrfb] × 100%
- Calculate the drug loading (DL) using the following equation: Drug Loading (DL, %) = [(Wrfb − Wfree) / Wtotal] × 100%.
NOTE: Wtotal—The total content of added phospholipids, cholesterol, and rifampicin; Wrfb—The content of added rifampicin; Wfree—The content of free drugs in liposomes.
3. HPLC method validation
NOTE: Perform HPLC method validation for linearity, precision, repeatability, stability, recovery, and specificity as follows.
- Prepare rifampicin standard solutions at the following concentrations in mobile phase: 1.15, 2.3, 4.6, 9.2, 13.8, 18.4, and 23.0 µg/mL. Analyze each by HPLC, record peak areas, and calculate the regression equation and R2.
- Measure the peak areas of 9.2, 13.8, and 18.4 µg/mL rifampicin solutions. Perform five parallel tests in one day and calculate the RSD.
- Prepare four parallel 9.2 µg/mL rifampicin solutions. Measure peak areas by HPLC and calculate the method's repeatability RSD.
- Keep the 9.2 µg/mL standard solution at room temperature. Analyze the solution at 0, 2, 4, 6, 12, and 24 h, record peak areas, and calculate RSD for stability.
- Add known rifampicin standard into blank liposome matrices. Process samples by ultrafiltration, analyze by HPLC, and then calculate recovery and RSD.
- Examine the chromatograms for interference peaks at the retention time of rifampicin.
4. Particle size and zeta potential
- Pipette 20 µL of liposome suspension into 980 µL of ultrapure water (pre‑filtered through 0.22 µm). Vortex for 10 s, then sonicate in a water bath for 30 s.
- Transfer the diluted sample into a universal cuvette for size measurement, and into a folded capillary cell for zeta potential measurement.
- Set the parameters as follows: dispersant = water, temperature = 25 °C.
- Perform at least 3 technical replicates, each consisting of 10–15 runs. Record the Z‑average (intensity‑weighted mean hydrodynamic diameter) and polydispersity index (PDI).
- Insert a palladium electrode into the cuvette to measure zeta potential under the same parameters28.
- Remove the cuvette and shut down the instrument.
5. Morphological characterization (TEM)
- Dilute the rifampicin-loaded liposome suspension 50–100 fold with ultrapure water to achieve an appropriate concentration for TEM observation.
- Sonicate the diluted sample in a water bath using a bath sonicator (40 kHz, 100 W) for 30 s.
CAUTION: Avoid excessive sonication to prevent liposome rupture. - Place a 300-mesh carbon-coated copper grid on the filter paper with the carbon side facing up.
- Pipette 10 µL of diluted liposome suspension to the center of the grid. Let it adsorb for 1 min.
- Blot excess suspension from the edge of the grid using clean filter paper; do not touch the central observation area.
- Negative staining: Immediately add 10 µL of 2% (w/v) phosphotungstic acid (pH 7.0) onto the grid. After 1 min, blot off the excess stain from the edge.
- Air‑dry the grid at room temperature for 3 h. Load the dried grid into the TEM sample holder.
- Observe at an accelerating voltage of 80–120 kV. Use low-dose imaging mode29 and acquire images with a CCD camera (e.g., Gatan OneView) at nominal magnifications of 10,000x, 25,000x, and 40,000x.
- Select representative fields and avoid areas with aggregation or staining artifacts.
6. In vitro drug release
- Cut a dialysis membrane (MWCO 7 kDa) into appropriate lengths. Prepare a large-volume solution of 2% (w/v) sodium bicarbonate and 1 mmol/L EDTA, adjusted to pH 8.0.
- Boil the dialysis membrane in this solution for 10 min. Wash the membrane thoroughly with distilled water.
- Equilibrate the washed membrane in release medium (0.01 M PBS) for 30 min. Transfer 1 mL of liposome suspension into the pretreated dialysis bag; seal both ends with dialysis clips.
- Place the dialysis bag into a 100 mL beaker containing 80 mL of pre-warmed release medium at 37 °C, supplemented with 0.1% ascorbic acid (w/v) and 0.1 mL Tween 80. Cover the beaker with aluminum foil to protect it from light.
- Stir in the dark at 37 °C and 200 rpm using a magnetic stirrer. Withdraw 1 mL of release medium at predetermined time points: 0.5, 1.5, 3, 5, 7, 9, 12, 24, and 48 h.
- Add 1 mL of fresh, pre‑warmed release medium (37 °C) to the beaker using a pipette, directing the stream gently against the beaker wall30 (The system is closed; no correction for evaporation is needed).
- Filter samples through a 0.22 µm filter and analyze by HPLC. Analyze the samples using the same HPLC conditions described in Section 2.4.
- Calculate Cumulative Release (%) = (Total drug detected at each time point / Initial drug loading) × 100%
7. Storage stability evaluation
- Store the prepared rifampicin‑loaded liposome suspension in a sealed glass vial at 4 °C, and protect it from light.
- Collect samples at day 1, 4, and 30 after storage. Discard the withdrawn sample (do not return it to the original vial).
- Determine the particle size, polydispersity index, and zeta potential of liposomes at each time point31.
- Record the visual appearance and observe any precipitation or stratification of the liposome suspension.
- Collect extra samples on day 60 to visually observe suspension oxidation, precipitation, and stratification.
NOTE: All measurements were carried out in three parallel experiments. Experimental data were expressed as mean ± standard deviation.
Results
A validated HPLC method was established for the quantification of rifampicin. Representative chromatograms of rifampicin standard solutions are shown in Figure 2A. The main peak of rifampicin appeared at a retention time of 14.13 min, with good peak shape and no significant interference from other peaks. The calibration curve exhibited good linearity over the concentration range of 1.15–23 µg/mL, with the regression equation Y = 12729.5X-4778.6 and a coefficient of determination R2=0.9995. An R2 ≥ 0.999 is generally considered acceptable for quantitative analysis in pharmaceutical laboratories; the obtained value of 0.9995 therefore demonstrates that the method is highly linear across the tested range. Black squares represent measured data points, and the solid line represents the fitted linear regression (Figure 2B).
Precision tests were performed at three rifampicin concentrations (9.2, 13.8, and 18.4 µg/mL). The relative standard deviation (RSD) values of peak areas were all below 1%, confirming high instrumental precision (Table 2). The repeatability test (n = 4) yielded an RSD of 0.32%, indicating reliable repeatability (Table 3). The stability test, conducted over 24 h at room temperature, showed an RSD of 0.59%, demonstrating that the rifampicin solution remained stable under these conditions (Table 4). The average recovery rate was 98.12%, confirming the method’s accuracy for analyzing rifampicin in liposome samples. These results collectively verified that the HPLC method is suitable for the quantitative determination of rifampicin in this study. This rigorous validation ensures that subsequent measurements of encapsulation efficiency, drug loading, and release profiles are reliable and reproducible across different experimental batches.
Free drug and liposome-entrapped drug were separated by ultrafiltration centrifugation. High performance liquid chromatography (HPLC) quantitative analysis showed that when the cholesterol content was 20%, the encapsulation efficiency of rifampicin-loaded liposomes reached a maximum of 68.54 ± 2.19, and the drug loading rate was 11.42 ± 0.37 (Figure 3). When cholesterol is in excess, the encapsulation efficiency and drug-loading rate of liposomes decrease significantly (Table 5). These results demonstrate that a cholesterol-to-phospholipid ratio of 20% is optimal for balancing membrane rigidity and fluidity and retaining rifampicin within the bilayer. The small standard deviations (all <2.2% for EE and <0.4% for DL across triplicate preparations) confirm that the preparation protocol yields consistent formulation quality with good batch‑to‑batch reproducibility.
The liposomes prepared using the optimized method exhibited a narrow size distribution (Figure 4), with an average size of 185 nm. A PDI value <0.3 is widely accepted as indicative of a monodisperse population; the obtained PDI of 0.153 therefore confirms that the liposomes are highly uniform in size. An absolute zeta potential >30 mV generally provides sufficient electrostatic repulsion to prevent aggregation. The measured value of −38 mV thus predicts good colloidal stability32. The low standard deviations across triplicate samples (e.g., size 185.41 ± 0.72 nm at 20% cholesterol) further demonstrate the high reproducibility of the preparation procedure. These results show that the thin‑film hydration‑ultrasonication‑filtration protocol reliably produces nanoscale liposomes with a narrow size distribution and adequate surface charge, thereby ensuring long‑term stability.
The prepared liposomes showed an obvious Tyndall effect. Figure 5A illustrates the Tyndall effect of the liposome33. Morphological characteristics of rifampicin-loaded nanoliposomes were evaluated by TEM and dynamic light scattering (DLS). As shown in Figure 4, the DLS intensity-weighted size distribution curves of the liposomes exhibited a single, narrow peak, with no visible large particles or aggregates, indicating good homogeneity and monodispersity of the prepared formulation (Figure 5B). At low magnification, spherical liposomal vesicles were observed; however, some local aggregation was noted (Figure 5C), which could be attributed to incomplete dispersion during sample preparation, as well as possible vesicle fusion during drying. At high magnification (50,000×, Figure 5D), distinct contrast differences were visible: the dark central region corresponds to the drug-containing aqueous core, while the lighter outer ring represents the lipid bilayer, a typical feature of negatively stained liposomes34.
The particle size observed by TEM was smaller than the hydrodynamic diameter determined by DLS. This discrepancy arises from the different principles of the two techniques: TEM measures the dehydrated core diameter under vacuum, while DLS detects the hydrated diameter, including the surface hydration layer, which is a well-known characteristic of liposomal nanoparticles35.
There was no obvious burst release in the first three liposome groups (the cumulative release rate at 0.5 h was <40% in all groups). A burst release <40% within the first hour is generally considered safe for long‑acting anti‑tuberculosis preparations, as it minimizes the risk of acute systemic toxicity. The specific release stages can be divided as follows:
Rapid release period (0.5–12 h): The drug slowly diffused from the surface layer or near-membrane region of the liposomes, and the release rate was relatively fast. The cumulative release rate of the first three groups was close to 90% at 12 h (Figure 6).
After 24 h, it was speculated that rifampicin underwent oxidative degradation and hydrolytic degradation, resulting in an abnormal decrease in the cumulative release rate36. When the cholesterol content was 30%, the cumulative release rate at 0.5 h was >40%, which did not meet the sustained-release standard.
Therefore, formulations containing 5–15% cholesterol are acceptable, and 20% also meets the burst‑release criterion. The small inter‑batch variability (Figure 6) confirms the reproducibility of the release testing method.
The release data for the first three groups were fit to common kinetic models (zero-order, first-order, Higuchi, and Ritger-Peppas) (Figure 7). The results showed that the first-order kinetic model achieved the highest goodness of fit (R2= 0.987), which was significantly superior to the zero-order (R2= 0.246), Higuchi (R2= 0.544), and Ritger-Peppas (R2 = 0.926) models. This indicates that the drug release behavior of liposomes follows first-order kinetics. The release rate is positively correlated with the residual drug concentration in the liposomes, showing a typical "initial burst release - subsequent sustained release" characteristic, further verifying the mechanism by which cholesterol affects the diffusion rate by regulating the membrane structure37.
The rifampicin-loaded liposomes showed good short-term stability during 30 days of storage at 4 °C. Over the evaluation period of 1, 4, and 30 days, particle size increased mildly, while excellent size homogeneity (PDI < 0.15) and favorable colloidal stability (absolute zeta potential > 24 mV) were maintained (Table 6). Obvious oxidation and floccules were observed on day 60, indicating poor long-term stability of the formulation. This result highlights the necessity of freeze‑drying or formulation modification (e.g., addition of antioxidants or lyoprotectants) for long‑term preservation – an important practical takeaway for researchers using this protocol.
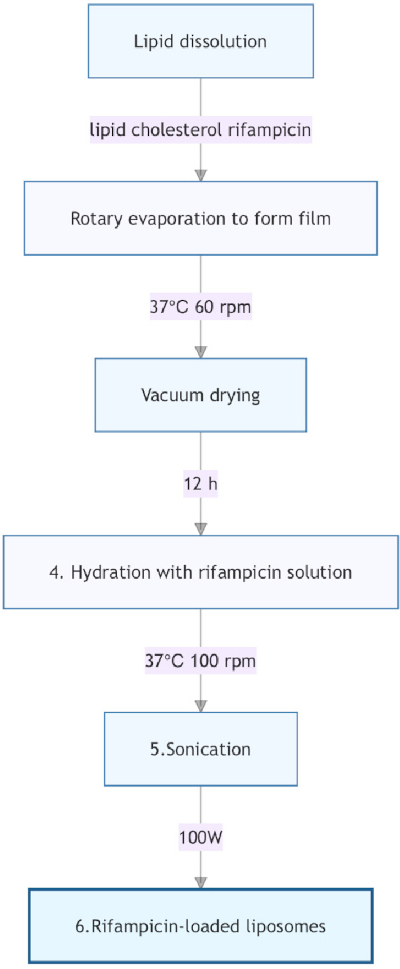
Figure 1. Preparation of rifampicin-loaded liposomes by thin-film hydration. Schematic workflow illustrating the preparation of rifampicin-loaded liposomes. Lipid components were dissolved in an organic solvent, followed by thin-film formation through rotary evaporation, vacuum drying, hydration, and sonication to produce the final liposomal formulation. Please click here to view a larger version of this figure.
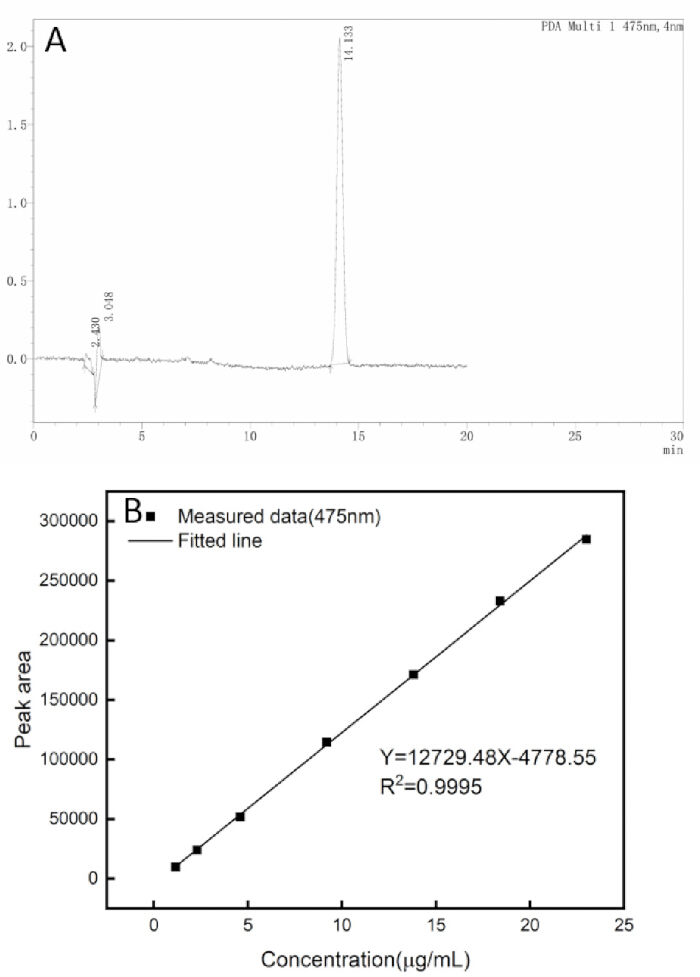
Figure 2. HPLC identification and calibration of rifampicin. (A) Representative HPLC chromatogram of rifampicin showing the characteristic retention peak used for quantitative analysis. (B) Calibration curve generated by plotting peak area against rifampicin concentration (1.15–23.0 µg/mL). The regression equation and correlation coefficient (R2 = 0.9995) demonstrate excellent linearity over the tested concentration range. Please click here to view a larger version of this figure.
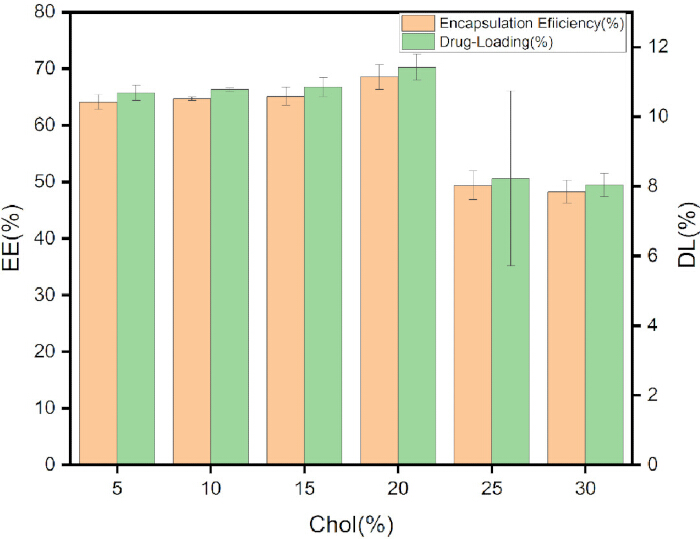
Figure 3. Encapsulation efficiency and drug loading of rifampicin-loaded liposomes. Encapsulation efficiency (EE) and drug loading (DL) of liposomes prepared with varying cholesterol contents. The highest EE (68.5%) and DL (11.4%) were observed at 20% cholesterol, indicating that cholesterol content significantly influences drug encapsulation and loading. Error bars represent mean × SD (n = 3). Please click here to view a larger version of this figure.
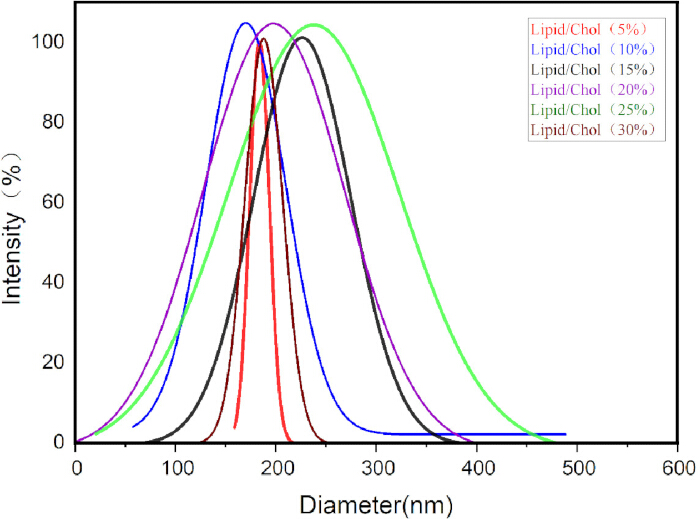
Figure 4. Particle size distribution of rifampicin-loaded liposomes. Particle size distribution profiles of rifampicin-loaded liposomes prepared with different phospholipid-to-cholesterol ratios. The optimized formulation exhibited a Z-average diameter of 185 nm and a polydispersity index (PDI) of 0.153, indicating a narrow size distribution and good homogeneity. Please click here to view a larger version of this figure.
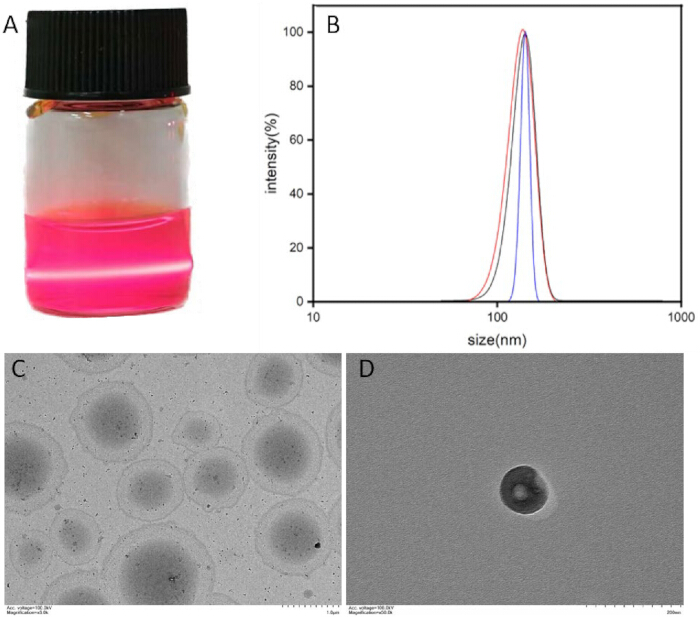
Figure 5. Physicochemical characterization of rifampicin-loaded liposomes. (A) The Tyndall effect observed in the rifampicin-loaded liposome suspension indicates the presence of nanoscale particles. (B) Particle size distribution curves from three parallel replicates of the optimized liposome formulation. (C) Transmission electron microscopy (TEM) image showing multiple spherical liposomal vesicles. (D) Representative high-magnification TEM image of an individual liposomal vesicle. Please click here to view a larger version of this figure.
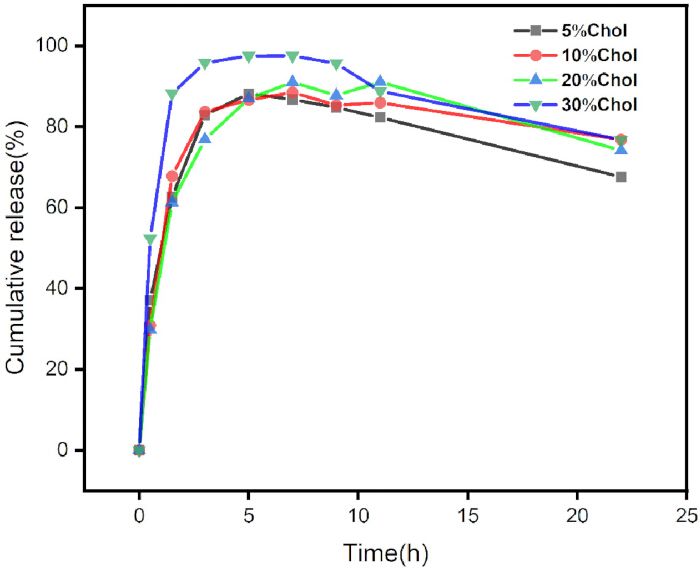
Figure 6. In vitro release profiles of rifampicin from liposomes. Cumulative release profiles of rifampicin from liposomes prepared with different phospholipid-to-cholesterol ratios over the study period. Release behavior varied with cholesterol content, demonstrating its influence on drug release characteristics. Please click here to view a larger version of this figure.
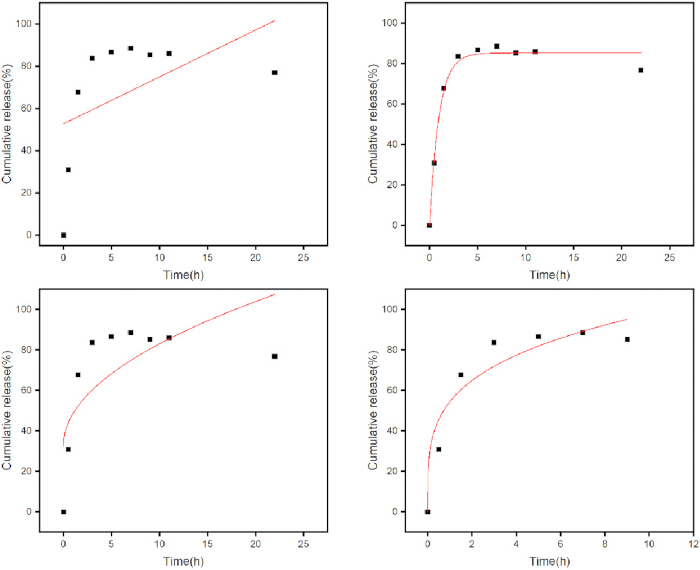
Figure 7. Kinetic modeling of rifampicin release from liposomes. Release data for the optimized formulation (20% cholesterol) fitted to (A) zero-order, (B) first-order, (C) Higuchi, and (D) Ritger-Peppas kinetic models. The first-order model had the highest goodness-of-fit (R2 = 0.987), indicating the best agreement with the experimental release data. Please click here to view a larger version of this figure.
| Liposome components | Lecithin | Cholesterol | Rifampicin |
| 5% | 47.5 mg | 2.5 mg | 10 mg |
| 10% | 45 mg | 5 mg | 10 mg |
| 15% | 42.5 mg | 7.5 mg | 10 mg |
| 20% | 40 mg | 10 mg | 10 mg |
| 25% | 37.5 mg | 12.5 mg | 10 mg |
| 30% | 35 mg | 15 mg | 10 mg |
| Final volume | 10 mL | ||
Table 1: Composition of rifampicin-loaded liposome formulations. Lecithin, cholesterol, and rifampicin were used to prepare liposomes with different phospholipid-to-cholesterol ratios, while maintaining a final volume of 10 mL.
| Concentration (µg/mL) | `X±S | RSD(%) |
| 9.2 | 114012.75 ± 502.42 | 0.44 |
| 13.8 | 171412.50 ± 493.90 | 0.29 |
| 18.4 | 232334.00 ± 1358.42 | 0.59 |
Table 2: HPLC Quantification precision at different rifampicin concentrations. Peak area measurements were obtained for rifampicin standard solutions at concentrations of 9.2, 13.8, and 18.4 µg/mL. Results are presented as mean ± standard deviation (SD), with relative standard deviation (RSD) values demonstrating high analytical precision.
| NO. | 1 | 2 | 3 | 4 | RSD (%) |
| Peak area | 114503 | 114125 | 113969 | 114539 | 0.32 |
Table 3: Instrument precision of the HPLC method. Precision evaluation based on four consecutive injections of the same rifampicin standard solution. Peak area values and relative standard deviation (RSD) are reported to assess instrument repeatability.
| Time (h) | 0 | 2 | 4 | 6 | 8 | 12 | 24 | RSD (%) |
| Peak area | 114503 | 114325 | 114516 | 113978 | 113894 | 113638 | 112576 | 0.59% |
Table 4: Stability of the rifampicin standard solution. Stability assessment of a 9.2 µg/mL rifampicin standard solution stored at room temperature and analyzed at 0, 2, 4, 6, 8, 12, and 24 h. Peak area values and relative standard deviation (RSD) are reported to evaluate solution stability over the test period.
| Cholesterol | Size(nm) | PDI | Zeta potential (mV) | EE (%) | DL (%) |
| 5% | 206.27±1.14 | 0.240±0.004 | -42.72±0.26 | 64.09±1.30 | 10.68±0.22 |
| 10% | 183.87±2.54 | 0.149±0.004 | -24.80±1.04 | 64.70±0.30 | 10.78±0.05 |
| 15% | 202.06±3.16 | 0.131±0.007 | -27.90±1.04 | 65.11±1.62 | 10.85±0.27 |
| 20% | 185.41±0.72 | 0.164±0.044 | -37.74±1.44 | 68.54±2.19 | 11.42±0.37 |
| 25% | 181.58±1.31 | 0.100±0.008 | -19.96±0.16 | 49.38±2.52 | 8.23±0.42 |
| 30% | 178.78±0.82 | 0.074±0.014 | -40.25±0.33 | 48.24±2.06 | 8.04±0.34 |
Table 5: Physicochemical characteristics of rifampicin-loaded liposomes. Particle size, polydispersity index (PDI), zeta potential, encapsulation efficiency (EE), and drug loading (DL) of liposomes prepared with different cholesterol contents. Data are presented as mean ± SD (n = 3).
| 1 days | 4 days | 30 days | |
| Size(nm) | 183.87±2.54 | 212.42±3.12 | 273.57±4.38 |
| PDI | 0.149±0.004 | 0.106±0.002 | 0.126±0.009 |
| Zeta potential(mV) | -24.80±1.04 | -57.12±1.49 | -55.38±2.50 |
Table 6: Storage stability of rifampicin-loaded liposomes at 4 °C. Changes in particle size, polydispersity index (PDI), and zeta potential of rifampicin-loaded liposomes after storage for 1, 4, and 30 days at 4 °C. Results were used to evaluate the physical stability of the liposomal formulation during storage.
Discussion
Rifampicin remains a cornerstone of first-line anti-tuberculosis chemotherapy, yet its clinical utility is severely compromised by dose-dependent hepatotoxicity, poor intracellular penetration into Mycobacterium tuberculosis (MTB)-harboring macrophages, and rapid emergence of drug resistance under subtherapeutic exposure. To address these unmet clinical needs, this study established and optimized a robust thin-film hydration protocol coupled with ultrasonication and filtration for the fabrication of rifampicin-loaded liposomes. The optimized formulation exhibited uniform nanoscale particle size, intact vesicular morphology, high drug encapsulation efficiency, and sustained in vitro drug release profile, with comprehensive physicochemical characterization performed via dynamic light scattering (DLS), transmission electron microscopy (TEM), high-performance liquid chromatography (HPLC), and in vitro dissolution testing.
Several protocol steps critically influence liposome quality and reproducibility. First, the phospholipid‑to‑cholesterol ratio is paramount. The optimal 80:20 ratio yields EE = 68.5% and DL = 11.4%; deviations to 75:25 or 70:30 cause >30% EE loss. Precise weighing with a one ‑hundred‑thousandth balance is mandatory. Second, hydration (section 1.6) requires rotation at 100 rpm, 37 °C for 1 h on a rotary evaporator without vacuum. Static incubation or manual shaking leads to poor reproducibility. Third, ultrasonication (section 1.7): 40 kHz, 100 W, 10 min at 37 °C yields a Z‑average of 185 nm and a PDI < 0.2. Shorter sonication (5 min) yields >300 nm and PDI > 0.3; longer sonication (20 min) risks drug degradation. Maintain 37 °C because rifampicin is heat‑sensitive. Fourth, for sequential filtration (0.45 µm then 0.22 µm), pre-wet filters with PBS and use one gentle pass. Forcing through dry filters or using a small syringe may rupture vesicles. Fifth, ultrafiltration for EE (sections 2.1–2.3): exactly 200 µL, 4 cycles at 7,000 × g, 25 °C, collecting and combining all filtrates after each cycle. Incomplete cycles overestimate EE. Sixth, TEM negative staining (section 5.6): 2% phosphotungstic acid, pH 7.0, immediate blotting. Delay or wrong pH collapses vesicles. Following these six steps consistently yields liposomes that meet the acceptance criteria, as evidenced by low standard deviations across triplicates.
Cholesterol is a critical structural component of liposomal bilayers, with well–documented dual effects on membrane fluidity, mechanical stability, and lipophilic drug retention. In this study, we systematically evaluated the impact of cholesterol molar ratio on formulation performance and found that the maximum encapsulation efficiency of 68.5% was achieved at a cholesterol content of 20% (mass ratio). This optimal ratio is postulated to strike a balance between preserving the ordered lamellar structure of the phospholipid bilayer to minimize drug leakage and maintaining sufficient membrane fluidity to accommodate lipophilic rifampicin molecules within the bilayer hydrophobic core. Conversely, cholesterol content exceeding 20% led to excessive rigidification of the lipid bilayer, disruption of the regular lamellar arrangement, and subsequent significant reductions in both encapsulation efficiency and drug loading capacity. These findings align with the established mechanistic understanding of cholesterol’s role in liposomal membrane engineering. Therefore, precise lipid weighing (using a one-hundred-thousandth balance) and strict adherence to the 20% cholesterol mass ratio are mandatory for achieving high drug loading.
The optimized rifampicin-loaded liposomes exhibited a mean hydrodynamic diameter of 185 nm with a polydispersity index (PDI) of 0.164 ± 0.044, indicating a highly uniform particle size distribution. This nanoscale dimension (< 200 nm) is not only compatible with the enhanced permeability and retention (EPR) effect for passive targeting to inflamed pulmonary tuberculous lesions, but also optimal for efficient phagocytosis by alveolar macrophages—the primary intracellular niche of MTB. This particle size design has the potential to address the core limitation of free rifampicin, which fails to achieve therapeutic concentrations within MTB-infected macrophages. The zeta potential of −38 mV for the optimized formulation provides strong interparticle electrostatic repulsion, effectively preventing vesicle aggregation, fusion, and sedimentation during short-term storage, thereby ensuring excellent colloidal stability. Notably, the core particle size measured by TEM was smaller than the hydrodynamic diameter obtained via DLS, a well-documented phenomenon in liposome characterization: DLS quantifies the hydrated vesicle diameter, including the surrounding aqueous hydration layer, while TEM imaging captures the dehydrated lipid core under high-vacuum conditions. This discrepancy is therefore an expected and physicochemically rational finding, rather than an inconsistency in characterization.
TEM imaging further validated the morphological characteristics of the optimized liposomes, which presented as mostly uniform, spherical, intact unilamellar vesicles with only minor local aggregation and no obvious fusion or membrane rupture. These findings confirm that the combined ultrasonication and filtration process enables precise control over vesicle morphology and lamellarity, while preserving the structural integrity of the liposomal bilayer. Structural integrity is a critical quality attribute for liposomal formulations, as it directly correlates with drug retention during storage, in vivo circulation stability, and targeted delivery performance. In addition, the prominent Tyndall effect observed in the liposome suspension further confirmed the colloidal nature of the nanoscale vesicle dispersion.
In vitro drug release studies demonstrated that the optimized rifampicin-loaded liposomes exhibited no significant burst release within the first 0.5 h, a critical feature that mitigates the risk of acute systemic toxicity associated with rapid peak plasma concentrations of free rifampicin. Drug release kinetic modeling revealed that the release profile was best fit by a first-order kinetic model, indicating that rifampicin release from the liposomal bilayer was predominantly governed by passive diffusion rather than lipid matrix erosion. This diffusion-controlled sustained-release pattern is highly desirable for anti-tuberculosis therapy, as it enables prolonged maintenance of effective therapeutic drug concentrations, thereby reducing the risk of subtherapeutic exposure that drives the emergence of drug resistance. A slight reduction in cumulative drug release was observed after 24 h, which is most likely attributable to the oxidative and hydrolytic degradation of unencapsulated rifampicin in the aqueous release medium, a finding consistent with previously published stability data for rifampicin in aqueous environments38. Importantly, the liposomal bilayer provides a protective microenvironment for the encapsulated drug, reducing its exposure to degradative conditions relative to free rifampicin.
The optimized rifampicin-loaded liposomal formulation developed in this study offers multiple distinct advantages for anti-tuberculosis therapy, directly addressing the key limitations of conventional rifampicin chemotherapy. First, the liposomal bilayer provides a protective barrier against premature drug degradation in aqueous and biological environments, thereby preserving rifampicin's antimicrobial activity. Second, the sustained diffusion-controlled release profile prolongs the drug's systemic circulation half-life, enabling reduced dosing frequency and improved patient treatment adherence—a major challenge in long-term tuberculosis chemotherapy. Third, the optimized nanoscale particle size facilitates both passive targeting to inflamed tuberculous lesions via the EPR effect and efficient uptake by MTB-infected alveolar macrophages, achieving high intracellular drug concentrations unobtainable with free rifampicin39,40. Finally, the formulation is constructed from biocompatible, naturally derived phospholipids and cholesterol, minimizing the risk of immunogenicity or systemic toxicity associated with the delivery vehicle itself.
Notably, this study has several limitations to be addressed in future research. While the in vitro physicochemical characterization and release profiling demonstrate promising formulation performance, further in vivo studies are required to evaluate the pharmacokinetic behavior, tissue distribution, anti-tuberculosis efficacy, and systemic toxicity of the rifampicin-loaded liposomes in relevant animal models. In addition, the scalability of the optimized preparation protocol for industrial-scale manufacturing warrants further validation.
In conclusion, this study established a simple, highly reproducible, and robust thin-film hydration-ultrasonication- filtration protocol for the fabrication of rifampicin-loaded liposomes. Systematic formulation optimization identified the critical role of cholesterol content in governing encapsulation efficiency and membrane stability, with the optimized formulation exhibiting ideal physicochemical properties, high drug encapsulation efficiency, excellent colloidal stability, and controlled, sustained in vitro drug release. This standardized protocol provides a reliable methodological framework for the development and characterization of liposomal anti-tuberculosis drug delivery systems and lays a solid foundation for subsequent preclinical evaluation of liposomal rifampicin for the treatment of both drug-susceptible and drug-resistant tuberculosis.
Disclosures
The authors have no conflicts of interest to disclose.
Acknowledgements
This research was supported by the National Natural Science Foundation of China (No. 21977019).
Materials
| Name | Company | Catalog Number | Comments |
|---|---|---|---|
| L-α-Phosphatidylcholine (Soybean) | RHAWN | R024502 | ≥90% purity , 25 g/bottle, CAS: 97281-47-5 |
| 1× PBS Buffer | Solarbio | P1038 | 500 mL, 0.01 mol/L, pH 6.5 |
| 1× PBS Buffer, pH 7.4 | ThermoFisher Scientific (Gibco) | C10010500BT-1 | 500 mL, pH 7.4 |
| Chloroform | Guangzhou Brand | GD10-AR-2.5L | AR grade, 500 mL/bottle, CAS: 67-66-3 |
| Cholesterol | Aladdin | C104028-5g | AR grade, ≥95% (HPLC), 5 g/bottle, CAS 57-88-5 |
| Dialysis Membranes (MD25, 7000 Da) | Solarbio | YA1081-5m | 7000 Da MWCO, 5 m length, non-metallic material |
| High-Performance Liquid Chromatography (HPLC) System, LC-20A | Shimadzu Corporation, Japan | LC-20A | The system is equipped with an SPD-20A UV detector, a CBM-20A quaternary pump, an LC-20AT online degasser, an SIL-20A auto-sampler, a CTO-20A column oven, and LC-solution workstation software. It was used for the quantitative determination of rifampicin. |
| High-speed Desktop Centrifuge | Shanghai Anting Scientific Instrument Factory | TGL-16B | Used for the centrifugation of samples |
| L-Ascorbic acid | Macklin | A800296 | 99.99% purity , 100 g/bottle, CAS: 50-81-7 |
| Omni Particle Size and Zeta Potential Analyzer | Brookhaven Instruments Corporation, USA | 173PI | Used for determination of particle size, polydispersity index (PDI) and zeta potential of liposomes |
| Rifampicin | Macklin | R817237 | 97% purity, 250 mg/bottle, CAS: 13292-46-1 |
| Transmission Electron Microscope (TEM) | Hitachi, Ltd., Japan | HT7700 | Used for morphological observation of liposomes |
| Tween 80 | Energy Chemical | E0807391000-A01 | AR grade, 100 mL/bottle, CAS: 9005-65-6 |
| Ultrafiltration Centrifugal Filter Units (0.5 mL, 3 kDa) | Merck Millipore | UFC500396 | 3 kDa MWCO, 0.5 mL volume, plastic material |
References
- World Health Organization. Global tuberculosis report 2025. Geneva: World Health Organization; 2025.
- Wei X, Yue L, Zhao B, Jiang N, Lei H, Zhai X. Recent advances and challenges of revolutionizing drug-resistant tuberculosis treatment. Eur J Med Chem. 2024;277:116785.
- World Health Organization. Consolidated guidelines on tuberculosis: module 4: treatment and care. Geneva: World Health Organization; 2022.
- Singh V. Tuberculosis treatment-shortening. Drug Discov Today. 2024;29(5):103955.
- Li SY, et al. Next-generation diarylquinolines improve sterilizing activity of regimens with pretomanid and the novel oxazolidinone TBI-223 in a mouse tuberculosis model. Antimicrob Agents Chemother. 2023;67(4).
- Timm J, et al. Baseline and acquired resistance to bedaquiline, linezolid and pretomanid, and impact on treatment outcomes in four tuberculosis clinical trials containing pretomanid. PLOS Glob Public Health. 2023;3(10).
- Chesov E, et al. Emergence of bedaquiline resistance in a high tuberculosis burden country. Eur Respir J. 2022;59(3):2100621.
- Dhillon J, Mitchison DA. Activity and penetration of antituberculosis drugs in mouse peritoneal macrophages infected with Mycobacterium microti OV254. Antimicrob Agents Chemother. 1989;33(8):1255-9.
- Ge Z, Wang Z, Wei M. Measurement of the concentration of three antituberculosis drugs in the focus of spinal tuberculosis. Eur Spine J. 2008;17(11):1482-7.
- Parbhoo T, Schurz H, Mouton JM, Sampson SL. Persistence of Mycobacterium tuberculosis in response to infection burden and host-induced stressors. Front Cell Infect Microbiol. 2022;12:981827.
- Sarathy JP, et al. Prediction of drug penetration in tuberculosis lesions. ACS Infect Dis. 2016;2(8):552-63.
- Fountain FF, Tolley EA, Jacobs AR, Self TH. Rifampin hepatotoxicity associated with treatment of latent tuberculosis infection. Am J Med Sci. 2009;337(5):317-20.
- Chen X, et al. Acquired resistance during short-course treatment for rifampicin-resistant tuberculosis. Clin Microbiol Infect. 2026;32(2):315-22.
- Singh V, Chibale K. Strategies to combat multi-drug resistance in tuberculosis. Acc Chem Res. 2021;54(10):2361-76.
- Pinto-Alphandary H, Andremont A, Couvreur P. Targeted delivery of antibiotics using liposomes and nanoparticles: research and applications. Int J Antimicrob Agents. 2000;13:155-68.
- Drulis-Kawa Z, Dorotkiewicz-Jach A. Liposomes as delivery systems for antibiotics. Int J Pharm. 2010;387(1-2):187-98.
- Singh SR, et al. Advancing tuberculosis chemotherapy: targeted nanomedicines for the mycobacterium TB granuloma. Small. 2025;21(49).
- Ferreira M, et al. Liposomes as antibiotic delivery systems: a promising nanotechnological strategy against antimicrobial resistance. Molecules. 2021;26(7):2047.
- Zweijpfenning SMH, et al. Safety and outcomes of amikacin liposome inhalation suspension for Mycobacterium abscessus pulmonary disease: a NTM-NET study. Chest. 2022;162(1):76-81.
- Allen TM, Cullis PR. Liposomal drug delivery systems: from concept to clinical applications. Adv Drug Deliv Rev. 2013;65(1):36-48.
- Truzzi E, et al. Drugs/lamellae interface influences the inner structure of double-loaded liposomes for inhaled anti-TB therapy: an in-depth small-angle neutron scattering investigation. J Colloid Interface Sci. 2019;541:399-406.
- U.S. Food and Drug Administration. ARIKAYCE (amikacin liposome inhalation suspension) [prescribing information]. Silver Spring (MD): U.S. Food and Drug Administration; 2018.
- Yıldırım M, Düzgüneş N. Liposome-encapsulated antibiotics for the therapy of mycobacterial infections. Antibiotics (Basel). 2025;14(7):728.
- Yun Y, et al. Recent advances in functional lipid-based nanomedicines as drug carriers for organ-specific delivery. Nanoscale. 2025;17(13):7617-38.
- Farooque F, Mughees MM, Wasi M. Liposomes as drug delivery system: an updated review. J Drug Deliv Ther. 2021;11(5 Suppl):149-58.
- Wang Z, Liu L, Yin W, Liu Z, Shi L, Tang M. A novel drug delivery system: the encapsulation of naringenin in metal-organic frameworks into liposomes. AAPS PharmSciTech. 2021;22(2):61.
- Niu NK, et al. Preparation and characterization of HRZ triple anti-tuberculosis drugs/TGF-β1 siRNA nanoliposomes. Orthop J China. 2018;26(23):2177-82.
- Wang Y, et al. Formulation and pharmacokinetic evaluation of a paclitaxel nanosuspension for intravenous delivery. Int J Nanomedicine. 2011;6:1497-507.
- Mishra M, et al. Mycobacterial lipid-derived immunomodulatory drug-liposome conjugate eradicates endosome-localized mycobacteria. J Control Release. 2023;360:578-90.
- Yoshizawa Y, Kono Y, Ogawara KI, Kimura T, Higaki K. PEG liposomalization of paclitaxel improved its in vivo disposition and anti-tumor efficacy. Int J Pharm. 2011;412(1-2):132-41.
- Guo LN, et al. Liposome and exosome pre-treatment for transmission electron microscopy and morphological observation. Acta Sci Nat Univ Sunyatseni. 2025;64(4):62-68.
- Crommelin DJA, van Bommel EMG. Stability of liposomes on storage: freeze dried, frozen or as an aqueous dispersion. Pharm Res. 1984;1(4):159-63.
- Wang F, et al. Nanoliposome-encapsulated brinzolamide-hydropropyl-β-cyclodextrin inclusion complex: a potential therapeutic ocular drug-delivery system. Front Pharmacol. 2018;9:91.
- Ubhe AS. Imaging of liposomes by negative-stain transmission electron microscopy and cryo-transmission electron microscopy. Methods Mol Biol. 2023;2633:245-51.
- Filippov SK, et al. Dynamic light scattering and transmission electron microscopy in drug delivery: a roadmap for correct characterization of nanoparticles and interpretation of results. Mater Horiz. 2023;10:2023-42.
- Wallenwein CM, et al. How wound environments trigger the release from rifampicin-loaded liposomes. Int J Pharm. 2023;633:122606.
- Forte J, et al. Mucoadhesive rifampicin-liposomes for the treatment of pulmonary infection by Mycobacterium abscessus: chitosan or ε-poly-L-lysine decoration. Biomolecules. 2023;13(6):924.
- Sorokoumova GM, et al. Bacteriostatic activity and decomposition products of rifampicin in aqueous solution and liposomal composition. Pharm Chem J. 2008;42:475-8.
- Fenaroli F, et al. Enhanced permeability and retention-like extravasation of nanoparticles from the vasculature into tuberculosis granulomas in zebrafish and mouse models. ACS Nano. 2018;12(8):8646-61.
- Hamed A, Osman R, Al-Jamal KT, Holayel SM, Geneidi AS. Enhanced antitubercular activity, alveolar deposition and macrophage uptake of mannosylated stable nanoliposomes. J Drug Deliv Sci Technol. 2019;51:513-23.