This retrospective observational study found that a 3-week course of omega-3 PUFA-enriched ONS was associated with better short-term maintenance of WBC and NE counts, and higher body weight and BMI, compared with dietary counseling alone, suggesting potential hematological and anthropometric nutritional benefits.
A subscription to JoVE is required to view this content. Sign in or start your free trial.
Research Article
Association of Omega-3 PUFA Oral Nutritional Supplementation with Hematological and Nutritional Status in Discharged Malnourished GI Cancer Patients
* These authors contributed equally
In This Article
Summary
Abstract
Short-term associations of omega-3 polyunsaturated fatty acids (PUFA)-enriched oral nutritional supplementation (ONS) with hematological, nutritional, and immune-inflammatory outcomes were evaluated in a retrospective cohort of 87 malnourished or nutritionally at-risk patients with gastrointestinal (GI) cancer. During a 3-week observation period, 46 patients received omega-3 PUFA-enriched ONS plus dietary counseling, whereas 41 received dietary counseling alone. The groups differed at baseline in tumor site, body-weight status, and recent weight loss, whereas oncological treatment category and supportive treatment did not differ statistically. Unadjusted change analyses showed a smaller decline in neutrophil (NE) count in the ONS group (P for Δ = 0.007), whereas between-group differences in white blood cell (WBC) and platelet (PLT) changes were not statistically significant. The larger reductions in the neutrophil-to-lymphocyte ratio (NLR), platelet-to-lymphocyte ratio (PLR), and systemic immune-inflammation index (SII) in the control group coincided with greater declines in NE and PLT and were therefore not interpreted as evidence of an anti-inflammatory benefit. In linear regression models adjusted for the corresponding baseline value, tumor site, and weight-loss status, ONS receipt was associated with higher week-3 body weight (adjusted difference, 1.49 kg; 95% CI, 0.58–2.39; P = 0.002), body mass index (BMI) (0.51 kg/m2; 95% CI, 0.19–1.02; P = 0.002), WBC (1.08 × 10⁹/L; 95% CI, 0.24–1.92; P = 0.012), and NE count (0.97 × 10⁹/L; 95% CI, 0.30–1.64; P = 0.005). Adjusted NLR was also higher in the ONS group (adjusted difference, 0.60; 95% CI, 0.07–1.13; P = 0.028), whereas PLT, C-reactive protein (CRP), PLR, SII, albumin (ALB), and prognostic nutritional index (PNI) did not differ significantly. Thus, receipt of omega-3 PUFA-enriched ONS was associated with a potential myeloprotective effect and more favorable short-term weight outcomes, but not with a consistent reduction in systemic inflammation.
Introduction
Gastrointestinal (GI) cancers represent a formidable global health challenge, accounting for a substantial proportion of cancer-related morbidity and mortality worldwide1. While systemic chemotherapy offers therapeutic benefits, it frequently induces severe malnutrition, cachexia, and chronic systemic inflammation2. This triad of complications not only compromises patients’ quality of life but also impairs immune competence, reduces tolerance to subsequent treatment cycles, and is independently associated with poorer clinical outcomes3. The post-discharge period for patients undergoing chemotherapy is particularly vulnerable, underscoring the need for effective interventions to mitigate treatment-associated morbidity.
In this context, nutritional status has emerged as a pivotal determinant of patient prognosis and treatment response. Malnutrition in cancer is not merely a caloric deficit but is intricately linked with metabolic dysregulation and persistent inflammation, which can fuel tumor progression and immunosuppression4. Standard post-discharge nutritional support, therefore, emphasizes individualized dietary counseling and adequate caloric and protein intake. Immunonutrition extends this approach by incorporating nutrients with potential immunomodulatory properties5,6. Omega-3 polyunsaturated fatty acids (PUFAs), particularly eicosapentaenoic acid (EPA) and docosahexaenoic acid (DHA), are structural components of cell membranes and precursors of bioactive lipid mediators that may influence inflammatory signaling and immune cell function7,8,9,10. An omega-3 PUFA-enriched oral nutritional supplement (ONS) differs from dietary counseling alone by providing a standardized source of energy and protein together with these bioactive fatty acids.
Evidence supporting omega-3 PUFA ONS in patients with GI cancer remains heterogeneous. Some studies report benefits in reducing chemotherapy-induced toxicity or improving nutritional parameters, while others show limited or no benefit, influenced by factors such as dosage, EPA/DHA ratio, and study design5,11. Much of the existing evidence concerns perioperative nutrition rather than short-term post-discharge support during oncological treatment12,13, and the use of multi-component immunonutrition formulas may obscure the contribution of omega-3 PUFAs14.
To address these uncertainties, this retrospective study examined the associations of a 3-week course of omega-3 PUFA-enriched ONS from December 2021 to December 2023. During the 3-week observation period, 46 patients received omega-3 PUFA-enriched ONS plus dietary counseling, whereas 41 patients received dietary counseling alone, focusing on conventional energy and protein targets. This comparison was designed to explore whether omega-3 PUFA-enriched ONS was associated with additional short-term benefits beyond standard caloric nutritional support. The principal analytical focus was the short-term changes in white blood cell (WBC), neutrophil (NE), and platelet (PLT) counts as measures of hematological tolerance. Body weight and body mass index (BMI) were assessed as anthropometric nutritional measures, whereas albumin (ALB) and prognostic nutritional index (PNI) were evaluated as nutrition-related indicators. C-reactive protein (CRP) was assessed as a conventional marker of systemic inflammation, while neutrophil-to-lymphocyte ratio (NLR), platelet-to-lymphocyte ratio (PLR), and systemic immune-inflammation index (SII) were treated as exploratory composite immune-inflammatory indices and interpreted in conjunction with component blood-cell counts.
Accordingly, the primary objective was to determine whether documented receipt of omega-3 PUFA-enriched ONS was associated with better short-term maintenance of hematological measures than dietary counseling alone. Secondary objectives were to examine its associations with anthropometric and nutrition-related outcomes and to explore changes in conventional and composite immune-inflammatory indices. Given the nonrandomized retrospective design, the analyses were intended to characterize potential hematological and nutritional associations, including findings relevant to a possible myeloprotective role, rather than establish intervention efficacy or causality. This hypothesis-generating evidence may inform the design of future prospective randomized controlled trials.
Access restricted. Please log in or start a trial to view this content.
Protocol
This study was approved by the Ethics Committee of Ningbo No.2 Hospital (Approval No. YJ-NBEY-KY-2023-038-01). The requirement for written informed consent was waived by the Ethics Committee.
Study design and participants
This study was a retrospective cohort analysis of routinely collected clinical records from outpatients with GI cancer who received nutritional counseling between December 2021 and December 2023. It was neither a secondary analysis of a clinical trial nor a prospective quasi-experimental study. Patients were identified from medical records based on their diagnosis of GI cancer, initiation of chemotherapy, and documented nutritional status. The inclusion criteria were: (1) histologically confirmed GI cancer requiring chemotherapy; (2) age 18–80 years with a Karnofsky Performance Status (KPS) score ≥6015; (3) malnutrition or risk of malnutrition, as determined by the Patient-Generated Subjective Global Assessment (PG-SGA)16; and (4) the ability to tolerate enteral nutrition. The exclusion criteria were: (1) the presence of another primary malignancy or distant metastasis of GI cancer; (2) known allergy to omega-3 PUFAs or any component of the ONS; and (3) loss to follow-up or discontinuation of chemotherapy due to severe adverse events. A total of 160 patients attended nutritional counseling, of whom 72 elected to receive omega-3 PUFA-enriched ONS in addition to their usual diet (ONS group), whereas 88 received dietary counseling alone (control group). To be included in the analytical cohort, patients were required to have both baseline and week-3 measurements available for at least one laboratory or anthropometric outcome. Patients with missing measurements for a specific outcome were retained in analyses of other outcomes for which paired baseline and week-3 data were available. Consequently, the analytical sample size varied across outcomes, and no missing values were imputed. Ultimately, 87 patients met the eligibility criteria and were included in the analysis, comprising 46 patients in the ONS group and 41 patients in the control group. Additional details of this real-world clinical study have been reported previously17.
Omega-3 PUFA-enriched ONS
The ONS group received omega-3 PUFA-enriched ONS for 3 weeks in addition to dietary counseling. The omega-3 PUFA-enriched ONS was an energy-dense nutritional supplement containing 1.2 g/100 kJ protein, 1.08 g/100 kJ fat (EPA: DHA = 3:2), 2.27 g/100 kJ carbohydrate, and 0.13 g/100 kJ fiber. The composition and dosage of the ONS were standardized in accordance with clinical guidelines for cancer nutrition support. The prescribed daily ONS dose was 400 mL, administered as two 200-mL bottles with meals. The formula contained a total of 3.0 g/L of EPA plus DHA; therefore, the prescribed daily dose provided 720 mg of EPA and 480 mg of DHA. Daily energy intake was targeted at 25–30 kcal/kg, with protein intake of 1.2–1.5 g/kg18.
During the 3-week observation period, patients in both groups received weekly telephone follow-up as part of routine post-discharge nutritional care. However, the medical records and telephone follow-up notes did not contain patient-level documentation of actual ONS consumption or patient-reported adherence. Therefore, no quantitative or reliable qualitative adherence data could be extracted, and adherence to the prescribed ONS regimen could not be formally assessed.
Demographic, anthropometric and clinical data
Baseline demographic characteristics, including age and sex, tumor site (sigmoid colon, ascending colon, transverse colon, descending colon, rectum, and stomach), body weight status (normal/underweight or overweight/obese), body weight change (maintained or increased vs. decreased), and the oncological and supportive treatments administered during the 3-week observation period, were collected for both groups. Oncological treatments were categorized as follows: (1) oxaliplatin-based combination chemotherapy, including FOLFOX, TOMOX, XELOX, and SOX; (2) fluoropyrimidine monotherapy, including capecitabine and S-1; (3) irinotecan-based combination chemotherapy, represented by FOLFIRI; and (4) no concurrent systemic chemotherapy, including surgery alone (Supplementary Table 1). Supportive treatments were categorized as granulocyte colony-stimulating factor, oral leukopoietic agents, or no supportive treatment (Supplementary Table 1).
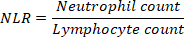
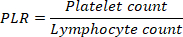
Anthropometric measurements (body weight and BMI) and blood samples for hematological, inflammatory, nutritional, and metabolic assessments were collected at two time points for all patients: baseline (before initiation of ONS or at the beginning of the 3-week observation period for the control group) and after 3 weeks. For patients receiving systemic chemotherapy, blood samples were collected before administration of the next scheduled chemotherapy cycle. For patients without concurrent systemic chemotherapy, samples were collected during routine outpatient assessments at the corresponding baseline and week-3 time points. Measured laboratory parameters included white blood cell count (WBC), neutrophil count (NE), platelet count (PLT), lymphocyte count (LY), C-reactive protein (CRP), hemoglobin, total cholesterol (TC), triglycerides (TG), total protein (TP), albumin (ALB), creatinine, and uric acid. Derived indices included the Prognostic Nutritional Index (PNI)19, neutrophil-to-lymphocyte ratio (NLR), platelet-to-lymphocyte ratio (PLR), and systemic immune-inflammation index (SII)20. All laboratory measurements were performed in the Department of Clinical Laboratory, Ningbo No. 2 Hospital. Complete blood count parameters were measured in EDTA-anticoagulated whole-blood samples, whereas CRP and biochemical parameters were measured in serum samples. These biomarkers were selected based on their clinical relevance and availability in routine medical records. WBC, NE, PLT, hemoglobin, and LY were used to assess hematological changes. CRP, NLR, PLR, and SII were evaluated as indicators of systemic inflammation and immune status. Body weight, BMI, TP, ALB, and PNI were assessed as nutritional indicators, whereas TC, TG, creatinine, and uric acid were included to characterize metabolic and organ function. Missing data were handled using an outcome-specific complete-case approach. Patients with missing baseline or week-3 measurements were excluded only from analyses of the corresponding outcome but were retained in analyses of other outcomes for which paired data were available. No missing values were imputed.
The formulas used to calculate these indices are presented below:


Statistical analysis
Statistical analyses were performed using STATA version 17.0. Given the exploratory retrospective study design, short-term changes in hematological parameters, particularly white blood cell (WBC), neutrophil (NE), and platelet (PLT) counts, were designated as the primary analytical focus. Anthropometric and nutritional parameters, including body weight, BMI, albumin (ALB), and the Prognostic Nutritional Index (PNI), were evaluated as secondary exploratory outcomes. No a priori sample size or statistical power calculation was performed because the study was based on retrospectively collected clinical records.
Descriptive statistics were used to summarize baseline demographic and clinical characteristics. Continuous variables were expressed as the mean ± standard deviation (SD) for normally distributed data or as the median (interquartile range [IQR]) for non-normally distributed data. Categorical variables were presented as frequencies and percentages. Baseline characteristics were compared between the two groups using independent-samples t-tests or Mann–Whitney U tests for continuous variables and chi-square or Fisher's exact tests for categorical variables, as appropriate. Within-group changes from baseline to week 3 were assessed using paired t-tests or Wilcoxon signed-rank tests.
Change scores (Δ = week 3 − baseline) were calculated for each parameter to quantify changes over the observation period. Unadjusted between-group comparisons of Δ values were performed using independent-samples t-tests or Mann–Whitney U tests, as appropriate. To partially account for baseline imbalances, adjusted between-group differences at week 3 were estimated using multivariable linear regression models. For each outcome, the week-3 value was entered as the dependent variable, with study group (ONS vs. control) as the primary independent variable. The corresponding baseline value, tumor site, and baseline weight-loss status were included as covariates. The control group served as the reference category, and robust standard errors were applied. Adjusted regression coefficients, 95% confidence intervals (CIs), and P values are reported. The de-identified individual-level dataset used for these analyses is provided in Supplementary Table 2.
Access restricted. Please log in or start a trial to view this content.
Results
Baseline characteristics
A total of 87 patients with GI cancer were included in this retrospective analysis, comprising 46 patients in the ONS group and 41 patients in the control group (Figure 1). Patients aged ≥60 years accounted for 63.22% of the overall cohort, with a slight male predominance (66.67%). As shown in Table 1, there were no significant differences in baseline age or sex distribution between the ONS and control gro...
Access restricted. Please log in or start a trial to view this content.
Discussion
Malnutrition and treatment-related hematological abnormalities frequently coexist in patients with GI cancer and may compromise treatment tolerance, highlighting the need for supportive strategies that address both nutritional and hematological vulnerability. Against this clinical background, the present retrospective cohort analysis identified two principal short-term associations. First, after adjustment for the corresponding baseline value, tumor site, and weight-loss status, receipt of omega-3 PUFA-enriched ONS was a...
Access restricted. Please log in or start a trial to view this content.
Disclosures
The authors have no conflicts of interest to declare.
Acknowledgements
The authors thank Ningbo No.2 Hospital for providing the data.
FUNDING:
This work was supported by the Natural Science Foundation of Ningbo (No. 2024J405) and the HwaMei Key Research Foundation of Ningbo No.2 Hospital (No. 2024HMZD17).
Access restricted. Please log in or start a trial to view this content.
Materials
| Name | Company | Catalog Number | Comments |
|---|---|---|---|
| Omega-3 PUFA-enriched enteral nutrition emulsion ( (TPF-T) | Fresenius Kabi SSPC, Wuxi, Jiangsu, China | H20040722 | Used as oral nutritional supplementation during the 3-week nutritional intervention. |
| Albumin assay kit | MedicalSystem Biotechnology Co., Ltd., Ningbo, Zhejiang Province, China | LT103A | Bromocresol Green method. Results are reported in g/L. |
| Automated biochemical analyzer | Hitachi High-Tech Corporation, Tokyo, Japan | 785-0044 | Used for automated sample handling before biochemical analysis. |
| Automated hematology analyzer | Mindray Bio-Medical Electronics Co., Ltd., Shenzhen, China | BC-6800Plus | Used for complete blood count measurements, including WBC, NE, LY, PLT, and hemoglobin measurements. |
| C-reactive protein assay kit | MedicalSystem Biotechnology Co., Ltd., Ningbo, Zhejiang Province, China | LM497 | Latex-enhanced immunoturbidimetric method. Results are reported in mg/L. |
| Creatinine assay kit | MedicalSystem Biotechnology Co., Ltd., Ningbo, Zhejiang Province, China | LT105TF | Sarcosine Oxidase method. Results are reported in µmol/L. |
| Diluent for hematology analysis | Mindray Bio-Medical Electronics Co., Ltd., Shenzhen, China | M-6DR | Used for sample dilution before hematology analysis and for preparing cell suspension. |
| Lysing reagent for hematology analysis | Mindray Bio-Medical Electronics Co., Ltd., Shenzhen, China | M-6LD | Used to lyse red blood cells and support leukocyte differential counting in hematology analysis. |
| Lysing reagent for hematology analysis | Mindray Bio-Medical Electronics Co., Ltd., Shenzhen, China | M-6LH | Used to lyse red blood cells and release hemoglobin for hemoglobin quantitation. |
| Stata Statistical Software | College Station, TX, USA | Release 17 | Used for statistical analysis |
| Total cholesterol assay kit | MedicalSystem Biotechnology Co., Ltd., Ningbo, Zhejiang Province, China | LT202F | CHOD-PAP method. Results are reported in mmol/L. |
| Total protein assay kit | MedicalSystem Biotechnology Co., Ltd., Ningbo, Zhejiang Province, China | LT102A | Biuret method. Results are reported in g/L. |
| Triglyceride assay kit | MedicalSystem Biotechnology Co., Ltd., Ningbo, Zhejiang Province, China | LT201F | GPO-PAP method. Results are reported in mmol/L. |
| Uric acid assay kit | MedicalSystem Biotechnology Co., Ltd., Ningbo, Zhejiang Province, China | LT107 | Uricase method. Results are reported in µmol/L. |
References
- Li M, Cao S, Xu RH. Global trends and epidemiological shifts in gastrointestinal cancers: insights from the past four decades. Cancer Commun (Lond). 2025;45(7):774-788.
- Thakir TM, Wang AR, Decker-Farrell AR, et al. Cancer therapy and cachexia. J Clin Invest. 2025;135(15).
- Muscaritoli M, Imbimbo G, Jager-Wittenaar H, et al. Disease-related malnutrition with inflammation and cachexia. Clin Nutr. 2023;42(8):1475-1479.
- Tan Y, Xue R, Pan Y, et al. Cancer cachexia: molecular basis and therapeutic advances. Signal Transduct Target Ther. 2026;11(1):16.
- Miller LJ, Douglas C, McCullough FS, et al. Impact of enteral immunonutrition on infectious complications and immune and inflammatory markers in cancer patients undergoing chemotherapy: A systematic review of randomized controlled trials. Clin Nutr. 2022;41(10):2135-2146.
- Raczynska A, Leszczynska T, Skotnicki P, Koronowicz A. The impact of immunomodulatory components used in clinical nutrition: A narrative review. Nutrients. 2025;17(5).
- Li Y, Tang H, Yang X, et al. Associations of omega-3, omega-6 polyunsaturated fatty acids intake and omega-6:omega-3 ratio with systemic immune and inflammatory biomarkers: NHANES 1999-2020. Front Nutr. 2024;11:1410154.
- Munhoz J, Newell M, Goruk S, et al. Docosahexaenoic acid (DHA) supplementation attenuates changes in the concentration, phenotype, and response of immune peripheral blood cells in breast cancer patients undergoing neoadjuvant therapy: Secondary findings from the DHA-WIN trial. Breast Cancer Res. 2025;27(1):91.
- Sherratt SCR, Mason RP, Libby P, Steg PG, Bhatt DL. Do patients benefit from omega-3 fatty acids? Cardiovasc Res. 2024;119(18):2884-2901.
- Zhang L, Lin L, Xiao B, et al. Eicosapentaenoic acid (EPA) reduced lipopolysaccharide-stimulated inflammatory response of RAW264.7 cells via the miR-125b-5p/CREB axis. Int J Biol Macromol. 2025;310(Pt 4):143511.
- Liu H, Chen J, Shao W, Yan S, Ding S. Efficacy and safety of omega-3 polyunsaturated fatty acids in adjuvant treatments for colorectal cancer: A meta-analysis of randomized controlled trials. Front Pharmacol. 2023;14:1004465.
- Matsui R, Sagawa M, Sano A, et al. Impact of perioperative immunonutrition on postoperative outcomes for patients undergoing head and neck or gastrointestinal cancer surgeries: A systematic review and meta-analysis of randomized controlled trials. Ann Surg. 2024;279(3):419-428.
- Li H, Xu Z, Chen Y, et al. The role of omega-3 polyunsaturated fatty acid supplementation in postoperative recovery of colorectal cancer: Systematic review and meta-analysis. Nutrients. 2026;18(1).
- Ye J, Hu Y, Chen X, et al. Comparative effects of different nutritional supplements on inflammation, nutritional status, and clinical outcomes in colorectal cancer patients: A systematic review and network meta-analysis. Nutrients. 2023;15(12).
- Freeman M, Ennis M, Jerzak KJ. Karnofsky performance status (KPS) ≤60 is strongly associated with shorter brain-specific progression-free survival among patients with metastatic breast cancer with brain metastases. Front Oncol. 2022;12:867462.
- Fiorindi C, Baldini G, Testa GD, et al. Patient-generated subjective global assessment (PG-SGA) better identifies malnourished patients and better correlates with functional capacity than global leadership initiative on malnutrition (GLIM) criteria. Clin Nutr ESPEN. 2023;58:525.
- Yu H, Hu ZB, Chen MM, Dai XY, Lin Y. Effects of postdischarge oral nutrition supplements on body composition, immune status, and inflammatory responses in malnourished patients with gastrointestinal cancer after surgery. Gastrointest Tumors. 2025;13(1).
- Muscaritoli M, Arends J, Bachmann P, et al. ESPEN practical guideline: Clinical nutrition in cancer. Clin Nutr. 2021;40(5):2898-2913.
- Buzby GP, Mullen JL, Matthews DC, Hobbs CL, Rosato EF. Prognostic nutritional index in gastrointestinal surgery. Am J Surg. 1980;139(1):160-167.
- Hu B, Yang XR, Xu Y, et al. Systemic immune-inflammation index predicts prognosis of patients after curative resection for hepatocellular carcinoma. Clin Cancer Res. 2014;20(23):6212-6222.
- Xu Q, Zhang Z, Tang M, et al. Endogenous production of omega-3 polyunsaturated fatty acids mitigates cisplatin-induced myelosuppression by regulating NRF2-MDM2-p53 signaling pathway. Free Radic Biol Med. 2023;201:14-25.
- Xu QH, Zhang ZM, Xing CF, et al. Protective effect of endogenous ω-3 polyunsaturated fatty acid against cisplatin-induced myelosuppression. Zhongguo Shi Yan Xue Ye Xue Za Zhi. 2024;32(5):1601-1607.
- Park WH. The crossroads of inflammation and oxidative stress: A review of the interplay between eicosanoids and reactive oxygen species. Pharmacol Res. 2026;226:108148.
- Tu M, Wang W, Zhang G, Hammock BD. Omega-3 polyunsaturated fatty acids on colonic inflammation and colon cancer: Roles of lipid-metabolizing enzymes involved. Nutrients. 2020;12(11).
- Ni J, Qi X, Jin C, et al. Efficacy prediction of systemic immune-inflammation index and prognostic nutritional index in breast cancer patients and their variations after neoadjuvant chemotherapy. Front Immunol. 2025;16:1514736.
- Wang B, Zhang J, Shi Y, Wang Y. Clinical significance of the combined systemic immune-inflammatory index and prognostic nutritional index in predicting the prognosis of patients with extensive-stage small-cell lung cancer receiving immune-combination chemotherapy. BMC Cancer. 2024;24(1):1574.
- He M, Chen ZF, Zhang L, et al. Associations of subcutaneous fat area and systemic immune-inflammation index with survival in patients with advanced gastric cancer receiving dual PD-1 and HER2 blockade. J Immunother Cancer. 2023;11(6).
- Hu W, Liang J, Luo J, et al. Elevated platelet-to-lymphocyte ratio predicts poor clinical outcomes in non-muscle invasive bladder cancer: A systematic review and meta-analysis. Front Immunol. 2025;16:1578069.
- Zhao Z, Xu H, Ma B, Dong C. Prognostic value of platelet-to-lymphocyte ratio (PLR) in breast cancer patients receiving neoadjuvant therapy: A systematic review and meta-analysis. Front Immunol. 2025;16:1658571.
- Aprile G, Basile D, Giaretta R, et al. The clinical value of nutritional care before and during active cancer treatment. Nutrients. 2021;13(4).
- Aoyama S, Motoori M, Yamasaki M, et al. The impact of weight loss during neoadjuvant chemotherapy on postoperative infectious complications and prognosis in patients with esophageal cancer: Exploratory analysis of OGSG1003. Esophagus. 2023;20(2):225-233.
- Zhang L, Ma W, Qiu Z, et al. Prognostic nutritional index as a prognostic biomarker for gastrointestinal cancer patients treated with immune checkpoint inhibitors. Front Immunol. 2023;14:1219929.
- Zeng D, Wen NY, Wang YQ, et al. Prognostic role of nutritional index in patients with resectable and advanced biliary tract cancers. World J Gastroenterol. 2025;31(6):97697.
- Zheng Y, Wang K, Ou Y, et al. Prognostic value of a baseline prognostic nutritional index for patients with prostate cancer: A systematic review and meta-analysis. Prostate Cancer Prostatic Dis. 2024;27(4):604-613.
- Huang KC, Chiang YF, Ali M, Hsia SM. Cisplatin-induced muscle wasting and atrophy: Molecular mechanisms and potential therapeutic interventions. J Cachexia Sarcopenia Muscle. 2025;16(3):e13817.
- Cuesta-Sancho S, Gomez JJL, Garcia-Luna PP, et al. Soluble oncoimmunome signatures predict muscle mass response to enriched immunonutrition in cancer patients: Subanalysis of a multicenter randomized clinical trial. Nutrients. 2025;17(15).
- Adriaenssens N, Wuyts SCM, Steurbaut S, et al. Synergy of body composition, exercise oncology, and pharmacokinetics: A narrative review of personalizing paclitaxel treatment for breast cancer. Cancers (Basel). 2025;17(8).
Access restricted. Please log in or start a trial to view this content.