This protocol describes a standardized workflow for evaluating the association between admission neutrophil count and 14-day mortality in patients with traumatic brain injury through integrated analysis of clinical characteristics, laboratory parameters, and short-term outcomes.
A subscription to JoVE is required to view this content. Sign in or start your free trial.
Research Article
Nonlinear Association Between Admission Neutrophil Count and 14-Day Mortality in Patients with Traumatic Brain Injury: A Retrospective Cohort Study
In This Article
Summary
Abstract
Traumatic brain injury (TBI) is a major cause of morbidity and mortality, and early risk assessment remains clinically important because prognostic information is often required during the emergency admission period. This study evaluated the association between admission neutrophil count and 14-day all-cause mortality in adult patients with TBI. We analyzed an institutional cohort of 1,361 adults hospitalized with TBI between 2017 and 2023. Neutrophil count was obtained from the first complete blood count performed after emergency presentation or hospital admission. Patients were categorized according to neutrophil count tertiles, and 14-day all-cause mortality was defined as the primary outcome. The association between neutrophil count and mortality was assessed using univariable and multivariable logistic regression models. Potential nonlinear relationships and threshold effects were explored using generalized additive models and two-piecewise linear regression analyses. Fourteen-day mortality increased across neutrophil count tertiles, from 0.66% in the low tertile to 1.32% in the middle tertile and 5.73% in the high tertile. In the fully adjusted model, each 1 × 10⁹/L increase in neutrophil count was associated with higher odds of 14-day mortality (odds ratio [OR] = 1.093, 95% confidence interval [CI]: 1.003–1.190, P = 0.041). Threshold analysis identified a nonlinear association with an estimated inflection point of 3.81 × 10⁹/L. Below this threshold, the association was inverse, whereas above it, the association was positive. These findings demonstrate an association between admission neutrophil count and 14-day all-cause mortality in patients with TBI and suggest that admission neutrophil count may serve as a readily available marker for early risk stratification. The threshold finding should be interpreted as exploratory.
Introduction
Traumatic brain injury (TBI) is defined as a disruption of brain function, or other evidence of brain pathology, caused by an external physical force1. It is still a significant concern in the world of public health. There are over 50 million people who suffer from TBI annually, and the situation in China is also serious. In China alone, over 120,000 acute TBI cases were recorded between 2001 and 2016, with road traffic accidents and falls being the most common causes2. Since TBI can result in premature death, prolonged disability, and significant family and social costs, simple and reliable prognostic indicators are still clinically relevant3.
Secondary injury following TBI has a close association with inflammation4. The initial mechanical insult may be followed by a sequence of biological responses such as immune activation, blood-brain barrier damage, recruitment of leukocytes, cytokines, oxidative stress, and microvascular dysfunction. These processes are also not isolated. All these could contribute to neuronal injury and affect clinical outcomes. The use of peripheral blood indicators has value in this context since they are inexpensive, quickly accessible, and regularly measured in emergency evaluations. There are reports indicating that hematological inflammatory markers, especially the neutrophil-to-lymphocyte ratio and platelet-to-lymphocyte ratio, are associated with prognosis in patients with TBI. This suggests that systemic inflammatory status may provide practical information for early risk assessment.
Neutrophils can be considered as one of the initial immune cells to be recruited post-trauma. Historically, they have been thought of primarily as short-lived pro-inflammatory cells, although this perspective should now be regarded as obsolete. Neutrophils play a role in phagocytosis, degranulation, cytokine release, endothelial interactions, and neutrophil extracellular trap formation5,6,7. Following an injury to the central nervous system, they might move towards the injured area in response to inflammatory stimuli and engage in the acute immune reaction. This early reaction may be protective. Nevertheless, in the case of excessive or prolonged activation of neutrophils, they can also cause tissue damage via proteolytic enzymes, reactive oxygen species, and inflammatory mediators8. For this reason, admission neutrophil count may reflect not only systemic inflammation, but also the intensity of acute physiological stress after TBI.
Even though inflammatory ratios and various hematological indices have been investigated in the context of TBI, the association between absolute neutrophil count and short-term mortality has not been elucidated yet. The difference is important in clinical work. Neutrophil count is a direct and easy-to-interpret parameter when compared to composite ratios, as it is measured directly during a routine complete blood count9,10. It is also very easy to obtain within a short time, especially when the clinician is in a hurry and lacks sufficient time and resources. Establishing whether such a straightforward measure correlates with early death might assist in enhancing awareness of short-term risk in patients with TBI11.
Using institutional cohort data from hospitalized patients with TBI, we evaluated the association between admission neutrophil count and 14-day mortality. We also examined whether this association persisted after adjustment for demographic, clinical, coagulation, and biochemical variables, and whether a nonlinear pattern was present. The aim was to provide clinically interpretable evidence on the value of admission neutrophil count for early outcome assessment after TBI.
Access restricted. Please log in or start a trial to view this content.
Protocol
This study used anonymized clinical records from Kunshan No.2 People’s Hospital and was approved by the hospital Ethics Committee (approval No. ksehllsp2024-005). The study followed the principles of the Declaration of Helsinki. Because patient information was anonymized before analysis, the requirement for written informed consent was waived by the ethics committee. The patient screening, grouping, and main analysis workflow are shown in Figure 1. The laboratory equipment, database systems, and statistical software used in this study are listed in the Table of Materials.
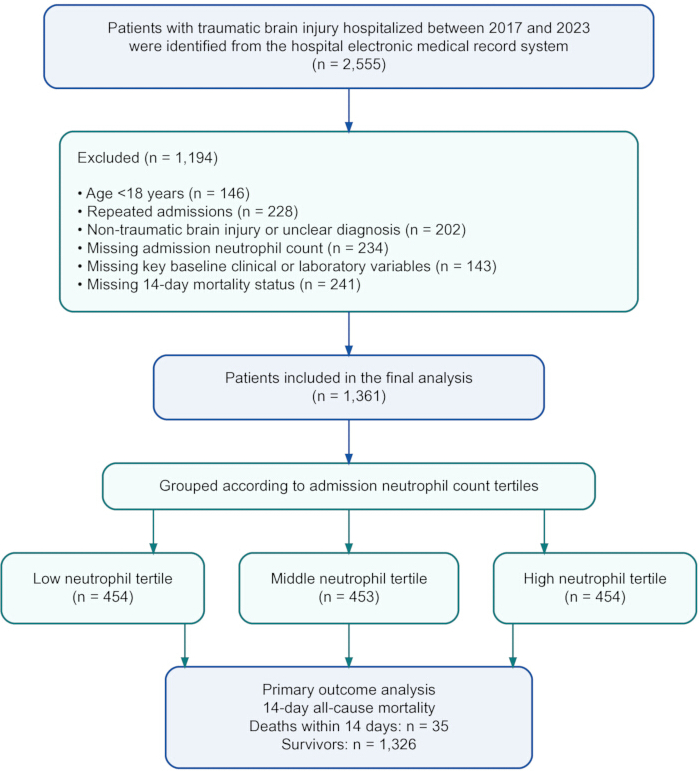
Figure 1. Flowchart of patient screening and grouping. A total of 2,555 hospitalized patients with suspected or confirmed TBI-related diagnostic records between 2017 and 2023 were initially identified from the hospital electronic medical record system. After exclusion of patients aged <18 years, repeated admissions, non-traumatic brain injury or unclear diagnosis, missing admission neutrophil count, missing key baseline clinical or laboratory variables, or missing 14-day mortality status, 1,361 patients were included in the final analysis. Patients were then grouped according to admission neutrophil count tertiles: low tertile, n = 454; middle tertile, n = 453; and high tertile, n = 454. The primary outcome was 14-day all-cause mortality, including 35 deaths and 1,326 survivors. Please click here to view a larger version of this figure.
Study design and patient cohort
We analyzed a single-center cohort of patients hospitalized with TBI between January 2017 and December 2023. Potentially eligible patients were identified from the hospital electronic medical record system. Screening was based on discharge diagnosis records containing TBI-related diagnostic terms, and the diagnosis was further verified using hospitalization records and neuroimaging findings. The TBI-related diagnostic terms were based on the International Classification of Diseases, 10th Revision (ICD-10) codes: S06.0 (concussion), S06.1 (traumatic cerebral edema), S06.3 (focal brain injury), S06.4 (epidural hemorrhage), S06.5 (traumatic subdural hemorrhage), S06.6 (traumatic subarachnoid hemorrhage), S06.8 (intracranial injury with prolonged coma), and S06.9 (intracranial injury, unspecified). A confirmed primary TBI diagnosis was defined as the presence of one or more of these ICD-10 codes as the primary discharge diagnosis, supported by compatible findings on cranial computed tomography (CT) or magnetic resonance imaging (MRI). In total, 2,555 hospitalized patients with suspected or confirmed TBI were assessed for eligibility.
For patients with more than one hospitalization during the study period, only the first eligible admission was retained as the index hospitalization. This step was used to avoid duplicate patient-level records. Patients were included if they were aged ≥18 years, had a confirmed diagnosis of primary TBI, had an available admission neutrophil count, had the baseline clinical and laboratory variables required for analysis, and had a confirmed 14-day survival status after admission. The baseline variables required for inclusion were age, sex, diagnostic category, operation status (craniotomy or decompressive craniectomy), prothrombin time (PT), activated partial thromboplastin time (APTT), fibrinogen (FIB), platelet count (PLT), albumin (ALB), total cholesterol (TC), high-density lipoprotein cholesterol (HDL), low-density lipoprotein cholesterol (LDL), and fasting blood glucose (FBG).
Patients were excluded if they were younger than 18 years, had repeated admissions, had non-traumatic brain injury or an unclear diagnosis, lacked admission neutrophil count, had missing key baseline clinical or laboratory variables, or had missing 14-day mortality status. Extreme neutrophil count values were identified through range checks and then verified against the original laboratory records. The range-check criteria for extreme neutrophil counts were defined as values below 0.5 × 10⁹/L or above 40.0 × 10⁹/L. Values were excluded only when they were confirmed to be caused by data entry errors, laboratory reporting errors, or clinically implausible measurement errors. Clinically implausible measurement errors were defined as neutrophil counts that were either (1) incompatible with the patient's simultaneous white blood cell count and differential count (e.g., a neutrophil count exceeding the total white blood cell count) or (2) recorded as nonnumeric values or placeholder characters in the raw electronic medical record export. Ultimately, 1,361 patients were included in the final analytic cohort.
Patients were classified according to the primary TBI diagnostic category recorded during the index hospitalization. The diagnostic categories were traumatic intracranial hemorrhage, traumatic brainstem injury, and simple skull fracture. When more than one TBI-related diagnosis was recorded, the diagnostic category was assigned according to the primary discharge diagnosis. The primary discharge diagnosis was defined as the first-listed diagnosis on the discharge summary and was assigned by the attending neurosurgeon based on the most clinically significant condition requiring the longest duration of hospitalization or the greatest use of healthcare resources during the admission.
The included patients were then grouped according to admission neutrophil count tertiles. The low tertile was 1.650–7.057 × 10⁹/L, the middle tertile was 7.057–10.947 × 10⁹/L, and the high tertile was 10.947–32.440 × 10⁹/L. The tertile cutoffs were determined by sorting admission neutrophil counts in ascending order and dividing the cohort into three groups of approximately equal size (n = 454, 453, and 454, respectively). The term “tertiles” was used throughout the manuscript because the cohort was divided into three groups.
Exposure, outcome, and clinical data collection
The main exposure was the absolute neutrophil count measured at admission. Admission laboratory values were defined as the first available laboratory results obtained during the initial emergency department evaluation or admission assessment. Blood samples were usually collected immediately after admission, and test results were generally reported within 2 h. The allowable time window for defining admission laboratory values was within 6 h of arrival at the emergency department or hospital admission. If more than one result was available during this initial assessment period, the earliest result was used for analysis. Neutrophil count was recorded in units of ×109/L and was analyzed both as a continuous variable and according to tertile groups.
The primary outcome was 14-day all-cause mortality after the index admission. Death within 14 days was coded as 1, and survival beyond 14 days was coded as 0. Fourteen-day mortality was determined from inpatient death records, discharge records, and the hospital follow-up record system. If discrepancies between mortality data sources occurred (e.g., a patient recorded as alive at discharge but recorded as deceased in the follow-up system within 14 days), the follow-up system record was considered the reference standard because it captured post-discharge mortality. Patients whose 14-day survival status could not be confirmed were not included in the final analysis.
Demographic and clinical variables were extracted from the electronic medical record system. These variables included age, sex, diagnostic category, operation status, and tracheostomy status. Glasgow Coma Scale (GCS) score, pupillary response, Marshall CT classification, and extracranial injury burden were not included in the analysis because these variables were not consistently recorded in the electronic medical record system during the study period (2017–2023), particularly among patients with mild TBI or those not admitted to the intensive care unit. Therefore, these variables could not be reliably extracted for the majority of the cohort. Operation was defined as craniotomy hematoma removal or decompressive craniectomy performed during the index hospitalization. Tracheostomy was coded as yes or no according to whether the procedure was performed during the same hospitalization.
Admission laboratory variables were taken from the first available laboratory assessment during the initial emergency or admission evaluation. Coagulation and hematological variables included PT, APTT, international normalized ratio (INR), FIB, D-dimer, PLT, hemoglobin (Hb), and neutrophil count. Biochemical variables included ALB, TC, triglycerides (TGs), HDL, LDL, apolipoprotein A-I (Apo A-I), apolipoprotein B (Apo B), cystatin C (CYS), alanine aminotransferase (ALT), aspartate aminotransferase (AST), creatinine (Cr), blood urea nitrogen (BUN), uric acid (UA), and FBG.
All blood samples were tested in the hospital clinical laboratory according to standard operating procedures. Complete blood count testing was performed using an automated hematology analyzer, coagulation testing using an automated coagulation analyzer, and biochemical testing using an automated biochemical analyzer. All tests were performed by trained laboratory technicians, with routine internal quality control conducted under the clinical laboratory quality-control program.
Data preprocessing and baseline comparison
Before statistical analysis, the extracted dataset was checked for repeated admissions, missing values, duplicate records, inconsistent units, and clinically implausible values. Repeated admissions were removed, and only the first eligible hospitalization was retained. Laboratory units were harmonized across the study period. Specifically, neutrophil count and platelet count were standardized to ×109/L, hemoglobin to g/L, PT and APTT to seconds, INR was retained as a unitless measure, FIB to g/L, D-dimer to mg/L, ALB, Apo A-I, and Apo B to g/L, TC, TGs, HDL, LDL, and fasting blood glucose (FBG) to mmol/L, CYS to mg/L, ALT and AST to U/L, creatinine (Cr) and uric acid (UA) to µmol/L, and BUN to mmol/L. Implausible values were reviewed against the original medical records or laboratory reports and confirmed using the source records. Clinically implausible values were defined as values outside biologically plausible ranges for the corresponding laboratory parameter (e.g., PT of <5 s or >120 s, FIB of <0.1 g/L or >20 g/L, FBG of <1.0 mmol/L or >50 mmol/L, or ALT/AST of >10,000 U/L). Additional implausible values included logical inconsistencies, such as a neutrophil count exceeding the total white blood cell count.
The main analysis used complete cases. Patients were excluded from the final analytic cohort if they had missing admission neutrophil count, missing 14-day mortality status, or missing covariates required for the main adjusted analysis. The covariates required for the fully adjusted model (Model 4) were age, diagnostic category, surgery status, APTT, FIB, PLT, LDL, HDL, and INR. After cohort selection, all variables included in the sequential regression models were available for the 1,361 patients included in the final analysis.
Categorical variables were coded as follows: sex as male or female, operation and tracheostomy as yes or no, diagnostic category as traumatic intracranial hemorrhage, traumatic brainstem injury, or simple skull fracture, and 14-day mortality as death or survival.
Continuous variables were summarized as mean ± standard deviation in the main descriptive tables. Categorical variables were summarized as frequencies and percentages. Between-group comparisons were performed using analysis of variance or nonparametric rank-based tests, as appropriate. One-way analysis of variance (ANOVA) was used for continuous variables that met assumptions of normality and homogeneity of variance, as assessed using the Shapiro–Wilk test (P > 0.05) and Levene’s test (P > 0.05), respectively. The Kruskal–Wallis test was used for continuous variables that did not meet these assumptions. For categorical variables, Pearson’s chi-square test or Fisher’s exact test was used according to expected cell counts. Fisher’s exact test was applied when any expected cell count in the contingency table was less than 5. In the baseline table, P-value was used as the primary basis for between-group comparisons. P-value* was retained only as a supplementary reference for the corresponding nonparametric or small-cell alternative test where applicable; statistical significance in the Results section was judged according to P-value, and these P values were not adjusted for multiple comparisons.
To make the baseline differences easier to interpret, descriptive multipanel plots were generated for selected clinical and laboratory variables, including age, D-dimer, fasting blood glucose, fibrinogen, prothrombin time, diagnostic composition, surgery, tracheostomy, and 14-day mortality. These variables were selected for visualization because they represented clinically relevant characteristics and demonstrated notable differences across neutrophil tertiles in the baseline analyses. These plots were used to illustrate the clinical and laboratory profiles of patients in the low, middle, and high neutrophil tertile groups.
Statistical analysis and visualization
Univariable logistic regression was first used to evaluate associations between candidate variables and 14-day mortality. Odds ratios (ORs), 95% confidence intervals (CIs), and P values were reported. Variables were considered for multivariable adjustment if they were clinically relevant, showed an association with 14-day mortality in univariable analysis, or changed the OR for neutrophil count by ≥10% when added to or removed from the model. Clinical relevance was determined a priori based on established prognostic factors for traumatic brain injury and known pathophysiological mechanisms reported in the literature, including age, coagulation parameters, glucose, and lipid-related variables. The threshold for identifying variables associated with 14-day mortality in univariable analysis was set at P < 0.10 to avoid excluding potentially important confounders from the multivariable models.
The association between admission neutrophil count and 14-day mortality was then examined using multivariable logistic regression. Neutrophil count was analyzed as a continuous variable per 1 ×10⁹/L increase. Four sequential models were built. Model 1 was unadjusted. Model 2 was adjusted for age, diagnosis, and surgery. Model 3 was adjusted for age, diagnosis, surgery, APTT, FIB, PLT, and LDL. Model 4 was adjusted for age, diagnosis, surgery, APTT, FIB, PLT, LDL, HDL, and INR. Variance inflation factors (VIFs) were used to assess potential multicollinearity among covariates before fitting the multivariable models. A VIF threshold of 5 was used to identify potentially problematic multicollinearity.
To examine whether the association was nonlinear, generalized additive models were used to evaluate the exposure-response relationship between neutrophil count and 14-day mortality. A cubic regression spline was used as the smoothing function with a basis dimension (k) of 4. The smoothing parameter was estimated using restricted maximum likelihood (REML). An adjusted smoothing curve was generated to visualize the association between admission neutrophil count and the predicted probability of 14-day mortality, with adjustment for covariates included in the fully adjusted model. When the curve suggested a nonlinear pattern, two-piecewise linear regression was used to estimate the inflection point. The inflection point (K) was identified using a recursive algorithm that evaluated candidate breakpoints across the 5th–95th percentile range of neutrophil counts. The breakpoint associated with the best model fit, as determined by the Akaike Information Criterion, was selected as the final inflection point. The one-line linear model and the two-piecewise model were compared using the likelihood ratio test. Threshold effects were reported below and above the estimated inflection point.
Threshold effects were visualized using a forest plot showing the estimated ORs below and above the model-specific inflection point K. The K values were 18.54, 3.82, 3.86, and 3.81 ×10⁹/L in Models 1–4, respectively. For categorical variables with very few or no outcome events in a subgroup, the corresponding ORs were considered potentially unstable and were interpreted cautiously. OR estimates were classified as unstable if the subgroup contained fewer than five outcome events or if the width of the 95% confidence interval exceeded 10.0.
Figures were generated to present the patient screening process, baseline clinical and laboratory profiles across neutrophil tertiles, 14-day mortality rates across tertiles, regression estimates from the sequential models, threshold effects, and adjusted smoothing curves. Statistical analyses were performed using R version 4.5.2 and the EmpowerStats online platform. Figures were generated using the R packages ggplot2, patchwork, pdftools, png, and scales. A two-sided P value of <0.05 was considered statistically significant.
Access restricted. Please log in or start a trial to view this content.
Results
Patient screening and baseline characteristics
A total of 2,555 hospitalized patients with suspected or confirmed TBI-related diagnostic records between 2017 and 2023 were initially screened from the hospital electronic medical record system. After excluding patients aged <18 years, repeated admissions, non-traumatic brain injury or unclear diagnosis, missing admission neutrophil count, missing key baseline clinical or laboratory variables, or missing 14-day mortality statu...
Access restricted. Please log in or start a trial to view this content.
Discussion
Using clinical data from 1,361 hospitalized patients with TBI, we found that admission neutrophil count was associated with 14-day mortality. The mortality rate increased across neutrophil tertiles, and this pattern remained evident after adjustment for demographic, clinical, coagulation, and biochemical variables. In the fully adjusted model, each 1 ×10⁹/L increase in neutrophil count was associated with higher odds of 14-day mortality. The smoothing curve and threshold analysis further suggested that th...
Access restricted. Please log in or start a trial to view this content.
Disclosures
Conflict of Interest:
The authors declare no competing interests.
Acknowledgements
Not applicable.
Access restricted. Please log in or start a trial to view this content.
Materials
| Name | Company | Catalog Number | Comments |
|---|---|---|---|
| Automated biochemical analyzer | Beckman Coulter, Inc. | AU5800 clinical chemistry analyzer | Used for biochemical testing, including ALB, TC, TGs, HDL, LDL, Apo A-I, Apo B, CYS, ALT, AST, Cr, BUN, UA, and FBG. |
| Automated coagulation analyzer | Sysmex Corporation | CS-5100 coagulation analyzer | Used for coagulation testing, including PT, APTT, INR, FIB, and D-dimer. |
| Automated hematology analyzer | Sysmex Corporation | XN-1000 hematology analyzer | Used for complete blood count testing, including neutrophil count, platelet count, and hemoglobin. |
| Electronic medical record system | Kunshan No. 2 People’s Hospital | Institutional electronic medical record platform; not commercially cataloged | Used to identify hospitalized patients with suspected or confirmed traumatic brain injury and to extract demographic and clinical variables. |
| EmpowerStats | X&Y Solutions, Inc. | Online statistical platform (accessed on April 25, 2026) | Used for multivariable logistic regression, generalized additive modeling, smoothing curve generation, and threshold analysis. |
| Follow-up record system | Kunshan No. 2 People’s Hospital | Institutional follow-up record platform; not commercially cataloged | Used to determine and verify 14-day survival status after index admission. |
| ggplot2 R package | R package | Version used in analysis | Used for statistical plotting and figure generation. |
| Laboratory information system | Kunshan No. 2 People’s Hospital | Institutional laboratory information platform; not commercially cataloged | Used to retrieve admission laboratory test results. |
| patchwork R package | R package | Version used in analysis | Used to assemble multi-panel figures. |
| pdftools R package | R package | Version used in analysis | Used for PDF processing during figure preparation. |
| png R package | R package | Version used in analysis | Used for image processing during figure preparation. |
| R statistical software | R Foundation for Statistical Computing | Version 4.5.2 | Used for data preprocessing, statistical analysis, and figure generation. |
| scales R package | R package | Version used in analysis | Used for axis formatting and percentage scaling in figures. |
References
- Menon DK, Schwab K, Wright DW, Maas AI. Position Statement: Definition of Traumatic Brain Injury. Archives of Physical Medicine and Rehabilitation. 2010;91(11):1637-1640.
- Dams-O’Connor K, et al. Traumatic brain injury as a chronic disease: insights from the United States Traumatic Brain Injury Model Systems Research Program. The Lancet Neurology. 2023;22(6):517-528.
- Feng JF, et al. Traumatic brain injury in China: an update on epidemiology, care pathways, and clinical research. The Lancet Neurology. 2026;25(4):396-405.
- Theus MH. Neuroinflammation and acquired traumatic CNS injury: a mini review. Frontiers in Neurology. 2024;15:1334847.
- He W, et al. Neutrophil heterogeneity and plasticity: unveiling the multifaceted roles in health and disease. MedComm. 2025;6(2):e70063.
- Dejas L, Santoni K, Meunier E, Lamkanfi M. Regulated cell death in neutrophils: From apoptosis to NETosis and pyroptosis. Seminars in Immunology. 2023;70:101849.
- Shafqat A, et al. Neutrophil extracellular traps in central nervous system pathologies: A mini review. Frontiers in Medicine. 2023;10:1083242.
- Shi G, et al. Inhibition of neutrophil extracellular trap formation ameliorates neuroinflammation and neuronal apoptosis via STING-dependent IRE1α/ASK1/JNK signaling pathway in mice with traumatic brain injury. Journal of Neuroinflammation. 2023;20(1):222.
- Nguyen A, et al. Neutrophil to Lymphocyte Ratio as a Predictor of Postoperative Outcomes in Traumatic Brain Injury: A Systematic Review and Meta-Analysis. Diseases. 2023;11(1):51.
- Arslan K, Sahin AS. Prognostic value of systemic immune-inflammation index, neutrophil-lymphocyte ratio, and thrombocyte-lymphocyte ratio in critically ill patients with moderate to severe traumatic brain injury. Medicine. 2024;103(29):e39007.
- Li Y, et al. Neutrophil-albumin ratio serves as a superior prognostic biomarker for traumatic brain injury. Scientific Reports. 2024;14(1):27563.
- Bouras M, Asehnoune K, Roquilly A. Immune modulation after traumatic brain injury. Frontiers in Medicine. 2022;9:995044.
- Wofford KL, et al. Peripheral immune cell dysregulation following diffuse traumatic brain injury in pigs. Journal of Neuroinflammation. 2024;21(1):324.
- Zhang F, et al. Neutrophil diversity and function in health and disease. Signal Transduction and Targeted Therapy. 2024;9(1):343.
- Wang H, et al. Neutrophil extracellular traps in homeostasis and disease. Signal Transduction and Targeted Therapy. 2024;9(1):235.
- Malik S, et al. Inflammatory cytokines associated with mild traumatic brain injury and clinical outcomes: a systematic review and meta-analysis. Frontiers in Neurology. 2023;14:1123407.
- Huang H, et al. Plasma profiles of inflammatory cytokines in children with moderate to severe traumatic brain injury: a prospective cohort study. European Journal of Pediatrics. 2024;183(8):3359-3368.
- Xu H, et al. Systemic Immune-Inflammation Index Predicts the Prognosis of Traumatic Brain Injury. World Neurosurgery. 2024;183:e22-e27.
- Ma P, et al. Utility of systemic immune-inflammation index, neutrophil-to-lymphocyte ratio, and platelet-to-lymphocyte ratio as a predictive biomarker in pediatric traumatic brain injury. Surgical Neurology International. 2024;15.
- Chen L, et al. Systemic immune inflammation index and peripheral blood carbon dioxide concentration at admission predict poor prognosis in patients with severe traumatic brain injury. Frontiers in Immunology. 2022;13:1034916.
- Menon DK, et al. Clinical Assessment on Days 1-14 for the Characterization of Traumatic Brain Injury: Recommendations from the 2024 NINDS Traumatic Brain Injury Classification and Nomenclature Initiative Clinical/Symptoms Working Group. Journal of Neurotrauma. 2025;42(13-14):1038-1055.
Access restricted. Please log in or start a trial to view this content.