This study examines whether sentiment polarity and subjectivity associate with prognosis in cholecystectomy patients with intensive care unit stays ≥ 24 h. The main analyses assess their discriminative ability for 3-, 7-, and 10-day intensive care unit length of stay, in-hospital mortality, and 28-day hospital stay.
Research Article
Sentiment Scores in Nursing Notes Associated with the Prognosis of Patients Undergoing Cholecystectomy
In This Article
Summary
Abstract
This study examined the relationship between sentiment scores and the prognosis of cholecystectomy patients with an intensive care unit (ICU) length of stay (LOS) ≥ 24 h. A total of 267 patients from the Medical Information Mart for Intensive Care IV (MIMIC-IV) database were included. Sentiment scores derived from nursing notes in the MIMIC-IV note module using TextBlob. The analyzed text was generated at hospital discharge. Accordingly, all findings are interpreted as descriptive associations. Receiver operating characteristic (ROC) curves, the DeLong test, and decision curve analysis (DCA) were used to descriptively characterize the discrimination of sentiment polarity and sentiment subjectivity for 3-, 7-, and 10-day ICU LOS, and to compare sentiment polarity with clinical indicators for 7-day ICU LOS. Restricted cubic spline (RCS) and generalized linear regression evaluated their associations with ICU LOS. Sentiment polarity achieved a higher area under the curve (AUC) than sentiment subjectivity; the DeLong test showed a significant difference for 3-day ICU LOS (p = 0.015), borderline for 7-day (p = 0.057), and non-significant for 10-day (p = 0.587). For 7-day ICU LOS, sentiment polarity showed a higher AUC with exploratory net benefit on DCA within specific threshold ranges. Sentiment polarity had a nonlinear correlation with 7-day ICU LOS (p overall = 0.002, p nonlinear = 0.027), whereas sentiment subjectivity did not. Generalized linear regression showed an association between sentiment polarity and ICU LOS that was independent of measured covariates (all p < 0.05 in crude and adjusted models). For secondary outcomes, sentiment polarity was associated with in-hospital mortality and 28-day hospital LOS in RCS analysis (all p < 0.05), with exploratory discriminative ability requiring further validation. In conclusion, among these patients, sentiment polarity was descriptively associated with ICU LOS, in-hospital mortality, and 28-day hospital LOS; these findings should not be generalized to all cholecystectomy patients.
Introduction
Cholecystectomy is one of the most common procedures in biliary surgery1. Cholecystectomy can be applied to a variety of gallbladder diseases, such as gallstones, cholecystitis, gallbladder polyps, and so on2,3,4. There are two main types of cholecystectomy: open cholecystectomy and laparoscopic cholecystectomy5. Among them, open cholecystectomy is indicated for complicated cases: for patients with complicated conditions (e.g., large gallbladder stones, spreading inflammation, etc.), laparoscopic cholecystectomy is indicated for all gallbladder disorders for which there is no contraindication to surgery6. Although cholecystectomy is a relatively safe surgical procedure, a number of complications remain, such as biliary tract injuries, intestinal injuries, abdominal bleeding, bile leakage, secondary choledocholithiasis, cardiovascular accidents, respiratory diseases, etc.7.
Sentiment analysis is a common application of natural language processing methods, which is a method of analyzing, processing, summarizing, and reasoning about subjective texts with emotional overtones, and quantifying qualitative data using some sentiment score metrics8. Sentiment analysis is used in several fields such as finance, journalism, medicine, etc9,10,11. It should be noted that sentiment scores calculated by tools such as TextBlob are based on the polarity and subjectivity of words at the lexical level using predefined sentiment lexicons (e.g., AFINN), rather than reflecting the subjective mood or attitude of the nurse writing the note12. Specifically, polarity scores range from - 1 to 1, and subjectivity scores range from 0 to 1, representing the semantic orientation of the words used in the clinical text. The application of sentiment analysis in the medical field can not only understand emotional attitudes about an event13, but can also assist in medical image categorization14, and is also related to a patient's prognosis, etc.15. Previous studies have demonstrated that sentiment scores extracted from nursing notes are associated with patient prognosis in critically ill populations. For example, in patients with acute kidney injury receiving continuous renal replacement therapy, it is found that the machine learning model containing sentiment score (which was extracted from the nursing notes) can quickly identify patients' high-risk deaths16. Another study found that the sentiment polarity of nursing notes was an important factor in the 30-day mortality of intensive care unit (ICU) patients, and was related to both 30-day mortality and survival17. Similarly, sentiment analysis has been applied to sepsis patients to discriminate mortality risk18.
However, the populations in these previous studies differ substantially from post-cholecystectomy ICU patients. Patients with acute kidney injury, sepsis, or acute pancreatitis typically present with severe systemic inflammatory responses and multiple organ dysfunction, requiring intensive organ support such as mechanical ventilation or vasopressors19. For instance, severe acute pancreatitis is defined by persistent organ failure lasting more than 48 hours according to the revised Atlanta classification20. In contrast, cholecystectomy is generally considered a relatively safe procedure with low mortality, and most patients do not require postoperative ICU admission unless they develop severe complications such as bile duct injury or uncontrolled bleeding21,22. Therefore, the clinical trajectory, severity of illness, and risk factors for mortality in post-cholecystectomy ICU patients are distinct from those in general ICU populations with primary diagnoses of AKI or sepsis. Furthermore, the nursing documentation patterns and semantic content of clinical notes may differ between these populations due to variations in disease severity and treatment intensity.
At present, research on sentiment analysis based on nursing notes and prognosis has primarily focused on ICU patients with conditions such as sepsis, acute kidney injury, and acute pancreatitis. Few studies have examined the relationship between nursing note sentiment and the prognosis of post-cholecystectomy patients. Therefore, based on the Medical Information Mart for Intensive Care (MIMIC)-IV database23, this study extracted the sentiment of nursing notes of patients undergoing cholecystectomy and explored the relationship between the sentiment score of nursing notes and the prognosis of cholecystectomy patients in order to provide better references for clinical care. To the best of current knowledge, this is the first study to investigate the association between nursing note sentiment scores and prognosis, specifically in post-cholecystectomy ICU patients.
Protocol
This study was conducted using the MIMIC-IV database. The establishment of the MIMIC-IV database was approved by the Institutional Review Boards of the Massachusetts Institute of Technology and Beth Israel Deaconess Medical Center (BIDMC), and consent was obtained for the original data collection. All patient health information in the database was de-identified in accordance with the Health Insurance Portability and Accountability Act Safe Harbor provisions, with the 18 HIPAA-defined identifiers removed and dates shifted to protect patient privacy; therefore, the requirement for individual informed consent was waived. Access to the database was granted after one author completed the required training course "Data or Specimens Only Research" of the Collaborative Institutional Training Initiative, became a credentialed user on the PhysioNet platform, and signed the PhysioNet Credentialed Health Data Use Agreement. Throughout the study, the restricted MIMIC-IV data were handled in accordance with the PhysioNet Credentialed Health Data Use Agreement and institutional data-governance procedures: the de-identified data were stored only on password-protected, institutionally managed devices with access restricted to the credentialed authors, were not shared with any non-credentialed third party or uploaded to public services, and no attempt was made to re-identify individuals or to link the records to external data sources. As this study was based on a publicly available, de-identified database, additional ethical approval from the Ethics Committee of the Second Affiliated Hospital of Zhejiang University School of Medicine was waived. The software and tools used in this study are listed in the Table of Materials.
Data source
Patient data was obtained from the Medical Information Mart for Intensive Care IV (MIMIC-IV, 3.0 Version, released in 2024) database, founded in 2003 by the Computational Physiology Laboratory of Massachusetts Institute of Technology, Beth Israel Deaconess Medical Center of Harvard Medical School, and Philips Medical Company, with the support of the National Institutes of Health. The authors became credentialed PhysioNet users, completed the CITI “Data or Specimens Only Research” training course, and signed the PhysioNet Credentialed Health Data Use Agreement (Record ID: 55710882) before access was granted. The data were extracted in November 2025.
The database is organized into two modules: hosp (sourced from the hospital-wide electronic health record) and icu (sourced from the in-ICU clinical information system, MetaVision). The study cohort was assembled by querying the following tables and linking records by subject_id, hadm_id and stay_id: patients, admissions and transfers (demographics and hospitalization data); diagnoses_icd with d_icd_diagnoses, and procedures_icd with d_icd_procedures (diagnosis and procedure codes); labevents with d_labitems (laboratory measurements); prescriptions (medications); microbiologyevents (postoperative infection); icustays (ICU admission and length of stay(LOS)); chartevents with d_items (ICU vital signs); and the MIMIC-IV free-text nursing notes, from which the sentiment polarity and sentiment subjectivity scores were derived. Data were extracted using structured SQL queries run against a local PostgreSQL (version 18.4) build of MIMIC-IV v3.0 (and cross-checked on Google BigQuery), created with the official build scripts of the MIMIC-Code repository (https://github.com/MIT-LCP/mimic-code).
Inclusion and exclusion criteria
Inclusion criteria: the patient was greater than or equal to 18 years old, the patient undergoes cholecystectomy (identified from the procedures_icd table by cholecystectomy entry), the patient has a documented ICU admission (defined by the presence of at least one record in the icustays table, the first ICU stay being used when multiple stays existed; ICU admission is an administrative event in MIMIC-IV and is therefore not represented by an ICD code) (N = 325).
Exclusion criteria: the patient developed postoperative syndrome (including postcholecystectomy syndrome and retained cholelithiasis following cholecystectomy) (excluding 3, remaining 322), the patient's ICU LOS was less than 24 h (excluding 54, remaining 268), lack of nursing notes in patient data (lack of sentiment score) [excluding 1, remaining 267]. To check whether the sample size meets the data analysis requirements, the minimum sample size was calculated using G*Power software (version 3.1.9.7) with an effect size d = 0.5, α error probability = 0.05, power (1-β error probability) = 0.95, and allocation ratio N2/N1 = 1, which resulted in a minimum required sample size of 220. The 267 participants included met the analysis requirements.
Grouping and variables
In this study, according to whether ICU LOS was more than 7 days, the subjects were divided into two groups: one group was the ICU LOS < 7 days group, and the other group was the ICU LOS ≥ 7 days group. The primary outcome indicator in this study was ICU LOS, and the primary outcome was ICU LOS, defined as a continuous variable (in days) taken from the LOS field of the icustays table (ICU module), which equals the interval between out time and in time of the patient's first ICU stay during the index hospital admission. ICU LOS was additionally dichotomized at clinically relevant thresholds: 3-day, 7-day, and 10-day ICU LOS were defined as ICU LOS ≥ 3, ≥ 7, and ≥ 10 days, respectively, each defined as a binary variable derived from the same LOS field of the icustays table.
Secondary outcome indicators were postoperative infection, in-hospital death, and LOS ≥ 28. (1) 28-day LOS, defined as a total hospital length of stay ≥ 28 days, calculated as dischtime − admittime from the admissions table (hosp module); (2) in-hospital death, defined as hospital_expire_flag = 1 in the admissions table (equivalently, a non-null death time occurring between admittime and discharge time); (3) postoperative infection, a patient was classified as having a postoperative infection when seq_num_infection was non-null. The main indicators included in this study were sentiment polarity, sentiment subjectivity, age, body mass index (BMI), glucose, albumin, alanine transaminase (ALT), anion gap, aspartate aminotransferase (AST), bicarbonate, blood urea nitrogen, chloride, creatinine, hematocrit, platelets, potassium, red blood cell (RBC), red cell distribution width (RDW), sodium, lactate, lymphocyte, white blood cell (WBC), Charlson comorbidity index (CCI), sequential organ failure assessment (SOFA), simplified acute physiology score III (APSIII), ICU mean heart rate, ICU mean systolic blood pressure, gender (male, female), race (white, others), marital status (married, others), smoking (no, yes), drinking alcohol (no, yes), propofol (no, yes), fentanyl (no, yes), ciprofloxacin (no, yes), levofloxacin (no, yes), hypertension (no, yes),hyperlipidemia (no, yes),myocardial infarction (no, yes), congestive heart failure (no, yes), cerebrovascular disease (no, yes), dementia (no, yes), chronic pulmonary disease (no, yes). Sentiment scores can be categorized into sentiment polarity and sentiment subjectivity. It is worth noting that all laboratory measurements are mean values. Propofol, fentanyl, and ciprofloxacin were recorded as binary indicators of administration within the first 24 h of ICU admission and were therefore measured prior to the outcomes of interest. They were included as baseline adjustment covariates rather than as exposures of interest, reflecting early ICU sedation, analgesia, and antimicrobial management at the time of admission.
Sentiment analysis
The Python (version 3.6.4) programming language and the TextBlob (version 0.15.1) natural language processing tool (hereafter, the sentiment-analysis library) were employed to extract sentiment polarity and sentiment subjectivity from hospital discharge document24. Before analysis, nursing records were preprocessed by removing protected identifiers, converting text to lowercase, expanding common clinical abbreviations, stripping extraneous whitespace and non-alphanumeric symbols, and segmenting text into sentences. For each record, this library returned a sentiment polarity (range -1 to 1; higher values indicate more positive sentiment) and a sentiment subjectivity (range 0 to 1; higher values indicate greater subjectivity), using the default analyzer parameters. For each patient, the hospital discharge document was scored once, yielding one sentiment polarity and one sentiment subjectivity value per patient. The analysis code is available at the Uniform Resource Locator. This library was selected because it provides a transparent, lexicon-based, and fully reproducible measure of polarity and subjectivity that has been applied in prior health-related text-mining studies17.
Statistical analysis
All statistical analyses were performed using R (version 4.3.0). The normality of continuous variables was assessed using the Shapiro-Wilk test together with visual inspection of Q-Q plots, and the homogeneity of variance was assessed using Levene's test. Continuous variables that were normally distributed were expressed as mean ± standard deviation and compared between the two groups (ICU LOS < 7 days vs. ≥ 7 days) using the independent-samples Student's t-test, with Welch's correction applied when variances were unequal; continuous variables that were not normally distributed were expressed as median (interquartile range) and compared using the Mann-Whitney U test. Categorical variables were expressed as frequencies and percentages (n, %) and compared between the two groups using the Pearson chi-square test, with Fisher's exact test used when any expected cell count was < 5.
The receiver operating characteristic (ROC) curve was used to evaluate the discriminative ability of sentiment polarity and sentiment subjectivity for 3-day, 7-day, and 10-day ICU LOS, each defined as a binary outcome (ICU LOS ≥ k days vs. < k days). The areas under the curve (AUC) were reported with 95% CIs obtained by the DeLong method; the optimal cut-off was the value that maximized the Youden index, and sensitivity, specificity, and accuracy were calculated, with their 95% CIs obtained by bootstrap resampling (1000 replicates). The DeLong test for two correlated ROC curves was used to compare AUCs (sentiment polarity vs. sentiment subjectivity; each baseline-different variable vs. sentiment polarity). Internal validation by 1000 bootstrap resamples was performed for the primary 7-day ICU LOS sentiment-polarity ROC models. For the single-index model, the optimism-corrected AUC, calibration slope, and Brier score were additionally reported. For both the single-index model and the model further adjusted for SOFA and APSIII, bias-corrected calibration curves were generated, and the mean absolute calibration error was reported. The 3-day and 10-day ICU LOS analyses and the secondary-outcome ROC analyses (in-hospital death and 28-day LOS) were not internally validated, and their performance is reported as apparent (unadjusted) and is therefore exploratory.
Restricted cubic splines (RCS) characterized the dose-response association of sentiment polarity and sentiment subjectivity with 7-day ICU LOS, and of sentiment polarity with the secondary outcomes (postoperative infection, in-hospital death, 28-day LOS). Splines were fitted with 4 knots placed at the 5th, 35th, 65th, and 95th percentiles of the exposure, with the reference value set at the median. Each outcome was modeled as a binary event on the logit scale. The p value for the overall association and the p value for nonlinearity (a test of the nonlinear spline terms) were reported.
The association between sentiment polarity and ICU LOS was estimated with generalized linear models. For the binary outcome (7-day ICU LOS), logistic regression (binomial family, logit link) was used, and effects were reported as odds ratios (OR) per 1-standard-deviation (1-SD) increase in sentiment polarity; for the continuous outcome (ICU LOS in days), linear regression was used, and effects were reported as regression coefficients (β). Four models were specified a priori: a crude (unadjusted) model; Model 1 adjusted for illness-severity scores (SOFA, APSIII); Model 2 adjusted for baseline-different laboratory/vital-sign and demographic covariates (glucose, albumin, bicarbonate, ICU mean heart rate, ICU mean systolic blood pressure, gender, and mild liver disease); and Model 3 adjusted for medications (propofol, fentanyl, ciprofloxacin). Because medications may lie on the causal pathway between illness severity and ICU LOS, Model 3 carries a risk of overadjustment and is presented as a sensitivity analysis, with Models 1–2 considered primary. 95% CIs were reported for all estimates. A two-sided p < 0.05 was considered statistically significant.
Results
Patient information
A total of 267 patients who underwent cholecystectomy were included in this study, of which 45 patients had an ICU LOS of ≥ 7 days and 222 patients had an ICU LOS of < 7 days. On baseline quantitative data, there were differences between the two groups in sentiment polarity, sentiment subjectivity, glucose, albumin, bicarbonate, SOFA, APSIII, ICU mean heart rate, and ICU mean systolic blood pressure (Table 1). The ICU LOS ≥ 7 days group had higher sentiment polarity, greater sentiment subjectivity, lower albumin levels, lower bicarbonate levels, higher SOFA, higher APSIII, faster ICU mean heart rate, and lower ICU mean systolic blood pressure (all p < 0.05).
On baseline qualitative data, there were differences between the two groups in gender, propofol, fentanyl, ciprofloxacin, and mild liver disease (Table 2). The percentage of males in the ICU LOS ≥ 7 days group was 71.111% and 28.889% of females, whereas the percentage of males in the ICU LOS < 7 days group was 53.604% and 46.396% of females. The ICU LOS ≥ 7 days group had a higher percentage of propofol (91.111% vs. 41.441%), fentanyl (86.667% vs. 50.000%), and ciprofloxacin (73.333% vs. 35.586%) use. The ICU LOS≥7 days group had 40.000% of patients with mild liver disease, while only 18.018% of patients in the ICU LOS < 7 days group had mild liver disease.
Analysis of the clinical value of sentiment polarity and sentiment subjectivity
As this study explored the correlation between sentiment scores in nursing notes and prognosis, and as baseline data showed that sentiment polarity and subjectivity differed between the two groups, the discriminative properties of both for ICU LOS were further examined using ROC analysis. In this study. ICU LOS was categorized into 3-day ICU LOS, 7-day ICU LOS, and 10-day ICU LOS. As shown in Table 3, the area under curve (AUC) values of sentiment polarity discrimination for 3-day ICU LOS, 7-day ICU LOS, and 10-day ICU LOS were 0.647 (0.571, 0.713), 0.704 (0.629, 0.777) and 0.691(0.610, 0.777), respectively, while AUC values of sentiment subjectivity discrimination for 3-day ICU LOS, 7-day ICU LOS, and 10-day ICU LOS were 0.531(0.456, 0.583), 0.594 (0.517, 0.664) and 0.657 (0.592, 0.728), respectively. The results of the DeLong test suggested that the performance of sentiment polarity in discriminating 3-day ICU LOS was better than sentiment subjectivity (p = 0.015).
Decision curve analysis (DCA) was used to explore the clinical net benefits of sentiment polarity and subjectivity in discriminating between 3-day, 7-day, and 10-day ICU LOS. In DCA, the high-risk threshold probability denotes the discrimination probability of a prolonged ICU stay at which a clinician would be indifferent between intervening and not intervening; net benefit was referenced against the treat-all (intervene in every patient) and treat-none (intervene in no patient) strategies, so the threshold ranges given below indicate the discrimination risk window over which acting on each metric could be clinically reasonable. As shown in Figure 1A, when the threshold was about 0.30-0.58, the clinical benefit of the sentiment polarity for discriminating 3-day ICU LOS was higher than that of the sentiment subjectivity, treat-all, and treat-none models. When the threshold was about 0.10-0.30, the clinical benefit of the sentiment polarity for discriminating 7-day ICU LOS was higher than that of the sentiment subjectivity, treat-all, and treat-none model (Figure 1B). A similar result was also observed in discriminating 10-day ICU LOS, with a threshold of about 0.10-0.22 (Figure 1C). Both ROC and DCA analyses indicated that, among the two text-derived metrics, sentiment polarity provided somewhat greater discrimination and net clinical benefit than sentiment subjectivity for discriminating ICU LOS, particularly for 7-day ICU LOS. These comparisons are exploratory and limited to the two sentiment metrics; they do not establish that sentiment polarity is superior to established severity scores.
The discriminative performance of sentiment polarity relative to other indicators, including differences in baseline data on 7-day ICU LOS, was further compared. As shown in Table 4, the AUC values of sentiment polarity, sentiment subjectivity, glucose, albumin, bicarbonate, SOFA, APSIII, ICU mean heart rate, ICU mean systolic blood pressure, gender, propofol, fentanyl, ciprofloxacin, and mild liver disease in discriminating 7-day ICU LOS were 0.688 (0.606, 0.757), 0.559 (0.441, 0.655), 0.636 (0.549, 0.719), 0.684 (0.582-0.785), 0.585 (0.490-0.679), 0.759 (0.688, 0.826), 0.752 (0.697, 0.836), 0.668 (0.587, 0.756), 0.619 (0.530, 0.707), 0.588 (0.513, 0.662), 0.726 (0.681, 0.783), 0.673 (0.621, 0.727), 0.660 (0.589, 0.720), 0.603 (0.510, 0.672), respectively. By DeLong's test, sentiment polarity showed a statistically higher AUC than sentiment subjectivity (p = 0.034) and gender (p = 0.023). For all other comparators, including the clinical severity scores SOFA (AUC = 0.759, p = 0.267) and APSIII (AUC = 0.752, p = 0.338) and propofol use (AUC = 0.726, p = 0.446), as well as glucose, albumin, bicarbonate, ICU mean heart rate, ICU mean systolic blood pressure, fentanyl, ciprofloxacin, and mild liver disease, the AUC differences relative to sentiment polarity were not statistically significant (all p > 0.05), regardless of which direction the point estimate favored. Although SOFA, APSIII, and propofol use had numerically higher point-estimate AUCs than sentiment polarity, this numerical difference did not reach statistical significance, and sentiment polarity's AUC was likewise not statistically distinguishable from several indicators with lower point estimates (e.g., albumin, bicarbonate, ICU mean systolic blood pressure). Taken together, these results indicate that sentiment polarity exhibited discriminative ability that was statistically comparable to, rather than uniformly superior to, established clinical severity measures, while showing a significant advantage over sentiment subjectivity and gender alone. Sentiment polarity's value is therefore best framed as competitive and complementary rather than superior to validated severity indices: its principal advantage lies in its automatic extraction from routine nursing notes, providing a low-cost, scalable signal that may supplement, rather than replace, instruments such as SOFA and APSIII.
On internal validation by 1000 bootstrap resamples, optimism was negligible: for 7-day ICU LOS, the single-index sentiment-polarity model (Figure 4A) had an optimism-corrected AUC of 0.70 (apparent 0.704), with a calibration slope of 1.06 and a Brier score of 0.138 (mean absolute calibration error = 0.04), while the model additionally adjusted for SOFA and APSIII (Figure 4B) showed a mean absolute calibration error of 0.034, indicating stable discrimination and adequate calibration; in the absence of an external cohort, these findings remain exploratory.
Correlation of sentiment polarity and sentiment subjectivity, with ICU LOS
The results of the RCS analysis (Figures 2A–B) suggested that sentiment polarity showed a nonlinear relationship with 7-day ICU LOS (p for overall = 0.002, p for nonlinear = 0.027), and sentiment subjectivity did not have a linear or nonlinear relationship with 7-day ICU LOS (p for overall = 0.205, p for nonlinear = 0.227). The results of RCS only found a correlation between sentiment polarity and ICU LOS, so the independent association between sentiment polarity and ICU LOS using generalized linear regression was further explored. When setting ICU LOS as a binary variable (Table 5), sentiment polarity had a correlation with ICU LOS with or without adjustment [crude model: OR(95%) = 1.83 (1.29, 2.61), p < 0.001; model 1:OR(95%) = 1.75 (1.21, 2.54), p = 0.003; model 2: OR(95%) = 2.30 (1.31, 4.03), p = 0.004; model 3: OR(95%) = 1.63 (0.92, 2.87), p = 0.092]. The same result was also found in setting ICU LOS as a continuous variable (Table 5) [crude model: β = 17.786 (9.169, 26.404), p < 0.001; model 1: β = 14.724 (6.287, 23.162), p = 0.001; model 2: β = 15.963 (5.352, 26.574), p = 0.003; model 3: β = 11.362 (0.976, 21.749), p = 0.032].
Correlation of sentiment polarity with secondary outcomes (postoperative infection, in-hospital death, and 28-day LOS)
The correlation between sentiment polarity and secondary outcomes was further explored. Among the 267 patients, postoperative infection occurred in 38/267, in-hospital death in 36/267 (13.5%), and a 28-day hospital LOS in 39/267 (14.6%). As shown in Figure 3A–C, there was a nonlinear relationship between sentiment polarity and in-hospital death (p for overall = 0.010, p for nonlinear = 0.046), while there was a linear relationship between sentiment polarity and 28-day LOS (p for overall < 0.001, p for nonlinear = 0.217), nevertheless, sentiment polarity did not have a linear or nonlinear relationship with postoperative infection (p for overall = 0.562, p for nonlinear = 0.364). Based on these results, ROC analysis was used to explore the ability of sentiment polarity in discriminating between in-hospital death and 28-day LOS. The AUC values of sentiment polarity in discriminating in-hospital death and 28-day LOS were 0.674 (0.602, 0.755) and 0.753 (0.669, 0.847), respectively. At the same time, the sensitivity of sentiment polarity in discriminating in-hospital death and 28-day LOS was 0.694 (0.453, 0.896) and 0.667 (0.503, 0.959), respectively. The corresponding specificities were 0.649 (0.495, 0.863) and 0.737 (0.457, 0.912), and the accuracies were 0.672 (0.536, 0.820) and 0.733 (0.510, 0.868), respectively (Table 6; all 95% CIs obtained by bootstrap resampling). Because the numbers of in-hospital deaths and 28-day events were small and no internal or external validation was performed, these secondary-outcome analyses should be regarded as exploratory and require confirmation in adequately powered, validated, and severity-adjusted analyses.
DATA AVAILABILITY:
MIMIC-IV is a restricted-access database; informed consent for the original data collection was obtained from patients at the source institutions during routine clinical care and database construction, whereas the present study is a secondary analysis of the already de-identified MIMIC-IV database for which the requirement for additional individual informed consent was waived. The raw data can be obtained by completing the CITI "Data or Specimens Only Research" training and signing the PhysioNet Credentialed Health Data Use Agreement (https://physionet.org/content/mimiciv/). Because the MIMIC-IV Data Use Agreement prohibits redistribution of the individual patient records, the raw data cannot be deposited publicly; however, the de-identified derived dataset underlying the present analyses, together with the complete SQL extraction queries and analysis scripts required to regenerate it from MIMIC-IV, has been provided to the journal as supplementary files. Both the data extraction code and the raw data are available in Supplementary Table 1 and Supplementary Coding File.
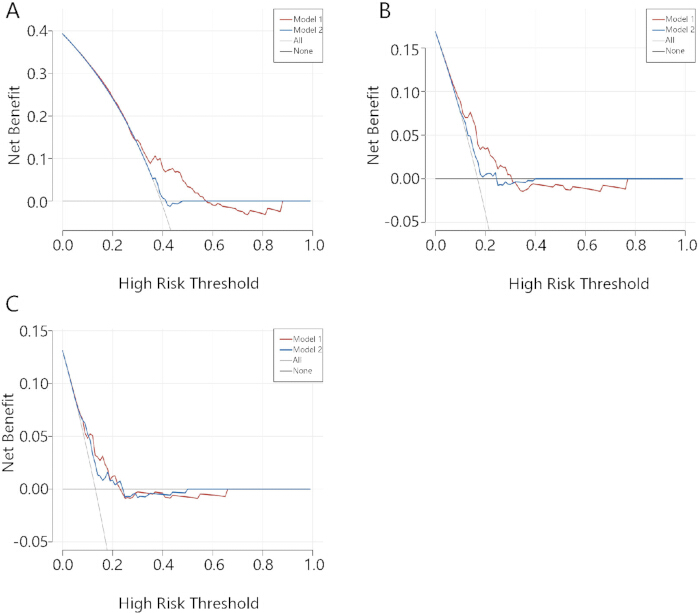
Figure 1: The clinical net benefit of sentiment polarity and sentiment subjectivity in discriminating 3-day ICU LOS, 7-day ICU LOS, and 10-day ICU LOS. (A) 3-day ICU LOS, (B) 7-day ICU LOS, (C) 10-day ICU LOS, Model 1: sentiment polarity, Model 2: sentiment subjectivity. The x-axis shows the probability of the high-risk threshold, and the y-axis shows the net benefit. The grey “All” line (treat-all) assumes every patient is treated as high risk, and the black “None” line (treat-none) assumes no patient is treated; Model 1 and Model 2 each use a single discrimination index (sentiment polarity and sentiment subjectivity, respectively). The outcomes were defined as ICU LOS ≥ 3 days (A), ≥ 7 days (B), and ≥ 10 days (C). N = 267. Abbreviations: ICU = intensive care unit, LOS = length of stay. Please click here to view a larger version of this figure.
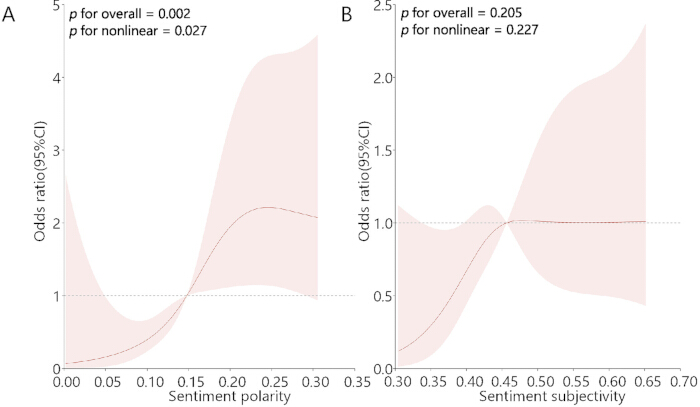
Figure 2: Correlation of sentiment polarity and sentiment subjectivity with ICU LOS. (A) Sentiment polarity, (B) Sentiment subjectivity. The outcome was 7-day ICU LOS (coded as a binary event, ≥ 7 days vs. < 7 days). The solid line shows the estimated odds ratio across the exposure range and the shaded band the corresponding 95% confidence interval; the horizontal dashed line marks an odds ratio of 1. Restricted cubic splines were fitted with 4 knots at the 5th, 35th, 65th, and 95th percentiles for each exposure, with the reference value set to the median. The model was unadjusted. N = 267. Abbreviations: ICU = intensive care unit, LOS = length of stay. Please click here to view a larger version of this figure.
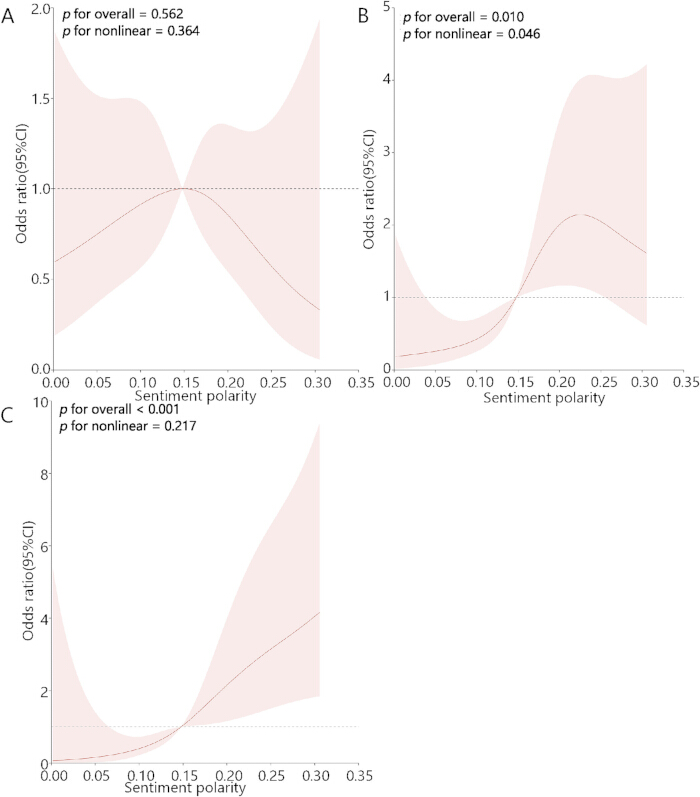
Figure 3: Correlation of sentiment polarity with secondary outcomes (postoperative infection, in-hospital death, and 28-day LOS). (A) Postoperative infection, (B) In-hospital death, (C) 28-day LOS. Postoperative infection and in-hospital death were coded as binary events; 28-day LOS was coded as a binary event (≥ 28 days vs. < 28 days). The solid line shows the estimated odds ratio and the shaded band the 95% confidence interval, with the horizontal dashed line at an odds ratio of 1. Restricted cubic splines were fitted with 4 knots at the 5th, 35th, 65th, and 95th percentiles of sentiment polarity, with the reference value at the median. The model was unadjusted. N = 267. Abbreviations: LOS = length of stay. Please click here to view a larger version of this figure.
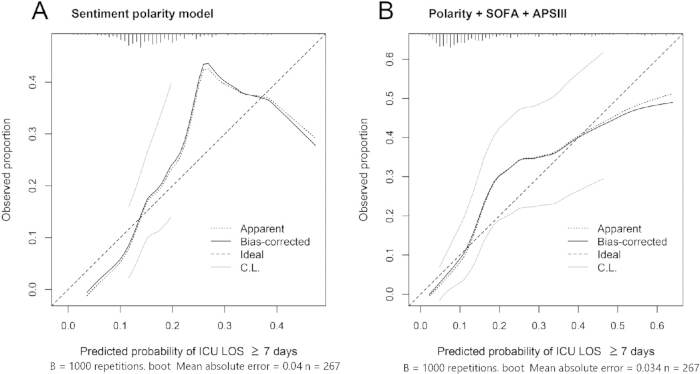
Figure 4: Calibration of the sentiment-polarity models for 7-day ICU LOS, assessed by 1000 bootstrap resamples. (A) Single discrimination index sentiment polarity model; (B) model additionally adjusted for SOFA and APSIII. The dashed diagonal denotes perfect calibration (Ideal); the dotted line is the apparent calibration, and the solid line is the bootstrap bias-corrected calibration; grey lines are 0.95 confidence limits, and the rug plot shows the distribution of discrimination probabilities. Mean absolute error = 0.04 (A) and 0.034 (B). N = 267. Please click here to view a larger version of this figure.
| Variable | ICU LOS < 7 days (N = 222) | ICU LOS ≥ 7 days (N = 45) | p |
| Sentiment polarity | 0.131 [0.095,0.185] | 0.178 [0.154,0.236] | <0.001 |
| Sentiment subjectivity | 0.453 [0.396,0.517] | 0.487 [0.435,0.533] | 0.046 |
| Age (years old) | 67.000 [57.000,77.000] | 67.000 [57.000,76.000] | 0.847 |
| BMI (kg/m2) | 28.000 [25.400,33.200] | 29.000 [27.100,34.700] | 0.45 |
| Glucose (mg/dL) | 127.000 [103.000,158.000] | 137.000 [115.000,194.000] | 0.013 |
| Albumin (g/dL) | 3.044 ± 0.538 | 2.628 ± 0.727 | <0.001 |
| ALT (IU/L) | 68.000 [27.000,206.000] | 49.000 [29.000,178.000] | 0.406 |
| Anion gap (mEq/L) | 14.000 [13.000,17.000] | 14.000 [13.000,17.000] | 0.578 |
| AST (IU/L) | 78.000 [39.000,223.000] | 71.000 [38.000,192.000] | 0.942 |
| Bicarbonate (mEq/L) | 23.419 ± 4.227 | 21.778 ± 5.485 | 0.026 |
| Blood urea nitrogen (mg/dL) | 16.000 [12.000,23.000] | 20.000 [11.000,30.000] | 0.219 |
| Chloride (mEq/L) | 105.000 [101.000,108.000] | 106.000 [100.000,109.000] | 0.214 |
| Creatinine (mg/dL) | 0.900 [0.800,1.300] | 1.100 [0.800,1.800] | 0.231 |
| Hematocrit (%) | 33.843 ± 6.179 | 32.531 ± 6.620 | 0.202 |
| Platelets (K/µL) | 211.000 [155.000,287.000] | 189.000 [135.000,275.000] | 0.347 |
| Potassium (mEq/L) | 4.100 [3.700,4.600] | 4.300 [3.800,4.800] | 0.393 |
| RBC (m/µL) | 3.724 ± 0.688 | 3.546 ± 0.755 | 0.123 |
| RDW (%) | 14.600 [13.800,15.600] | 14.500 [13.900,15.800] | 0.984 |
| Sodium (mEq/L) | 138.000 [136.000,141.000] | 139.000 [136.000,142.000] | 0.644 |
| Lactate (mmol/L) | 1.500 [1.100,2.200] | 1.700 [1.200,2.600] | 0.313 |
| Lymphocyte (%) | 8.000 [5.000,13.500] | 8.700 [5.000,14.000] | 0.666 |
| WBC (K/µL) | 11.300 [8.400,15.600] | 11.300 [8.200,16.500] | 0.65 |
| CCI | 5.000 [3.000,7.000] | 6.000 [4.000,8.000] | 0.199 |
| SOFA | 4.000 [2.000,6.000] | 6.000 [5.000,11.000] | <0.001 |
| APSIII | 40.000 [32.000,54.000] | 58.000 [45.000,70.000] | <0.001 |
| ICU mean heart rate (bpm) | 88.806 [77.708,100.161] | 95.885 [87.917,109.686] | <0.001 |
| ICU mean systolic blood pressure (mmHg) | 117.296 [106.667,127.478] | 110.259 [102.808,120.353] | 0.014 |
| ICU mean diastolic blood pressure (mmHg) | 60.133 [54.313,67.227] | 57.953 [51.000,62.278] | 0.108 |
Table 1: Baseline quantitative information of patients undergoing cholecystectomy. Abbreviations: BMI = body mass index; ALT alanine transaminase; AST = aspartate aminotransferase; RBC = red blood cell; RDW = red cell distribution width; WBC = white blood cell; CCI = Charlson comorbidity index; SOFA = sequential organ failure assessment; APSIII = simplified acute physiology score III; ICU = intensive care unit; LOS = length of stay.
| Variable | ICU LOS < 7 days (N = 222) | ICU LOS ≥ 7 days (N = 45) | p | |
| Gender | Male | 119 (53.604) | 32 (71.111) | 0.031 |
| Female | 103 (46.396) | 13 (28.889) | ||
| Race | White | 168 (77.419) | 29 (69.048) | 0.244 |
| Others | 49 (22.581) | 13 (30.952) | ||
| Marital status | Married | 107 (50.472) | 16 (37.209) | 0.113 |
| Others | 105 (49.528) | 27 (62.791) | ||
| Smoking | No | 214 (96.396) | 44 (97.778) | 0.64 |
| Yes | 8 (3.604) | 1 (2.222) | ||
| Drinking alcohol | No | 191 (86.036) | 38 (84.444) | 0.781 |
| Yes | 31 (13.964) | 7 (15.556) | ||
| Propofol | No | 130 (58.559) | 4 (8.889) | <0.001 |
| Yes | 92 (41.441) | 41 (91.111) | ||
| Fentanyl | No | 111 (50.000) | 6 (13.333) | <0.001 |
| Yes | 111 (50.000) | 39 (86.667) | ||
| Ciprofloxacin | No | 143 (64.414) | 12 (26.667) | <0.001 |
| Yes | 79 (35.586) | 33 (73.333) | ||
| Levofloxacin | No | 196 (88.288) | 36 (80.000) | 0.133 |
| Yes | 26 (11.712) | 9 (20.000) | ||
| Hypertension | No | 98 (44.144) | 20 (44.444) | 0.97 |
| Yes | 124 (55.856) | 25 (55.556) | ||
| Hyperlipidemia | No | 157 (70.721) | 36 (80.000) | 0.205 |
| Yes | 65 (29.279) | 9 (20.000) | ||
| Myocardial infarction | No | 198 (89.189) | 41 (91.111) | 0.701 |
| Yes | 24 (10.811) | 4 (8.889) | ||
| Congestive heart failure | no | 186 (83.784) | 37 (82.222) | 0.797 |
| yes | 36 (16.216) | 8 (17.778) | ||
| Cerebrovascular disease | no | 212 (95.495) | 41 (91.111) | 0.229 |
| yes | 10 (4.505) | 4 (8.889) | ||
| Dementia | no | 220 (99.099) | 44 (97.778) | 0.443 |
| yes | 2 (0.901) | 1 (2.222) | ||
| Mild liver disease | no | 182 (81.982) | 27 (60.000) | 0.001 |
| yes | 40 (18.018) | 18 (40.000) | ||
| Chronic pulmonary disease | no | 161 (72.523) | 37 (82.222) | 0.175 |
| yes | 61 (27.477) | 8 (17.778) |
Table 2: Baseline qualitative information of patients undergoing cholecystectomy. Abbreviations: ICU = intensive care unit, LOS = length of stay.
| Variable | AUC (95%CI) | Sensitivity (95%CI) | Specificity (95%CI) | Accuracy (95%CI) | Optimal threshold (95%CI) | Delong-test p | |
| 3-day ICU LOS | Sentiment polarity | 0.647 (0.571,0.713) | 0.638 (0.345,0.745) | 0.623 (0.556,0.891) | 0.660 (0.602,0.697) | 0.151 (0.131,0.208) | 0.015 |
| Sentiment subjectivity | 0.531 (0.456,0.583) | 0.762 (0.271,0.981) | 0.333 (0.093,0.829) | 0.528 (0.436,0.617) | 0.413 (0.350,0.528) | / | |
| 7-day ICU LOS | Sentiment polarity | 0.704 (0.629,0.777) | 0.867 (0.433,0.937) | 0.500 (0.464,0.875) | 0.633 (0.540,0.819) | 0.133 (0.133,0.211) | 0.057 |
| Sentiment subjectivity | 0.594 (0.517,0.664) | 0.756 (0.324,1.000) | 0.419 (0.141,0.873) | 0.498 (0.302,0.795) | 0.435 (0.360,0.569) | / | |
| 10-day ICU LOS | Sentiment polarity | 0.691 (0.610,0.777) | 0.800 (0.493,0.926) | 0.573 (0.524,0.871) | 0.643 (0.564,0.821) | 0.151 (0.151,0.211) | 0.587 |
| Sentiment subjectivity | 0.657 (0.592,0.728) | 0.857 (0.573,1.000) | 0.427 (0.284,0.731) | 0.507 (0.376,0.715) | 0.435 (0.413,0.506) | / |
Table 3: The discriminative ability of sentiment polarity and sentiment subjectivity in discriminating 3-day ICU LOS, 7-day ICU LOS, and 10-day ICU LOS. Data are point estimates with 95% CI in parentheses. The 95% CI for the AUC was calculated using the DeLong method; CIs for sensitivity, specificity, accuracy, and the optimal threshold were obtained by bootstrap resampling with 1000 replicates. The optimal threshold was determined by maximizing the Youden index (sensitivity + specificity − 1); sensitivity, specificity, and accuracy were calculated at this threshold, with accuracy defined as (true positives + true negatives) / total sample. The optimal threshold is expressed on the native scale of each variable (the discriminated-probability/sentiment-score scale here). The "DeLong-test" column reports the two-sided p-value of the DeLong test for the difference between two paired ROC curves: within each ICU-LOS threshold, sentiment polarity was compared against sentiment subjectivity, the latter serving as the reference curve and marked "/". A p-value < 0.05 indicates a statistically significant difference in discriminative ability between the two metrics. This analysis was conducted in a cohort of 267 patients. Abbreviations: ICU = intensive care unit, LOS = length of stay, AUC = area under the curve, CI = confidence interval.
| Variable | AUC (95%CI) | Sensitivity (95%CI) | Specificity (95%CI) | Accuracy (95%CI) | Optimal threshold (95%CI) | Delong-test p |
| Sentiment polarity | 0.688 (0.606,0.757) | 0.878 (0.427,0.942) | 0.451 (0.384,0.899) | 0.608 (0.491,0.806) | 0.133 (0.133,0.212) | / |
| Sentiment subjectivity | 0.559 (0.441,0.655) | 0.829 (0.184,1.000) | 0.295 (0.097,0.965) | 0.549 (0.263,0.847) | 0.413 (0.350,0.606) | 0.034 |
| Glucose | 0.636 (0.549,0.719) | 0.341 (0.264,0.971) | 0.890 (0.276,0.960) | 0.820 (0.7810.860) | 188.000 (106.000,209.325) | 0.456 |
| Albumin | 0.684 (0.582,0.785) | 0.465 (0.309,0.808) | 0.862 (0.528,0.976) | 0.783 (0.571,0.862) | 2.400 (2.100,2.900) | 0.971 |
| Bicarbonate | 0.585 (0.490,0.679) | 0.844 (0.128,0.936) | 0.311 (0.281,1.000) | 0.401 (0.375,0.884) | 25.000 (13.000,25.000) | 0.068 |
| SOFA | 0.759 (0.688,0.826) | 0.829 (0.491,0.931) | 0.590 (0.439,0.876) | 0.809 (0.758,0.849) | 5.000 (4.000,8.000) | 0.267 |
| APSIII | 0.752 (0.697,0.836) | 0.634 (0.558,0.930) | 0.775 (0.499,0.864) | 0.806 (0.767,0.855) | 56.000 (39.675,59.000) | 0.338 |
| ICU mean heart rate | 0.668 (0.587,0.756) | 0.610 (0.381,0.962) | 0.665 (0.334,0.935) | 0.809 (0.766-0.858) | 94.932 (81.195,107.326) | 0.738 |
| ICU mean systolic blood pressure | 0.619 (0.530,0.707) | 0.721 (0.422,0.964) | 0.511 (0.267,0.802) | 0.545 (0.367,0.750) | 116.880 (105.667,125.240) | 0.153 |
| Gender | 0.588 (0.513,0.662) | 0.711 (0.571,0.837) | 0.464 (0.400,0.537) | 0.506 (0.449,0.577) | 1.000 (1.000,1.000) | 0.023 |
| Propofol | 0.726 (0.681,0.783) | 0.902 (0.826,0.980) | 0.549 (0.491,0.631) | 0.617 (0.566,0.684) | 1.000 (1.000,1.000) | 0.446 |
| Fentanyl | 0.673 (0.621,0.727) | 0.878 (0.800,0.950) | 0.468 (0.401,0.533) | 0.543 (0.488,0.609) | 1.000 (1.000,1.000) | 0.765 |
| Ciprofloxacin | 0.660 (0.589,0.720) | 0.707 (0.555,0.826) | 0.613 (0.539,0.657) | 0.622 (0.563,0.683) | 1.000 (1.000,1.000) | 0.615 |
| Mild liver disease | 0.603 (0.510,0.672) | 0.415 (0.250,0.561) | 0.792 (0.731,0.840) | 0.715 (0.661,0.765) | 1.000 (1.000,1.000) | 0.156 |
Table 4: The discriminative ability of indicators, which were differences in baseline information, in discriminating 7-day ICU LOS. Data are point estimates with 95% CI in parentheses. The 95% CI for the AUC was calculated using the DeLong method; CIs for sensitivity, specificity, accuracy, and the optimal threshold were obtained by bootstrap resampling with 1000 replicates. The optimal threshold was determined by maximizing the Youden index (sensitivity + specificity − 1); sensitivity, specificity, and accuracy were calculated at this threshold, with accuracy defined as (true positives + true negatives) / total sample. The optimal threshold is expressed on the native scale of each variable (the discriminated-probability scale for the sentiment scores, the original clinical units for laboratory and vital-sign variables, and the coded value 1/2 for binary variables such as medications, gender, and comorbidities). The "DeLong-test" column reports the two-sided p-value of the DeLong test comparing the ROC curve of each listed variable against that of sentiment polarity, which served as the reference model and is marked "/". A p value < 0.05 indicates that the variable's discriminative ability differs significantly from that of sentiment polarity. This analysis was conducted in a 214-patient complete-case cohort. Abbreviations: SOFA = sequential organ failure assessment; APSIII = simplified acute physiology score III; ICU = intensive care unit; LOS = length of stay; AUC = area under the curve; CI = confidence interval
| Set ICU LOS as a binary variable (7-day ICU LOS) | ||
| Model | OR per 1-SD (95%CI) | p |
| Crude model | 1.83 [1.29, 2.61] | <0.001 |
| Model 1 | 1.75 [1.21, 2.54] | 0.003 |
| Model 2 | 2.30 [1.31, 4.03] | 0.004 |
| Model 3 | 1.63 [0.92, 2.87] | 0.092 |
| Set ICU LOS as a continuous variable | ||
| Model | β (95%CI) | p |
| Crude model | 17.786 [9.169,26.404] | <0.001 |
| Model 1 | 14.724 [6.287,23.162] | 0.001 |
| Model 2 | 15.963 [5.352,26.574] | 0.003 |
| Model 3 | 11.362 [0.976,21.749] | 0.032 |
Table 5: Correlation of sentiment polarity with ICU LOS. Crude model: no adjustments. Model 1 adjusted SOFA, APSIII; model 2 adjusted glucose, albumin, bicarbonate, ICU mean heart rate, ICU mean systolic blood pressure, gender, and mild liver disease; model 3 adjusted propofol, fentanyl, and ciprofloxacin. OR are expressed per 1-SD increase in sentiment polarity; the covariate-adjusted models (Models 2-3) were fitted on the 214 patients with complete albumin data. Although Model 3 adjusts only for medications (propofol, fentanyl, and ciprofloxacin) and does not itself include albumin, it was deliberately restricted to the same 214-patient complete-case cohort as Model 2 so that the two adjusted models are estimated on an identical sample and are directly comparable; the crude model and Model 1 were fitted on the full cohort of 267 patients. Abbreviations: ICU = intensive care unit, LOS = length of stay, CI = confidence interval, OR = odds ratio.
| Index | In-hospital death | 28-day LOS |
| AUC (95%CI) | 0.674 (0.602,0.755) | 0.753 (0.669,0.847) |
| Sensitivity (95%CI) | 0.694 (0.453,0.896) | 0.667 (0.503,0.959) |
| Specificity (95%CI) | 0.649 (0.495,0.863) | 0.737 (0.457,0.912) |
| Accuracy (95%CI) | 0.672 (0.536,0.820) | 0.733 (0.510,0.868) |
| Optimal threshold (95%CI) | 0.162 (0.148,0.209) | 0.178 (0.129,0.216) |
Table 6: The discriminative ability of sentiment polarity in discriminating in-hospital death and 28-day LOS. Values are point estimates with 95% CI in parentheses (AUC by the DeLong method; sensitivity, specificity, and accuracy by bootstrap resampling). Event counts: in-hospital death, n = 36/267; 28-day LOS ≥ 28 days, n = 39/267. Abbreviations: CI = confidence interval; AUC = area under the curve; LOS = length of stay.
Supplementary Table 1: Raw data. De-identified raw data used in the study.Please click here to download this file.
Supplementary Coding File: Coding file. The codes used to run the analysis.Please click here to download this file.
Discussion
This study conducted a retrospective analysis of the MIMIC-IV database and observed that sentiment polarity showed greater discrimination and net clinical benefit than sentiment subjectivity. Sentiment polarity was associated with, and showed modest discriminative ability for, 7-day ICU LOS, and sentiment polarity was independently associated with ICU LOS, as well as associated with in-hospital death and 28-day LOS.
In this study, sentiment polarity was found to be related to prognosis. In many studies, similar relationships have been found25. A study on the prognosis of sepsis patients found that compared with the survival group, the 30-day mortality of patients had lower sentiment polarity and lower sentiment subjectivity. Both sentiment polarity and sentiment subjectivity were influencing factors of 30-day mortality of sepsis patients, and the AUC of the prognostic index model including sentiment subjectivity and emotional polarity was 0.78(0.74-0.81), indicating that sentiment polarity and sentiment subjectivity were related to the 30-day mortality of sepsis patients26. Similar results were found in another study of sepsis patients18. In the study of patients with acute pancreatitis, it was found that emotional polarity mean is the influencing factor of in-hospital death in patients with acute pancreatitis, and the discrimination performance of the discrimination model with the emotional polarity mean was better than that without the emotional polarity mean, as well as SOFA score and SAPS-II type12. The sentiment polarity of nursing notes was also found to discriminate the risk of patients falling27. Sentiment polarity was associated with ICU LOS, in-hospital death, and 28-day LOS in these cholecystectomy patients, and showed moderate discrimination for 7-day ICU LOS. To sum up, the sentiment scores based on nursing notes were closely related to the prognosis of many diseases, and more attention can be paid to the influence of the sentiment scores of nursing notes on the prognosis of patients in the follow-up research26.
Nursing notes include nursing needs, disease symptoms, nursing measures, and so on28. In addition to sentiment scores in nursing notes, other information can be used to discriminate patient prognosis, disease risk, etc. Scholars collected the discharge summary and nursing notes of patients with heart failure from June 1, 2015, to December 31, 2019, and analyzed the data with the Orange3 package. It was found that the nursing notes, as an analysis unit, could well discriminate the 30-day readmission (nursing notes AUC=0.85, discharge summary AUC=0.74)29. A natural language processing algorithm has been used to extract urinary-tract-infection–related information from nursing notes and to develop an improved recognition model30. All of the above studies suggested that the clinical value of nursing notes needs to be further explored.
Notably, the direction of the association observed in the present study, in which a higher sentiment polarity was associated with a longer ICU LOS, a higher risk of in-hospital death, and a longer 28-day LOS, appears counterintuitive and differs from some earlier reports, in which a lower polarity was associated with worse outcomes18,26. Several non-mutually-exclusive explanations may account for this finding. First, the polarity score was computed with a general-domain sentiment lexicon whose vocabulary overlaps only partially with clinical language; the reported lexical coverage of such methods in intensive-care notes is low (on the order of 5–20% of words), and their validity in medical text is highly variable. The score is therefore driven by a small subset of words and may not reflect the true clinical valence of a note. Second, the polarity score is liable to confounding by disease severity and care intensity. More severely ill patients tend to be documented more frequently and at greater length, to undergo more procedures, to receive more medications, and to require more complex nursing care; this longer and more heterogeneous text can shift the computed polarity independently of any genuine optimism on the part of the documenting nurse, while at the same time being associated with a longer stay and a higher risk of death. In this sense, sentiment polarity may act partly as a surrogate for documentation volume and clinical complexity rather than for clinician sentiment as such. These mechanisms are consistent with the retrospective, observational design of this study and indicate that the association should be regarded as a statistical signal requiring confirmation in prospective, severity-adjusted analyses rather than as evidence of a direct causal pathway.
ICU is a valuable resource. The ICU hospitalization costs were high and resources are scarce31. There are several factors that can affect ICU LOS, such as age32, and clinical history33. Most of these factors occur before or within 24 h of admission to the ICU and do not run through the whole ICU LOS of patients, retrospective, whereas nursing notes are generated throughout the entire ICU stay. It should be emphasized, however, that the sentiment polarity analyzed here is a textual feature automatically extracted from nursing notes by a general-purpose natural language processing tool (TextBlob), rather than a validated measure of the actual emotional state or attitude of clinicians. Off-the-shelf sentiment tools have been shown to capture clinically meaningful polarity in medical narratives only poorly and with highly variable validity34,35. A higher text-level polarity score, therefore, cannot be equated with a more positive attitude on the part of doctors or nurses. Furthermore, because this analysis is retrospective and observational, the association between sentiment polarity and ICU LOS is correlational and does not demonstrate that deliberately changing clinicians’ attitudes would shorten ICU LOS. Rather than prescribing a particular emotional stance for staff, findings of this study indicate that the sentiment embedded in routine nursing notes carries prognostic information that may serve as an adjunct marker for risk stratification and merits further investigation.
This study has several limitations. First, and most importantly, the text used for sentiment scoring was the hospital document for each patient's first index admission. A document is authored at the end of the admission and, by design, narrates the entire hospital course, including length of stay, procedures, complications, and discharge disposition. The sentiment score was therefore not measured prior to outcome accrual but was extracted from a document that already encodes the outcomes themselves. Because the document is a single end-of-stay document, no earlier extraction window preceding outcome accrual can be defined, and a landmark or early-window sensitivity analysis is not feasible. This temporal dependency between the text and the outcomes cannot be eliminated, given the data structure, and applies to all four outcomes. Accordingly, the associations reported here should be interpreted as descriptive and hypothesis-generating, and not as evidence that sentiment is an independent or prospectively measurable prognostic factor. Second, as this is a retrospective study, its ability to establish causality is limited. Some confounding factors that may have influenced the results, particularly objective measures of illness severity (e.g., SOFA or SAPS-II) and the volume and complexity of the source documentation, were not included. The possibility of reverse causality and residual confounding, therefore, cannot be excluded: patients with greater disease severity and longer ICU stays tend to generate longer and more complex documentation in which more clinical interventions are recorded, so the measured sentiment polarity may operate, at least in part, as a proxy for illness severity or documentation intensity rather than as a truly independent prognostic factor. In addition, several clinically important confounders, including operative complexity, intraoperative complications, the timing and indication of ICU admission, and delirium or sedation status, were not fully captured and may have influenced both the documentation and the outcomes. Third, sentiment scores were extracted using TextBlob, a general-purpose tool that was not designed for clinical language and has not been validated on clinical documentation; it may misclassify domain-specific terminology and does not adequately account for negation, abbreviations, or clinical context. In addition, there was no validation against manual review or a clinical NLP benchmark in this study. Consequently, the sentiment polarity metric may reflect linguistic patterns correlated with illness severity rather than the text's true affective content. Fourth, although medications were ascertained early (within the first 24 h of ICU admission) to reduce reverse causation, antimicrobial use, such as ciprofloxacin, may conceptually overlap with infection-related outcomes, and residual confounding by indication cannot be fully excluded. Fifth, serum albumin was missing for 50 patients (19%); baseline albumin, therefore, reflects available cases, and the covariate-adjusted regression models (Models 2–3) were fitted on the 214 patients with complete data.
Future work should employ clinically adapted natural language processing methods, such as domain-adapted transformer models trained on annotated clinical corpora, to improve the validity of sentiment measurement, and should adopt prospective designs with text captured within a defined window before outcome accrual and with adequate adjustment for severity and procedural confounders, to better disentangle any independent prognostic contribution of clinical-text sentiment.
In this retrospective cohort of cholecystectomy patients who had an ICU LOS ≥ 24 h, sentiment polarity derived from nursing notes was associated with ICU LOS, in-hospital death, and 28-day LOS. In this sample, sentiment polarity also showed relatively greater discriminative performance and net clinical benefit than sentiment subjectivity. These findings are exploratory and hypothesis-generating; given the observational design, they do not establish a causal relationship, and the potential clinical value of nursing-note sentiment warrants further exploration in larger, prospective, and externally validated studies before any discriminative application can be recommended.
Disclosures
The authors report no conflict of interest.
Acknowledgements
Not applicable.
Materials
| Name | Company | Catalog Number | Comments |
|---|---|---|---|
| boot (R package) | CRAN; https://cran.r-project.org/package=boot | 1.3-30 | Internal validation by 1000-replicate bootstrap resampling (optimism-corrected metrics) |
| G*Power software | http://www.gpower.hhu.de/ | 3.1.9.7 | Sample size calculation |
| MIMIC-IV (Medical Information Mart for Intensive Care IV) | PhysioNet; https://physionet.org/content/mimiciv/ | 3.1 | Source critical-care database; extraction of the cholecystectomy cohort, demographics, laboratory values, vital signs, severity scores, and outcomes |
| PostgreSQL | https://www.postgresql.org/ | 18.4 | Data extraction |
| pROC (R package) | CRAN; https://cran.r-project.org/package=pROC | 1.18.5 | ROC curve construction, AUC estimation, and DeLong test for comparison of AUCs |
| Python | Python Software Foundation; https://www.python.org | 3.6.4 | Natural-language sentiment scoring |
| R | R Foundation for Statistical Computing; https://www.r-project.org | 4.3.0 | Statistical analysis |
| rmda (R package) | CRAN; https://cran.r-project.org/package=rmda | 1.6 | Decision curve analysis (net benefit across risk thresholds) |
| rms (R package) | CRAN; https://cran.r-project.org/package=rms | 6.7-0 | Restricted cubic spline (RCS) modeling of nonlinear dose-response associations |
| TextBlob | Open source; https://textblob.readthedocs.io | 0.15.1 | Computation of sentiment polarity and sentiment subjectivity from nursing-note text |