This protocol presents a knowledge graph–based multimodal framework for semantic analysis and design assistance of traditional cultural patterns. It integrates EfficientNet-Lite feature extraction, graph neural network-based semantic reasoning, multimodal fusion, and retrieval-augmented generation to support pattern recognition, semantic interpretation, and knowledge-guided design assistance, achieving 96%–98% classification accuracy.
Research Article
Knowledge Graph–Based Multimodal Framework for Semantic Analysis and Design Assistance of Traditional Cultural Patterns
In This Article
Summary
Abstract
Traditional cultural pattern analysis requires the integration of visual characteristics with symbolic meanings, regional contexts, and cultural knowledge to support semantic interpretation and design assistance. Although existing approaches have contributed to visual feature learning and multimodal analysis, integrating visual features, semantic knowledge, and cultural contextual information within a unified framework remains challenging. This study presents a knowledge graph–based multimodal framework for semantic understanding and knowledge-guided design assistance of traditional cultural patterns, including decorative motifs in textiles, embroidery, ceramics, paintings, and other cultural heritage artifacts. The framework jointly processes traditional cultural pattern images and associated descriptive metadata. EfficientNet-Lite, a lightweight Convolutional Neural Network (CNN), extracts visual features, while a Graph Neural Network (GNN) maps these representations to structured cultural knowledge for semantic reasoning. Multimodal fusion integrates visual, semantic, and cultural contextual representations, and Retrieval-Augmented Generation (RAG) with knowledge filtering supports semantic explanation and pattern design assistance. The framework integrates Motif-Sikka, OS-CTPIG, and CraftMotifDB and follows a workflow comprising preprocessing, visual feature extraction, semantic mapping, knowledge graph reasoning, multimodal fusion, retrieval, and design generation. The framework achieved classification accuracies of 97.82% for Motif-Sikka, 97.35% for OS-CTPIG, and 96.94% for CraftMotifDB. Generated outputs achieved a Bilingual Evaluation Understudy (BLEU) score of up to 0.89, Structural Similarity Index Measure (SSIM) of up to 0.94, Fréchet Inception Distance (FID) as low as 21.35, and Learned Perceptual Image Patch Similarity (LPIPS) as low as 0.15. These results demonstrate the framework’s performance in classification and design-output evaluation while supporting knowledge-guided semantic reasoning and design assistance for traditional cultural patterns.
Introduction
Cultural heritage comprises tangible and intangible elements, including artifacts, historical places, customs, and knowledge systems transmitted across generations1. Cultural practices, artistic performances, dialects, and traditional knowledge represent intangible heritage, whereas tangible heritage includes monuments, artworks, written works, and archaeological sites2. Both forms contribute to social identity, cultural diversity, and community belonging and help sustain cultural continuity across generations. Cultural heritage nevertheless faces threats from armed conflict, urbanization, climate change, and catastrophic events3. Heritage buildings and archaeological sites are also affected by rising sea levels, severe weather, and increasing temperatures. Environmental, social, technical, and economic challenges therefore continue to complicate cultural heritage preservation and increase the need for effective preservation, documentation, and access strategies4,5. Urban expansion can result in the loss of heritage sites as space is created for new infrastructure. Armed conflict, looting, and illegal trafficking also contribute to the loss of cultural artifacts and highlight the importance of provenance investigation. Indigenous knowledge systems and intangible cultural resources are further threatened by the erosion of traditional practices and language loss associated with globalization and modernization6. The broader transition toward data-driven governance and knowledge economies is therefore relevant when examining heritage data infrastructures and the ways in which cultural information is organized, connected, and accessed7.
Traditional patterns form part of tangible and intangible cultural heritage and comprise ornamental visual motifs preserved across generations. They occur in paintings, wood carvings, ceramics, textiles, embroidery, and architectural ornamentation. Beyond decoration, these patterns can convey artistic techniques, historical influences, religious beliefs, regional identities, and symbolic meanings. For example, lotus designs can represent peace and purity, dragon motifs strength and wealth, and cloud and floral motifs natural harmony and auspiciousness. Preserving and interpreting these semantic relationships can support digital cultural heritage preservation and intelligent design assistance. In this study, “design” refers specifically to the creation and recommendation of traditional pattern designs intended to be culturally appropriate, rather than general visual or commercial design. The proposed system supports this process by extracting semantically relevant motifs, evaluating their cultural meanings through a knowledge graph, and producing design recommendations through Retrieval-Augmented Generation (RAG).
Knowledge Graphs (KGs) have emerged as tools for cultural heritage preservation. KGs are structured representations of real-world entities and their relationships, organized through semantic models to support knowledge integration, retrieval, and reasoning8,9,10. KGs have increasingly been applied to integrate, manage, and distribute cultural heritage information11,12 and have developed from semantic web technologies into scalable knowledge infrastructures capable of supporting reasoning across large, heterogeneous datasets13. Their capacity to connect entities, attributes, and relationships makes them relevant to cultural information that combines visual, historical, regional, and symbolic dimensions. Researchers have also developed knowledge-management models for product development, including ontology-based building lifecycle management, large-scale Resource Description Framework (RDF) data management, and Extensible Markup Language (XML) topic-map and ontology-based product-development knowledge representation14. Such models can present inefficiencies in acquiring required knowledge. In cultural heritage, existing platforms can support data management and retrieval but may provide limited visualization of relationships among motifs, symbolic meanings, regional contexts, artistic techniques, and related cultural knowledge. These limitations can make semantic relationships difficult to explore intuitively and can restrict explainability and knowledge-guided design support, particularly when cultural knowledge spans multiple disciplines and heterogeneous sources.
Related graph-based research provides methods for representing and reasoning over complex relationships. Hybrid transformer and Graph Convolutional Network (GCN) approaches have been investigated for text classification15. GCN research has also examined over-smoothing, in which node representations become less distinguishable as network depth increases, and has proposed fully connected layers to mitigate this problem16. Other work has examined relationships between transformer architectures and Graph Neural Networks (GNNs), including their different inductive biases17. Graph Attention Networks (GATs) enable nodes to assign different weights dynamically to neighboring nodes, while the multi rotational graph attention network (MRGAT) was introduced to model complex relationships and semantic information in knowledge graphs18. A knowledge graph functions as a semantic network connecting entities and their relationships across disparate data19,20. It can bridge structured and unstructured information, connect multiple data sources, and represent information flow. Knowledge graphs have been applied in smart manufacturing21, computer-aided design (CAD) models22, electronic commerce23, and conceptual product design, including product-attribute acquisition, design-knowledge management, and unified process-information modeling24. Knowledge graph construction commonly includes domain ontology construction, knowledge extraction, knowledge fusion, knowledge reasoning, and graph application. Entity and relation extraction are central processes25. Earlier entity-extraction approaches used statistical and machine-learning models, including hidden Markov models, support vector machines, and Conditional Random Fields (CRFs)26, to identify entities in unstructured text. Deep-learning models have subsequently been applied to sequence-labeling tasks for entity extraction, with reported accuracy exceeding 70% in the cited literature.
Cultural heritage research has developed resources specifically for semantic interpretation and symbolism. ICON is a FAIR-compliant ontology representing interpretations of artworks, including iconographies, symbols, and iconological meanings. Based on Panofsky’s interpretation theory and aligned with cultural heritage ontologies, ICON supports structured representation and linkage of artworks through motifs and symbolic meanings27. The Simulation Ontology models cultural symbolism using semantic web technologies and introduces HyperReal, a knowledge graph for structured representation of symbolic meanings and cultural knowledge28. IICONGRAPH extends ArCo and Wikidata to support iconographic and iconological representation, semantic reasoning, and domain-specific queries29. The Multivocal Exhibition application uses HyperReal to support personalized cross-cultural art curation, illustrating the use of symbolism-based knowledge graphs for cultural awareness and engagement30. Together, these resources demonstrate established contributions to semantic representation in cultural heritage and provide relevant context for the present framework.
Transformer-based language models provide contextual representation learning and semantic understanding relevant to knowledge-driven retrieval. Previous work used Bidirectional Encoder Representations from Transformers (BERT) and BioBERT for multilabel classification with data augmentation31. Such contextual representations can support multimodal semantic reasoning and knowledge-driven information retrieval32. In the proposed framework, semantic retrieval is applied to traditional cultural patterns. For example, when a user provides a lotus motif, the system can retrieve associated cultural information, including symbolic meaning, regional origin, traditional artistic techniques, and visually similar motifs, and use this information to provide design recommendations with semantic explanations that connect retrieved knowledge to the design-assistance process.
Despite advances in computer vision, multimodal learning, and knowledge graph technologies for cultural heritage analysis, several challenges remain. First, much existing research emphasizes visual feature extraction and pattern recognition, with comparatively less attention to semantic interpretation of cultural symbolism and historical context. Second, although knowledge graphs are increasingly used to organize cultural knowledge, their integration with deep visual feature learning for semantic reasoning remains an area requiring further investigation. Third, although multimodal fusion methods have shown promise for combining heterogeneous information, integrating visual features, semantic knowledge, and contextual cultural metadata within a unified framework remains challenging. Existing approaches also frequently emphasize either pattern generation or retrieval, leaving opportunities for closer integration of knowledge-guided retrieval with explainable design support. These gaps motivate a framework that connects visual recognition, structured cultural knowledge, multimodal integration, and retrieval-based assistance rather than treating these functions independently. This integration is intended to preserve relationships among visual evidence, semantic annotations, and cultural context throughout the analysis and design workflow.
This study therefore proposes a unified knowledge graph-driven framework for semantic understanding and retrieval-augmented design assistance. EfficientNet-Lite extracts discriminative visual representations while limiting computational requirements. GNNs then map visual embeddings to a cultural knowledge graph, supporting semantic reasoning over motif-symbol-region relationships. A multimodal fusion module combines visual, semantic, and cultural contextual information into a shared representation. Finally, RAG uses knowledge-guided retrieval and contextual reasoning to support semantic explanations and culturally relevant design recommendations.
The framework contains four complementary components that correspond to the identified research gaps. EfficientNet-Lite provides computationally efficient visual representations. The knowledge graph and GNN components support semantic reasoning across relationships among motifs, symbols, regions, and cultural meanings. Multimodal fusion combines visual, semantic, and contextual information to support integrated semantic understanding. The RAG component uses retrieved cultural knowledge to support design recommendations and semantic explanations.
The primary objective is to develop a knowledge graph-based system for semantic understanding and design assistance for traditional patterns. Specifically, the framework aims to extract discriminative visual features using a lightweight deep-learning architecture; map these features to structured cultural knowledge through graph-based semantic reasoning; integrate multiple modalities for contextual understanding; and support culturally relevant designs through retrieval-based assistance.
The main contribution is a unified framework combining computer vision, knowledge representation, multimodal fusion, and retrieval-augmented generation for analysis of traditional cultural patterns. The framework uses two complementary input modalities: traditional cultural pattern images from cultural heritage datasets and descriptive metadata, including motif category, artistic technique, regional origin, symbolic meaning, and other semantic annotations. EfficientNet-Lite extracts visual features, while descriptive metadata are organized within a cultural knowledge graph for semantic reasoning. A GNN-based semantic reasoning module links visual information with structured cultural knowledge, and multimodal fusion integrates visual representations, semantic embeddings, and cultural contextual metadata within a shared feature space. RAG then uses these representations and retrieved cultural knowledge to support semantic explanations and design recommendations. Experimental evaluation compares classification accuracy, semantic retrieval performance, computational efficiency, and design quality with existing methods.
Protocol
This study did not involve human participants, vertebrate animals, human or animal tissues, or identifiable human data. The study used publicly available traditional cultural pattern image datasets and associated cultural metadata, including Motif-Sikka, OS-CTPIG, and CraftMotifDB, for computational analysis, model development, and evaluation. Therefore, institutional ethics approval was not required for this study.
The proposed technique requires a systematic way of ensuring that semantic information can be made available using conventional techniques and intelligent support during the design phase. This is achieved using various datasets such as Motif-Sikka, OS-CTPIG, and CraftMotifDB. Preprocessing techniques involving normalization and noise reduction are applied to the input pattern images, and cultural data are organized for knowledge graphs. After that, EfficientNet-Lite is used to extract computationally efficient visual feature sets from the input images. Knowledge graphs are also generated to represent motif-symbol-region relationships along with cultural meanings.
The obtained visual features are then semantically mapped onto the knowledge graph using GNNs, allowing contextual reasoning and improved interpretation of symbolic connections. Such features are enhanced using multimodal fusion by combining visual features, semantic features, and cultural information. This is followed by pattern retrieval and context extraction using RAG with knowledge filtering to produce culturally meaningful and design-aligned outputs. An interactive design assistance module is also included to provide explainable recommendations to the user. Lastly, the model is trained and optimized using suitable training techniques and evaluated using common evaluation metrics, including accuracy, precision, recall, F1-score, and semantic relevance. Figure 1 shows the overall architecture of the proposed work. Figure 1 illustrates the complete workflow of the knowledge graph-based semantic understanding and intelligent design assistance system for traditional patterns. It begins with multiple input data sources, including pattern image datasets (Motif-Sikka and OS-CTPIG), a cultural knowledge database (CraftMotifDB), and a user query. After the data are processed using preprocessing techniques such as resizing, normalization, denoising, and data augmentation, the processed images are passed through the pretrained EfficientNet-Lite network, which learns visual information such as edges, textures, and structural patterns and encodes them into vectorized features. A knowledge graph is then generated to map relationships among elements such as motifs, regions, symbols, and cultural meanings. Using GNN-based models, message passing integrates knowledge with the visual features and enriches the vectorized features through contextual reasoning. Multimodal fusion is performed by combining the visual features with semantic embeddings and cultural information. Subsequently, retrieval and generation of relevant patterns and knowledge are conducted using the RAG framework. Lastly, the outputs include generated patterns, semantic explanations, design recommendations, and similar retrieved patterns. A knowledge base facilitates the process by providing culturally encoded data, and the system uses user feedback for further improvement. Overall, Figure 1 shows how deep learning, knowledge graphs, and generative artificial intelligence are combined to provide intelligent and culturally informed design support.
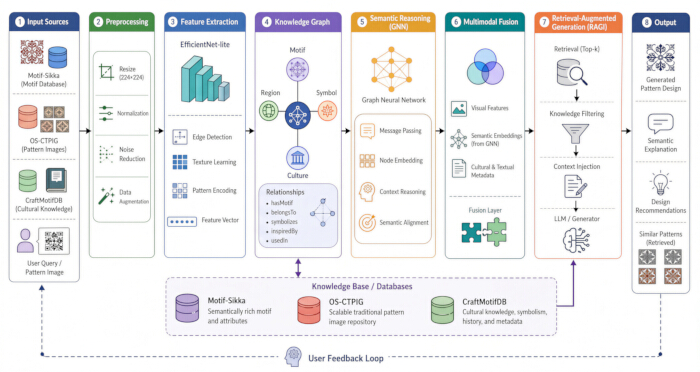
Figure 1. Overall architecture of the proposed knowledge graph-based semantic understanding and intelligent design assistance framework. The workflow illustrates the processing of traditional cultural pattern images and associated cultural knowledge through preprocessing, EfficientNet-Lite-based feature extraction, knowledge graph (KG) construction, graph neural network (GNN)-based semantic reasoning, multimodal fusion, and retrieval-augmented generation (RAG). The resulting outputs include generated pattern designs, semantic explanations, design recommendations, and retrieved similar patterns. The knowledge base integrates the Motif-Sikka, OS-CTPIG, and CraftMotifDB datasets and supports retrieval and semantic reasoning throughout the framework. Please click here to view a larger version of this figure.
Data Collection and Integration
The data acquisition and integration procedure is important for ensuring the effectiveness of the proposed knowledge graph-based approach. In the current study, several heterogeneous datasets of traditional pattern images and their cultural metadata are acquired and integrated to establish an extensive database. In particular, Motif-Sikka, OS-CTPIG, and CraftMotifDB are used to address various aspects of traditional patterns, including imagery, symbolism, regional characteristics, and cultural meanings. The acquired data comprise image instances annotated according to their classification, structure, and semiotic meaning.
To ensure consistent data integration, all datasets undergo preprocessing steps, including image resizing, normalization, denoising, and annotation standardization. In addition, metadata from different sources are transformed into a single format for knowledge graph construction. Redundancies and inaccuracies in the data are detected and corrected to improve data quality. Metadata quality was assessed by checking for missing values, duplicate records, inconsistent field formats, conflicting category names, and mismatches between image annotations and their associated metadata. Records containing missing required metadata or corrupted images were excluded, whereas inconsistent categorical labels and metadata fields were standardized according to the common annotation schema for motif type, cultural origin, artistic technique, symbolic meaning, and descriptive features. Duplicate samples were identified using image-level similarity and metadata verification and were removed before dataset integration. These procedures were applied consistently across the Motif-Sikka, OS-CTPIG, and CraftMotifDB datasets to minimize redundancy and maintain consistency within the integrated multimodal dataset. The resulting database serves as a multimodal knowledge repository that is subsequently used for feature extraction, semantic mapping, and model training. Table 1 provides the dataset descriptions.
Table 1: Datasets used for model development and evaluation. The table summarizes the three datasets integrated into the experimental framework, including their original source sizes, numbers of experimental samples used, and training-validation-test partitioning. The experimental samples were first divided into an 80% initial development partition and a 20% independent test set. The development partition was subsequently divided into 90% final training samples and 10% validation samples, corresponding to an overall allocation of 72% training, 8% validation, and 20% testing. The original source size of CraftMotifDB was not specified in the source. Please click here to download this file.
After confirming the dataset versions and annotation formats, the Motif-Sikka, OS-CTPIG, and CraftMotifDB datasets were integrated to create the multimodal dataset. The three datasets were combined into a single multimodal experimental database once the annotation formats and dataset versions were verified. This study distinguishes between the experimental sample counts and the actual source datasets. After preprocessing, label harmonization, and duplicate removal, the retained samples were first divided into development and independent test subsets using an 80:20 split. The development subset was then divided into final training and validation subsets using a 90:10 split. For Motif-Sikka, 4,000 samples were assigned to development, with 3,600 used for final training and 400 for validation, while 1,000 samples were retained for independent testing. For OS-CTPIG, 6,400 samples were assigned to development, with 5,760 used for final training and 640 for validation, while 1,600 samples were retained for independent testing. For CraftMotifDB, 3,600 samples were assigned to development, with 3,240 used for final training and 360 for validation, while 900 samples were retained for independent testing. Data augmentation was subsequently applied only to the final training subsets, resulting in 5,000 augmented training instances for Motif-Sikka and 8,000 augmented training instances for OS-CTPIG. The CraftMotifDB experimental dataset comprised 4,500 samples. The original Motif-Sikka source contained 432 images, whereas the OS-CTPIG source contained more than 3,000 images. The original CraftMotifDB source does not report a fixed total source-image/record count. The 5,000 Motif-Sikka and 8,000 OS-CTPIG counts represent the augmented training instances used in the experiments and should not be interpreted as the original source-dataset sizes. The 4,500 CraftMotifDB samples represent the experimental dataset used in this study. Each experimental sample comprised an image and the available semantic metadata, including motif type, cultural origin, artistic technique, symbolic meaning, and associated annotations. To unify the disparate annotations from Motif-Sikka, OS-CTPIG, and CraftMotifDB, a unified annotation format was created. Motif type, creative technique, cultural origin or location, symbolic significance, period when accessible, and descriptive qualities were among the harmonized fields. Initially, the corresponding common field names were mapped to dataset-specific field names. After that, label strings were standardized for spelling, punctuation, whitespace, and case. Rather than relying solely on visual similarity, labels representing the same semantic concept were mapped to a common category using the meanings provided in the original dataset annotations. Synonyms and comparable terms unique to the dataset were grouped together under the relevant common category. A value was kept as missing and not inferred when a dataset lacked a specific attribute. Free-text descriptive information and symbolic meanings were kept as semantic descriptions and formatted consistently without changing their original meaning. To ensure reproducibility, Supplementary Table 1 contains the full source-label-to-common-category mapping.
Metadata quality was assessed by checking the consistency of motif labels and associated cultural characteristics, including cultural origin, artistic technique, symbolic meaning, and descriptive information. Image-level similarity analysis and metadata verification were used to find possible duplicate samples. The accompanying metadata, such as motif type, cultural origin, artistic technique, and symbolic meaning, were compared to candidate pairs with extremely comparable visual content. Only when the visual content and related information showed that the records represented the same underlying motif instance was a sample eliminated as a duplicate. The experimental record does not provide the precise image-similarity metric and numerical threshold employed in the initial dataset-cleaning procedure. Images that could not be loaded or processed as valid RGB images were considered corrupted and excluded. Samples were also excluded when one or more required metadata fields, including motif type, cultural origin, artistic technique, or symbolic meaning, were missing.
Following preprocessing, label harmonization, and duplicate removal, the integrated dataset was divided into an 80:20 development-to-test split. The development subset was subsequently divided into 90% final training and 10% validation subsets. Accordingly, of the 4,000 samples in the Motif-Sikka development subset, 3,600 were used for final training and 400 for validation. Of the 6,400 samples in the OS-CTPIG development subset, 5,760 were used for final training and 640 for validation. Of the 3,600 samples in the CraftMotifDB development subset, 3,240 were used for final training and 360 for validation. The corresponding independent test subsets contained 1,000, 1,600, and 900 samples, respectively. The validation subset was used only for hyperparameter tuning, training monitoring, and final model-checkpoint selection, whereas the independent test subset was kept separate throughout model development and used only for final performance evaluation. Data augmentation was applied only to the final training subsets; the validation and independent test subsets were not augmented. The dataset composition, source sizes, experimental sample counts, and reported training-validation-test allocations are summarized in Tables 1 and 4. The source datasets contained multiple traditional cultural motif categories. For binary evaluation, the target motif category defined in the corresponding dataset annotation was designated as Label 1 (positive class), whereas all remaining motif categories were grouped as Label 0 (negative class). This binary mapping was applied consistently to the held-out test data for calculation of accuracy, precision, recall, F1-score, and the corresponding confusion matrices. The original multiclass annotations were retained during dataset preparation and were not treated as inherently binary.
Preprocessing
The preprocessing procedure ensures consistency, robustness, and scalability of the input data from the three Motif-Sikka, OS-CTPIG, and CraftMotifDB datasets for subsequent stages of learning. Initially, all input images are resized to a uniform size of 224 × 224 pixels in accordance with the input requirements of EfficientNet-Lite. Pixel values are normalized to the range [0,1], as mathematically defined in Equation S1 (Supplementary File 1). Normalization ensures consistency across the input data. In addition, all images are standardized to the RGB color space. To improve image quality, noise reduction and image enhancement methods are applied. A Gaussian filter is used to reduce image noise, as mathematically defined in Equation S2 (Supplementary File 1). During Gaussian filtering, border pixels were handled using replicated-border padding, in which the values of the nearest edge pixels were extended to the image boundary. This approach maintained the spatial dimensions of the input images while minimizing boundary artifacts. Contrast enhancement through histogram equalization was then applied, as mathematically defined in Equation S3 (Supplementary File 1). Histogram equalization was performed independently on the red, green, and blue (RGB) channels of each image to redistribute pixel intensities and improve contrast. The enhanced channels were subsequently recombined to form the RGB image used for feature extraction. Contrast enhancement through histogram equalization facilitates recognition of fine motifs and their semantic features. Finally, data augmentation and semantic alignment are performed through a series of transformations, as mathematically defined in Equation S4 (Supplementary File 1). The transformations include rotation, flipping, scaling, and translation. At the same time, metadata extracted from CraftMotifDB and Motif-Sikka are normalized and transformed into a format appropriate for knowledge graph construction. Metadata fields from Motif-Sikka, OS-CTPIG, and CraftMotifDB were standardized to maintain consistency across the datasets, including motif category, cultural origin, artistic technique, symbolic meaning, and other available descriptive attributes. The resulting visual representations were associated with their corresponding semantic descriptors and used for subsequent knowledge graph construction and multimodal analysis. The visual representations are associated with semantic descriptors such as motif class, geographical location, and metaphorical meanings. This preprocessing stage prepares the image and textual data for subsequent analysis.
All input images are resized to 224 × 224 pixels using bilinear interpolation and then provided as input to EfficientNet-Lite. Pixel intensity values are normalized to the interval [0,1], and all images are uniformly transformed into the RGB color space. For noise reduction, a Gaussian filter with a kernel size of 5 × 5 and a standard deviation of 1.0 is applied, followed by global histogram equalization to increase contrast and improve the visibility of fine motifs. Data augmentation is performed only on the training dataset to prevent data leakage during evaluation. Random horizontal flipping was applied with a probability of 0.5. Random rotation within ±15°, random scaling within the range of 0.9–1.1, and random translation of up to 10% of the image dimensions were each applied with a probability of 0.5. Bilinear interpolation was used for geometric transformations, and nearest-neighbor filling was used for pixels introduced outside the original image boundaries. The augmentation settings were kept identical across all experimental runs. No augmentation was applied to the validation or test datasets. The augmentation settings were kept consistent throughout the experiments. The validation and test datasets were not augmented.
The data preprocessing flowchart in Figure 2 illustrates the process of transforming the three datasets into an input format suitable for subsequent intelligent reasoning. Raw images from the three datasets enter the preprocessing pipeline with variations in resolution, color, noise, annotations, and other characteristics. Resizing standardizes the image dimensions to 224 × 224 pixels for input into the deep learning algorithm. Color normalization then scales pixel values consistently across the datasets, reducing variations associated with different image conditions. Noise reduction using Gaussian filtering removes image noise. Contrast enhancement using histogram equalization improves the visibility of complex structures. Finally, data augmentation is performed using rotation, flipping, scaling, and translation. In parallel, annotation standardization is performed to unify motif metadata, including type, region, symbolic meaning, technique, and era. Lastly, the preprocessed images and standardized metadata form the normalized dataset used for subsequent operations, including feature extraction, semantic mapping, and knowledge graph reasoning. Figure 2 summarizes each stage of the image preprocessing procedure.
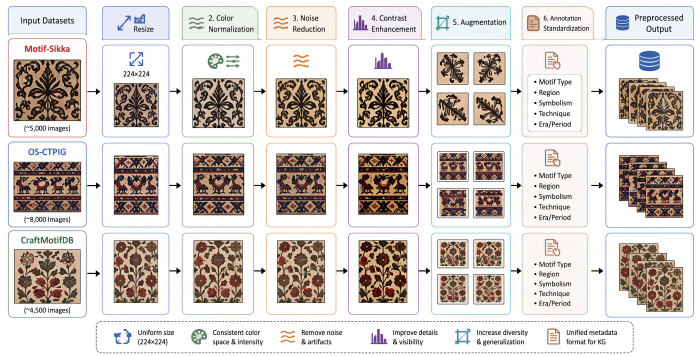
Figure 2. Preprocessing workflow for the traditional cultural pattern datasets. Images from the Motif-Sikka, OS-CTPIG, and CraftMotifDB datasets undergo resizing to 224 × 224 pixels, color normalization, noise reduction, contrast enhancement, and data augmentation. Associated annotations are standardized according to motif type, region, symbolism, technique, and era/period. The resulting preprocessed images and standardized metadata provide the inputs for subsequent feature extraction and knowledge graph (KG) construction. Please click here to view a larger version of this figure.
Feature Extraction Using EfficientNet-Lite
The normalized and enhanced images generated from the Motif-Sikka, OS-CTPIG, and CraftMotifDB datasets are then fed into the EfficientNet-Lite model for feature extraction. The model was selected because of its lightweight architecture and computational efficiency. For an input image of 224 × 224 × 3 pixels, the EfficientNet-Lite model applies several convolutional layers, depthwise separable convolutions, and compound scaling to generate hierarchical feature representations. The network employs Mobile Inverted Bottleneck Convolution (MBConv) blocks to enhance efficiency while preserving spatial and channel information. The implemented model used the Rectified Linear Unit (ReLU) activation function in the convolutional and subsequent neural network layers. Such a configuration enables the network to recognize fine motif details, including curves, edges, and repetitive elements found in traditional patterns. For Motif-Sikka, OS-CTPIG, and CraftMotifDB, the extracted features represent varying degrees of abstraction: Motif-Sikka focuses on motif patterns, whereas OS-CTPIG provides extensive coverage of repetitive and geometric shapes. Additionally, CraftMotifDB contributes culturally relevant textures to the feature representation. Finally, these features are distilled into fixed-length embedding vectors using global average pooling. The mathematical formulations for EfficientNet-Lite feature extraction, the MBConv operation, and global average pooling are provided in Equations S5–S7 (Supplementary File 1).
This operation results in a fixed-length feature vector that can subsequently be used for semantic mapping and incorporation into the knowledge graph. The selected feature vectors from the three data sources are subsequently combined or projected into a common feature space, enabling multimodal learning. In this way, visual information can be integrated with cultural information. This provides the input for the subsequent semantic reasoning and retrieval-augmented generation stages using GNNs. Figure 3 shows the structure of feature extraction using EfficientNet-Lite. Figure 3 illustrates the structural workflow of the EfficientNet-Lite architecture for extracting visual features from Motif-Sikka, OS-CTPIG, and CraftMotifDB. After preprocessing, images from the three datasets are standardized to a fixed shape of 224 × 224 × 3 pixels and provided as inputs to the network. The 3 × 3 stem convolution layer detects low-level features, including edges and shapes. This is followed by MBConv blocks with 3 × 3 and 5 × 5 kernels. These layers support hierarchical representation learning of local and complex structures. The deeper MBConv layers learn abstract features, including repetitive geometric patterns from OS-CTPIG motifs, symmetrically structured motifs from Motif-Sikka, and textures from CraftMotifDB. Moreover, the squeeze-and-excitation (SE) block enhances important feature channels. Shortcut connections between layers facilitate the preservation of spatial information and improve gradient propagation to support stable and effective training. After the convolutional operations, the high-dimensional feature map is reduced through global average pooling to produce a fixed-length visual feature vector. The visual representation is then projected to 128 dimensions and concatenated with the corresponding 128-dimensional semantic and cultural representations to form a 384-dimensional multimodal feature vector. This vector is subsequently passed through a fully connected fusion layer to obtain the final 256-dimensional fused representation. This representation is used in subsequent stages, including semantic mapping, knowledge graph reasoning, and retrieval-augmented design generation. Overall, Figure 3 demonstrates the transformation of preprocessed data into meaningful feature representations using EfficientNet-Lite.
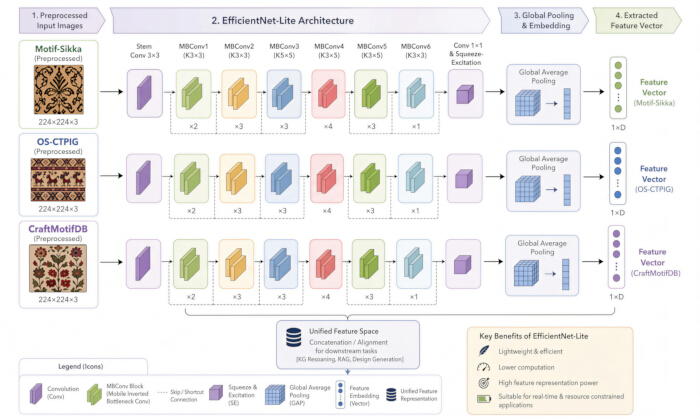
Figure 3. EfficientNet-Lite0 architecture for visual feature extraction. Preprocessed 224 × 224 × 3 images from the Motif-Sikka, OS-CTPIG, and CraftMotifDB datasets are processed through the implemented EfficientNet-Lite0 architecture, comprising the stem convolution, MBConv stages, final convolution, and global average pooling. The resulting visual features are projected to 128 dimensions. The 128-dimensional visual representation is subsequently concatenated with the corresponding 128-dimensional semantic and 128-dimensional cultural representations to form a 384-dimensional multimodal feature vector. This concatenated representation is passed through a fully connected fusion layer to obtain the final 256-dimensional fused representation used for downstream retrieval-augmented generation and design assistance. Please click here to view a larger version of this figure.
Table 2 describes the extraction of visual features from Motif-Sikka, OS-CTPIG, and CraftMotifDB after preprocessing and application of EfficientNet-Lite. Each dataset contains preprocessed input images that have been normalized and enhanced to improve consistency. These images are converted into feature maps representing activation patterns from the convolutional operations. The Motif-Sikka feature maps represent edge and symmetric structure detection associated with its repetitive motifs. The OS-CTPIG feature maps represent texture and geometric repetition associated with large pattern designs. Finally, the CraftMotifDB feature maps represent texture and semantic characteristics associated with culturally rich images. The outputs from these feature maps are compressed into numerical feature vectors using global average pooling, whereby each feature vector (e.g., [0.21, 0.87, 0.65, …]) indicates the strength of features learned from different channels. These numerical values encode visual characteristics, including shapes, textures, and structures. The final column of Table 2 presents the major features represented by each dataset: symmetry and structured motifs for Motif-Sikka; geometric repetition and homogeneous texture for OS-CTPIG; and culturally rich semantic characteristics for CraftMotifDB.
| Dataset | Input Image (Preprocessed) | Feature Map Representation | Feature Vector (Sample Values) | Key Characteristics |
| Motif-Sikka | Normalized motif image | Edge and symmetry maps | [0.21, 0.87, 0.65, …] | Structured motifs, symmetry |
| OS-CTPIG | Enhanced pattern image | Texture and repetition maps | [0.45, 0.32, 0.91, …] | Geometric repetition |
| CraftMotifDB | Augmented cultural image | Texture and semantic maps | [0.78, 0.56, 0.34, …] | Cultural texture richness |
Table 2: Representative visual features extracted from the three traditional cultural pattern datasets. The table summarizes the preprocessed input image type, feature map representation, representative feature-vector values, and key visual characteristics for the Motif-Sikka, OS-CTPIG, and CraftMotifDB datasets using EfficientNet-Lite.
Knowledge Graph Construction
The constructed cultural knowledge graph includes semantic nodes representing motifs, regions, symbolic meanings, artistic techniques, dataset identifiers, and cultural attributes. The relationships between these nodes include hasType, belongsToRegion, usesTechnique, hasSymbolism, existsInDataset, and similarTo. Each sample is represented as a head-relation-tail triplet in RDF format according to the graph-construction rules. Entity and relation representations are initialized using the TransE embedding model so that semantically related entities can be represented in a common embedding space. Following feature extraction using EfficientNet-Lite, the knowledge graph captures semantic and cultural relationships associated with the traditional patterns in Motif-Sikka, OS-CTPIG, and CraftMotifDB. Information including motif type, pattern characteristics, and associated cultural information is represented as entity-relation triplets. The cultural knowledge graph included semantic relationships such as hasType, belongsToRegion, usesTechnique, hasSymbolism, existsInDataset, and similarTo. The visual feature vectors obtained using EfficientNet-Lite were embedded in the same semantic space as the knowledge graph nodes. TransE was used to represent relationships among head entities, relations, and tail entities and to learn semantic embeddings for the graph entities. During TransE training, valid RDF head–relation–tail triplets were used as positive samples, whereas negative triplets were generated by replacing an entity in a valid triplet with another entity from the knowledge graph entity set. The positive and negative triplets were then used to optimize the TransE embedding objective, encouraging valid semantic relationships to have lower translational distances than corrupted relationships. Visual feature embeddings were subsequently aligned with the knowledge graph nodes using cosine similarity. For each visual feature vector, cosine similarity was calculated against the available knowledge graph node embeddings, and the node with the highest cosine similarity score was selected as the corresponding semantic node. This nearest-node selection established the semantic association between the visual representation and the cultural knowledge graph. The mathematical definitions of the knowledge graph, entity and relation embeddings, TransE representation and loss, and cosine-similarity alignment are provided in Equations S8–S12 (Supplementary File 1).
The most appropriate nodes are then identified, and contextual information is extracted using neighboring links within the graph. This enables reasoning tasks related to symbolic meaning, origin, and pattern relationships. Ultimately, the resulting knowledge graph serves as a semantic basis for GNN reasoning and intelligent design generation in the proposed system. Figure 4 shows the construction and visualization of the cultural knowledge graph. The figure depicts the complete knowledge graph construction process, including node formation, semantic relationship construction, and graph integration. Six semantic relationships—hasType, belongsToRegion, usesTechnique, hasSymbolism, existsInDataset, and similarTo—connect motif nodes, attribute nodes, and dataset nodes to create a unified cultural knowledge graph that supports multimodal fusion, GNN-based semantic reasoning, and retrieval-augmented generation for intelligent traditional pattern understanding and design support.
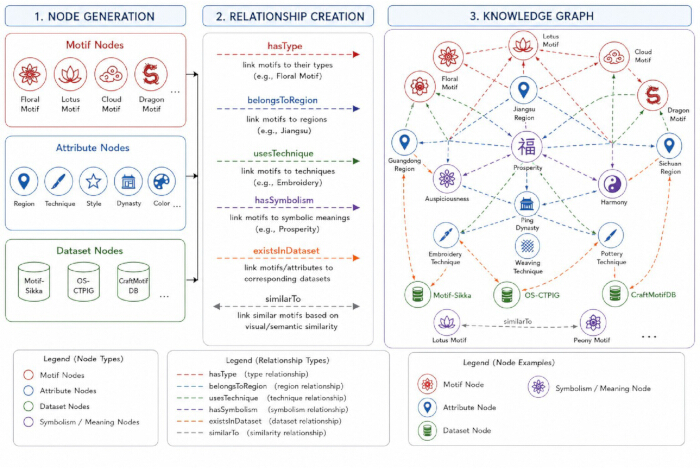
Figure 4. Construction of the cultural knowledge graph. The workflow illustrates node generation, relationship creation, and integration into the cultural knowledge graph (KG). Motif, attribute, dataset, and symbolism/meaning nodes are connected using six relationship types: hasType, belongsToRegion, usesTechnique, hasSymbolism, existsInDataset, and similarTo. These relationships represent associations among traditional motifs, regions, artistic techniques, symbolic meanings, and source datasets. The resulting KG provides the structured semantic representation used for subsequent graph neural network (GNN)-based reasoning and retrieval-augmented generation (RAG). Please click here to view a larger version of this figure.
Semantic Mapping Using GNN
After building the knowledge graph, the second process is semantic mapping, through which the visual features from EfficientNet-Lite are mapped to nodes of the knowledge graph using a GNN. Semantic mapping bridges the visual information and semantic information associated with motifs, regions, symbols, and cultures. The knowledge graph nodes, including motif, region, symbol, and culture nodes, are represented using initial embedding vectors, whereas the extracted visual feature vectors from Motif-Sikka, OS-CTPIG, and CraftMotifDB are embedded in the same embedding space.
Semantic reasoning was performed using a two-layer Graph Attention Network (GAT) with a hidden representation size of 128 and a ReLU activation function. The GAT learned node embeddings through attention-based neighborhood message passing, in which attention coefficients assigned different weights to neighboring nodes according to their relevance to the target node. The resulting node representations were projected into the semantic embedding space and used for visual–semantic alignment and downstream reasoning. The model was optimized using the Adam optimizer with an initial learning rate of 0.001. The optimization process minimized a combined loss function comprising classification, semantic alignment, and retrieval-generation losses. The GAT architecture and its attention-based message-passing formulation are provided in Supplementary File 1.
The GNN propagates information through the graph topology such that each node aggregates information from neighboring nodes. This procedure facilitates the capture of contextual dependencies, such as symbolic meaning, geographical relationships, and cultural relationships. When a motif is identified in an image, it can acquire semantic information from neighboring nodes, such as region or technique, through the message-passing process. This recursive procedure enhances the node representation and makes it semantically meaningful.
Semantic mapping using the GNN improves the interpretability and reasoning capabilities of the proposed approach. Visual-feature and graph embeddings support similarity matching, classification, and inference tasks, including identifying the culture associated with a pattern, predicting its symbolic meaning, and generating design recommendations. During training, the corresponding ground-truth semantic node for each image was assigned using its standardized metadata, including motif type, cultural origin, artistic technique, and symbolic meaning. During semantic mapping, cosine similarity was calculated between the projected visual feature embedding and the candidate knowledge graph node embeddings, and the node with the highest cosine similarity score was selected as the corresponding semantic node. Thus, node selection was based on a ranking criterion rather than a predefined similarity threshold. The selected node was subsequently used for semantic alignment and downstream GNN-based reasoning. The mathematical formulations for GNN message passing, visual-feature projection, cosine-similarity mapping, and semantic alignment loss are provided in Equations S13–S16 (Supplementary File 1).
Multimodal Fusion
After semantic mapping using the GNN, the proposed framework uses multimodal fusion to combine three information sources into a unified representation: (i) visual features acquired using EfficientNet-Lite, (ii) semantic embeddings generated using the knowledge graph and GNN, and (iii) cultural metadata from Motif-Sikka, OS-CTPIG, and CraftMotifDB. Each modality is transformed into a common latent space through learned linear transformations before fusion. The visual feature vector obtained from EfficientNet-Lite was 128-dimensional, whereas the semantic embedding obtained from the GNN and the cultural metadata embedding were each projected into 128-dimensional feature vectors using fully connected linear projection layers. The three 128-dimensional representations are then concatenated to form a 384-dimensional multimodal feature vector. This concatenated representation is subsequently passed through a fully connected fusion layer to produce a 256-dimensional fused embedding, followed by a ReLU activation function. The resulting fused representation is supplied to the RAG module for subsequent retrieval and generation. No attention-based multimodal fusion is used in the implemented framework. The mathematical formulation of modality projection and concatenation-based multimodal fusion is provided in Equations S17 and S18 (Supplementary File 1).
Retrieval-Augmented Generation (RAG) and Design Assistance Module
After multimodal fusion, the RAG-based approach is used to create context-sensitive and culturally meaningful design outputs. The proposed RAG module consists of a retrieval module and a generation module. The retrieval module uses the semantic embeddings produced by the GNN to query the integrated multimodal dataset and the constructed cultural knowledge graph. The top five most relevant entities are obtained by calculating cosine similarity between the query embedding and the indexed knowledge representations. The generator receives contextual information from the retrieved semantic descriptions, including motif category, symbolic meaning, cultural origin, and artistic technique. The generation module produces design recommendations and semantic explanations by combining the retrieved information with the visual information extracted using EfficientNet-Lite.
The retrieval corpus includes the combined Motif-Sikka, OS-CTPIG, and CraftMotifDB dataset together with the constructed cultural knowledge graph. Visual features extracted using EfficientNet-Lite and semantic embeddings generated using the GNN are indexed for semantic retrieval. During inference, the combined multimodal representation is used as the query, and cosine similarity is calculated between the query embedding and the indexed knowledge representations. The top five (k = 5) cultural entities or pattern descriptions with the highest cosine-similarity scores are retrieved. The retrieved results are subsequently subjected to domain-specific filtering to remove duplicate entries and semantically inconsistent results. Semantic consistency is assessed using relationships represented in the knowledge graph, with consideration of motif type, region, and symbolic relationships. The remaining retrieved information is provided to the generation module together with the input motif description and the user's design objective. Using this contextual information, the generator produces four outputs: (i) a generated cultural pattern design, (ii) a semantic explanation of the generated design, (iii) cultural design suggestions, and (iv) retrieved cultural knowledge.
In this step, the combined representation serves as a query to retrieve the top-k relevant pattern motifs and knowledge in the form of pattern descriptions. In the implemented procedure, k = 5. Relevant pattern motifs and descriptions are retrieved using cosine similarity to select semantically appropriate information. Prior to generation, retrieved results that are redundant or semantically inconsistent based on motif type, region, and symbolic relationships are removed. The mathematical formulations for retrieval probability and conditional generation are provided in Equations S19 and S20 (Supplementary File 1), respectively. Meta AI Llama-3.1-8B-Instruct is used as the language model in the generation module. The model receives the input motif description, retrieved cultural knowledge, and the user's design objective as contextual information and generates culturally informed design recommendations and semantic explanations. The top five retrieved results, selected based on cosine similarity, are provided to the generator. The precise model checkpoint and generation parameters used in the experiments are provided in the Table of Materials and corresponding implementation settings.
Building on this generation step, the proposed Design Assistance Module provides interactive and interpretable outputs to the end user. It provides recommendations for design alternatives, indicates essential semantic features, including motif type and culture, and allows users to adjust the design according to their preferences. Furthermore, the module improves interpretability by tracing generated outputs to knowledge graph entities.
An example of the complete design assistance workflow illustrates the operation of the proposed RAG framework. Based on an input image of a traditional Sikka weaving motif, the retrieval module retrieves semantically relevant information from the cultural knowledge graph. This information includes the motif type (Geometric Spiral), cultural origin (East Nusa Tenggara), symbolic meaning (prosperity and community harmony), and artistic technique (Ikat weaving). The generation module receives this retrieved contextual information and uses it to create a modern textile pattern incorporating contemporary geometric arrangements while maintaining the original spiral motif. The framework also provides a semantic explanation indicating how the new pattern preserves the cultural meaning of prosperity and communal harmony while modifying its visual composition for modern textile applications. Based on the generated output and retrieved knowledge, the framework also provides a design recommendation suggesting application of the generated motif to items such as scarves, wall textiles, and ornamental fabrics while maintaining its original cultural and symbolic context.
Model Training and Optimization
The proposed multimodal framework learns its parameters in an end-to-end manner to capture visual, semantic, and multimodal representations for intelligent pattern generation. First, the EfficientNet-Lite model is fine-tuned using the preprocessed images from the Motif-Sikka, OS-CTPIG, and CraftMotifDB datasets to capture discriminative visual representations. In parallel, the GNN is trained on the constructed knowledge graph to capture semantic representations through information propagation between connected nodes. Subsequently, the multimodal fusion module and RAG framework are trained together to capture visual, semantic, and contextual representations by minimizing a combination of classification, semantic alignment, and generation losses.
The total optimization objective combines the classification, semantic alignment, and generation losses with respective weights of 1.0, 0.8, and 0.6. The classification loss optimizes the motif-classification objective, the semantic alignment loss encourages consistency between the visual and knowledge-graph representations, and the generation loss optimizes the retrieval-augmented generation component. The mathematical formulation of the total optimization objective is provided in Equation S21 (Supplementary File 1). Training is performed using the Adam optimizer with backpropagation across the trainable components. The hyperparameter details are provided in Table 3.
| Component | Hyperparameter | Value Used | Description |
| EfficientNet-Lite | Input Image Size | 224 × 224 | Input image resolution used for feature extraction |
| EfficientNet-Lite | Batch Size | 32 | Number of samples processed in each training batch |
| EfficientNet-Lite | Learning Rate | 0.001 | Initial learning rate used for model optimization |
| EfficientNet-Lite | Optimizer | Adam | Optimization algorithm used during training |
| GAT | Number of Layers | 2 | Number of graph attention layers used for graph-based feature learning |
| GAT | Hidden Dimension | 128 | Dimension of the learned node embedding |
| GAT | Activation Function | ReLU | Nonlinear activation function applied in the GAT layers |
| Multimodal Fusion | Fusion Dimension | 256 | Dimension of the fused multimodal feature representation |
| RAG Module | Top-k Retrieval | 5 | Number of contextual entities or pattern descriptions retrieved for generation |
| RAG Module | Similarity Metric | Cosine similarity | Similarity measure used for semantic retrieval |
| Training | Number of Epochs | 50 | Total number of training epochs |
| Training | Dropout Rate | 0.3 | Dropout probability used for regularization |
| Training | Classification Loss | Cross-Entropy Loss | Loss function used for the motif classification objective |
| Training | Semantic Alignment Loss | Squared Euclidean (L2) Alignment Loss | Loss function used to align visual and knowledge-graph semantic representations |
| Training | Generation Loss | Token-Level Cross-Entropy (Mean Negative Log-Likelihood) | Mean token-level negative log-likelihood used to optimize conditional generation of the reference output given the fused multimodal representation and the top five retrieved contextual results |
| Training | Loss Weights (λ) | (1.0, 0.8, 0.6) | Weights assigned to the classification, semantic alignment, and generation losses, respectively |
Table 3: Hyperparameters and training configuration of the proposed framework. The table summarizes the principal hyperparameters and optimization settings used for EfficientNet-Lite visual feature extraction, Graph Attention Network (GAT)-based semantic representation learning, multimodal feature fusion, retrieval-augmented generation (RAG), and model training. The overall training objective combines classification, semantic alignment, and generation losses with respective weights of 1.0, 0.8, and 0.6. The generation objective is optimized using token-level cross-entropy, expressed as the mean negative log-likelihood of the reference output conditioned on the fused multimodal representation and the top five retrieved contextual results.
The proposed model was optimized using the Adam optimizer with an initial learning rate of 0.001 and a batch size of 32, according to the hyperparameter configuration provided in Table 3. The model was trained for 50 epochs, and the model with the lowest validation loss was selected for the final performance analysis.
The total optimization function comprised classification, semantic alignment, and generation losses, with respective weights of , , and . The model with the minimum validation loss during training was selected as the final checkpoint for testing. Checkpoint selection was performed independently for each of the five experimental runs using only the validation subset corresponding to that run. The selected checkpoint from each run was subsequently evaluated on the held-out test dataset, and the resulting performance measures were used for the five-run evaluation.
For robustness assessment, the experiments were conducted five times under identical training settings, and model parameters were independently initialized for each run. No single fixed random seed was used consistently across all five runs. Performance measures were summarized as the mean ± standard deviation across the five runs. Neither a learning-rate scheduler nor an early-stopping strategy was applied during optimization. The model was trained for the predefined number of epochs using the fixed learning rate specified in Table 3.
The confusion matrices were generated using a binary decision protocol. For each binary evaluation, the predefined target motif category was assigned to Class 1 (positive), whereas all remaining motif categories were grouped into Class 0 (negative). Thus, the original multiclass annotations were retained during dataset preparation, with binary mapping applied specifically for the confusion-matrix analysis. The same positive/negative mapping rule was applied to the held-out test samples used for each reported confusion matrix. Accordingly, the confusion matrices summarize the binary classification outcomes used to calculate accuracy, precision, recall, F1-score, and related evaluation metrics.
Results
The experimental assessment of the proposed semantic understanding and intelligent design assistance framework examined its performance in integrating visual, semantic, and cultural information for traditional pattern analysis. The overall architecture used for this assessment is presented in Figure 1, which shows the progression from preprocessing and EfficientNet-Lite-based feature extraction through knowledge graph construction, GNN-based semantic reasoning, multimodal fusion, and RAG-based retrieval and generation. The resulting framework produces generated pattern designs, semantic explanations, design recommendations, and retrieved similar patterns using information derived from Motif-Sikka, OS-CTPIG, and CraftMotifDB. The proposed framework achieved classification accuracies within approximately 96%–98% across the evaluated datasets and was also assessed in terms of classification performance, generation quality, computational efficiency, semantic retrieval, training behavior, and component-level contributions.
The performance evaluation used Motif-Sikka, OS-CTPIG, and CraftMotifDB, which together provide traditional motif images and associated semantic or cultural information. The preprocessing workflow applied to these datasets is summarized in Figure 2. Images underwent resizing to 224 × 224 pixels, color normalization, noise reduction, contrast enhancement, and data augmentation, while associated annotations were standardized according to motif type, region, symbolism, technique, and era or period. The resulting preprocessed images and standardized metadata were subsequently used for feature extraction and knowledge graph construction.
Table 1 summarizes the dataset composition and the distribution of samples used for development and independent testing. Following preprocessing and duplicate removal, Motif-Sikka comprised 4,000 development samples and 1,000 independent test samples, OS-CTPIG comprised 6,400 development samples and 1,600 independent test samples, and CraftMotifDB comprised 3,600 development samples and 900 independent test samples. The development subsets were subsequently divided into final training and validation subsets using a 90:10 split. The final training subsets were then augmented, resulting in 5,000 augmented training instances for Motif-Sikka and 8,000 augmented training instances for OS-CTPIG. The validation and independent test subsets were not augmented.
Following preprocessing, visual features were extracted using EfficientNet-Lite. Figure 3 presents the feature-extraction workflow, in which the standardized 224 × 224 × 3 images are processed through the EfficientNet-Lite architecture and converted through convolutional operations and global average pooling into fixed-length feature vectors. These feature representations provide the visual component subsequently used for semantic mapping and multimodal integration.
Representative outputs of this feature-extraction process are summarized in Table 2. The Motif-Sikka feature representation emphasizes edge and symmetry information, the OS-CTPIG representation emphasizes texture and geometric repetition, and the CraftMotifDB representation includes texture and semantic characteristics. The feature maps were compressed through global average pooling into numerical feature vectors that represent learned visual characteristics such as shapes, textures, and structures.
The semantic information associated with the extracted visual representations was organized through the cultural knowledge graph shown in Figure 4. Motif, attribute, dataset, and symbolism or meaning nodes are connected through the reported relationships hasType, belongsToRegion, usesTechnique, hasSymbolism, existsInDataset, and similarTo. The resulting graph provides the structured semantic representation used for subsequent GNN-based reasoning and retrieval.
The principal model and training hyperparameters are summarized in Table 3. EfficientNet-Lite used an input image size of 224 × 224 pixels, a batch size of 32, an initial learning rate of 0.001, and the Adam optimizer. The GAT contained two layers, a hidden dimension of 128, and a ReLU activation function The multimodal fusion representation had a dimension of 256, while the RAG module retrieved the top five relevant entities or documents using cosine similarity. Training was conducted for 50 epochs with a dropout rate of 0.3. The multi-objective loss used weights of 1.0, 0.8, and 0.6 for the classification, semantic alignment, and generation loss components, respectively.
The reported dataset evaluation split is presented in Table 4. The evaluation procedure used an 80:20 development-to-independent-test split, with a validation subset separated from the training data for hyperparameter tuning and checkpoint selection.
| Dataset | Original Source Images/Records | Data Splitting Procedure | Final Experimental Training Samples | Independent Test Data | Data Type |
| Motif-Sikka | 432 | After cleaning and duplicate removal, the source images were first divided into development and independent held-out test subsets. The development subset was subsequently divided into training and validation subsets before augmentation. | 5,000 augmented training instances | Non-augmented held-out images | Image + metadata |
| OS-CTPIG | >3,000 | After cleaning and duplicate removal, the source images were first divided into development and independent held-out test subsets. The development subset was subsequently divided into training and validation subsets before augmentation. | 8,000 augmented training instances | Non-augmented held-out images | Image |
| CraftMotifDB | Not specified in the source | After cleaning and duplicate removal, the data were partitioned into training, validation, and independent held-out test subsets. | 4,500 experimental samples | Non-augmented held-out data | Image + text metadata |
Table 4: Dataset preparation and experimental sample composition. The table summarizes the original source sizes, data-partitioning procedures, final experimental samples, and independent test data used for the three datasets. For Motif-Sikka and OS-CTPIG, augmentation was performed only after the source data had been divided into development and independent held-out test subsets and the development subset had been further divided into training and validation subsets. The resulting augmented training sets contained 5,000 Motif-Sikka and 8,000 OS-CTPIG instances, while the validation and test subsets remained non-augmented. For CraftMotifDB, 4,500 experimental samples were used in this study; this value represents the experimental dataset and should not be interpreted as the original size of the source database, which was not specified in the source.
The computational environment used for model implementation and evaluation is summarized in Table 5. The reported environment includes the processor, GPU, RAM, operating system, programming environment, software frameworks, supporting libraries, graph-processing environment, and training time. These computational conditions provide the context for the reported training and inference results.
| Component | Specification |
| Processor | Intel Core i9-14900K |
| GPU | NVIDIA GeForce RTX 3080, 10 GB VRAM |
| RAM | 32 GB DDR4 |
| Operating System | Windows 11 Pro (64-bit) |
| Programming Language | Python 3.11 |
| Deep Learning Framework | PyTorch 2.5.1 |
| Graph Processing | PyTorch Geometric 2.6.0 |
| Image Processing Library | OpenCV 4.10 |
| Machine Learning Library | Scikit-learn 1.6 |
| Numerical Computing Library | NumPy 2.0 |
| Vector Database | FAISS 1.8 |
| Training Time | 19 min per complete training run (50 epochs); five independent runs were conducted, corresponding to approximately 95 min of total training time, excluding setup and evaluation |
Table 5: Computational environment used for model training and evaluation. The table summarizes the hardware, operating system, programming environment, deep learning and graph-processing frameworks, principal computational libraries, vector-indexing environment, and training time used to implement, train, and evaluate the proposed framework. Each complete 50-epoch training run required approximately 19 min under the specified configuration; five independent runs corresponded to approximately 95 min of total training time, excluding setup and evaluation.
Classification performance was evaluated using accuracy, precision, recall, and F1-score. Although the integrated datasets contain multiple motif categories, the final classifier evaluation reformulated the task as a binary semantic classification problem, with samples from the target motif category treated as Label 1 and all remaining motif categories treated as Label 0.
The classification accuracy comparison is presented in Table 6. VGG16 achieved accuracies of 88.42 ± 1.85%, 86.73 ± 2.10%, and 87.15 ± 1.92% for Motif-Sikka, OS-CTPIG, and CraftMotifDB, respectively. ResNet50 achieved 91.26 ± 1.54%, 89.88 ± 1.76%, and 90.34 ± 1.68%, whereas MobileNetV2 achieved 92.75 ± 1.32%, 91.10 ± 1.45%, and 91.68 ± 1.39% across the same datasets. CNN + Attention achieved accuracies of 94.12 ± 1.18%, 93.45 ± 1.26%, and 93.02 ± 1.21%, while the GNN-based model achieved 95.08 ± 1.05%, 94.62 ± 1.14%, and 94.15 ± 1.09%. The proposed framework achieved the highest reported accuracy among the evaluated methods, reaching 97.82 ± 0.72% for Motif-Sikka, 97.35 ± 0.81% for OS-CTPIG, and 96.94 ± 0.88% for CraftMotifDB. Each experiment was repeated five independent times using the same hyperparameter configuration, and the values reported in Table 6 represent the mean ± standard deviation across these runs. These results show that the proposed framework achieved higher classification accuracy than the evaluated comparison methods under the reported experimental conditions. The corresponding precision, recall, and F1-score comparison is shown in Figure 5. VGG16 achieved a precision of approximately 0.86, recall of 0.85, and F1-score of 0.85. ResNet50 and MobileNetV2 showed higher values, with precision and recall approximately within the range of 0.88–0.91. CNN + Attention and the GNN-based model achieved precision values of approximately 0.93–0.94, recall values of 0.92–0.94, and F1-scores of approximately 0.925–0.94. The proposed framework achieved the highest reported values among the evaluated methods, with a precision of 0.95, recall of 0.96, and F1-score of 0.955. These observations are consistent with the classification accuracy comparison in Table 6.
| Method | Motif-Sikka Accuracy (%) | OS-CTPIG Accuracy (%) | CraftMotifDB Accuracy (%) |
| VGG16 | 88.42 ± 1.85 | 86.73 ± 2.10 | 87.15 ± 1.92 |
| ResNet50 | 91.26 ± 1.54 | 89.88 ± 1.76 | 90.34 ± 1.68 |
| MobileNetV2 | 92.75 ± 1.32 | 91.10 ± 1.45 | 91.68 ± 1.39 |
| CNN + Attention | 94.12 ± 1.18 | 93.45 ± 1.26 | 93.02 ± 1.21 |
| GNN-based Model | 95.08 ± 1.05 | 94.62 ± 1.14 | 94.15 ± 1.09 |
| Proposed Method | 97.82 ± 0.72 | 97.35 ± 0.81 | 96.94 ± 0.88 |
Table 6: Comparison of classification accuracy across methods. Classification accuracy is reported for VGG16, ResNet50, MobileNetV2, convolutional neural network with attention (CNN + Attention), graph neural network (GNN)-based model, and the proposed method on the Motif-Sikka, OS-CTPIG, and CraftMotifDB datasets. Values are reported as mean ± standard deviation (SD) across five experimental runs.
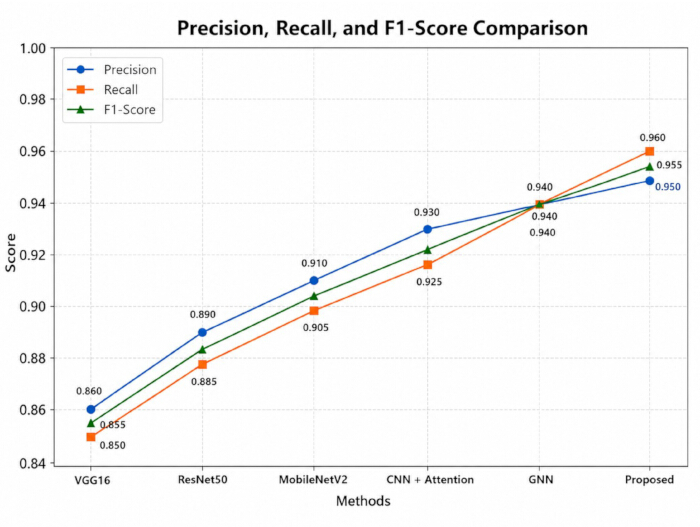
Figure 5. Comparison of precision, recall, and F1-score across classification methods. Precision, recall, and F1-score are compared across VGG16, ResNet50, MobileNetV2, convolutional neural network with attention (CNN + Attention), graph neural network (GNN), and the proposed framework. Higher precision, recall, and F1-score values indicate better classification performance. Please click here to view a larger version of this figure.
The binary classification outcomes for the proposed framework are further presented as confusion matrices in Figure 6A–C. Figure 6A presents the Motif-Sikka evaluation, Figure 6B presents the OS-CTPIG evaluation, and Figure 6C presents the CraftMotifDB evaluation. For Motif-Sikka, Animal Motifs were assigned to Label 1 (positive class); for OS-CTPIG, Floral Motifs were assigned to Label 1 (positive class); and for CraftMotifDB, Symbolic Motifs were assigned to Label 1 (positive class). For each dataset, all remaining motif categories, including floral, geometric, human, symbolic, and other motifs for Motif-Sikka; animal, geometric, auspicious, botanical, and other motifs for OS-CTPIG; and floral, animal, geometric, regional, and decorative motifs for CraftMotifDB, were grouped into Label 0 (negative class). Although the underlying datasets contain multiple motif categories, these confusion matrices summarize the binary evaluation protocol adopted for final performance assessment. The confusion-matrix counts correspond to the finalized held-out test-set samples for the respective datasets.
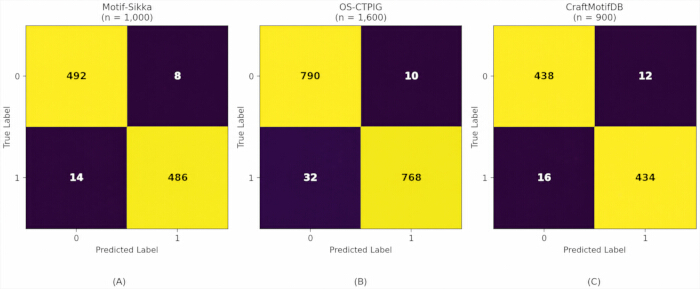
Figure 6. Confusion matrices of the proposed framework across three traditional cultural pattern datasets. Binary confusion matrices show classification performance on (A) Motif-Sikka, (B) OS-CTPIG, and (C) CraftMotifDB. For Motif-Sikka, Animal Motifs were designated as Label 1 (positive class); for OS-CTPIG, Floral Motifs were designated as Label 1 (positive class); and for CraftMotifDB, Symbolic Motifs were designated as Label 1 (positive class). For each dataset, all remaining motif categories were grouped as Label 0 (negative class). Rows represent true labels and columns represent predicted labels. Diagonal cells indicate correctly classified samples, whereas off-diagonal cells indicate misclassified samples. Please click here to view a larger version of this figure.
Generated design quality was evaluated across the Motif-Sikka, OS-CTPIG, and CraftMotifDB datasets, as presented in Table 7. The baseline methods were modified as alternative representation modules while maintaining the same downstream generation and assessment process to ensure a controlled comparison of generation quality. The GNN-based model served as a graph-based semantic representation model, CNN + Attention served as an attention-enhanced visual representation model, and VGG16 and ResNet50 served as substitute visual feature extractors. The same downstream design-generation module that produced the appropriate design outputs received the ensuing representations from each baseline. The suggested approach also included multimodal fusion, RAG-based contextual information, GAT-based semantic reasoning, and EfficientNet-Lite visual characteristics. The identical held-out test samples, along with the matching reference descriptions and reference pattern images, were used for generation for each approach. Every method used the same preprocessing, input samples, output format, generation protocol, and evaluation techniques. While SSIM, FID, and LPIPS were computed utilizing the generated pattern images and their respective reference images, BLEU was computed against the corresponding reference descriptions. As a result, given otherwise controlled generation and evaluation conditions, the differences shown in Table 7 indicate the contribution of the corresponding representation and semantic-reasoning approaches.
The generated outputs from the baseline methods and the proposed framework were evaluated under the same experimental protocol using BLEU, SSIM, FID, and LPIPS. BLEU measures semantic consistency between the generated output and the reference description, SSIM evaluates structural similarity, FID assesses distributional similarity between generated and reference pattern images, and LPIPS measures perceptual similarity based on deep feature representations. VGG16 and ResNet50 achieved BLEU scores ranging from 0.68 to 0.75 and SSIM values ranging from 0.79 to 0.85 across the three datasets. Their FID values ranged from 38.90 to 47.28, while LPIPS values ranged from 0.28 to 0.36. CNN + Attention and the GNN-based model showed higher BLEU and SSIM values and lower FID and LPIPS values, with BLEU reaching 0.83, SSIM reaching 0.90, FID decreasing to 28.60, and LPIPS decreasing to 0.21 on Motif-Sikka. The proposed framework achieved the highest BLEU and SSIM values and the lowest FID and LPIPS values among the methods evaluated in Table 7. BLEU scores were 0.89 for Motif-Sikka, 0.87 for OS-CTPIG, and 0.86 for CraftMotifDB, indicating greater semantic consistency under the reported evaluation procedure. SSIM values were 0.94, 0.93, and 0.92, respectively, indicating greater structural similarity. The proposed framework also achieved FID values of 21.35, 23.80, and 25.65 and LPIPS values of 0.15, 0.17, and 0.18 for Motif-Sikka, OS-CTPIG, and CraftMotifDB, respectively. Thus, under the reported experimental conditions, the proposed framework produced higher semantic and structural similarity and lower distributional and perceptual distances than the evaluated comparison methods. These results are consistent with the intended integration of visual feature extraction, knowledge graph-based semantic reasoning, multimodal fusion, and RAG within the proposed framework.
| Method | Dataset | BLEU ↑ | SSIM ↑ | FID ↓ | LPIPS ↓ |
| VGG16 | Motif-Sikka | 0.71 | 0.82 | 42.35 | 0.31 |
| OS-CTPIG | 0.69 | 0.8 | 45.12 | 0.34 | |
| CraftMotifDB | 0.68 | 0.79 | 47.28 | 0.36 | |
| ResNet50 | Motif-Sikka | 0.75 | 0.85 | 38.9 | 0.28 |
| OS-CTPIG | 0.73 | 0.83 | 41.56 | 0.3 | |
| CraftMotifDB | 0.72 | 0.82 | 43.78 | 0.32 | |
| CNN + Attention | Motif-Sikka | 0.8 | 0.88 | 32.45 | 0.24 |
| OS-CTPIG | 0.78 | 0.86 | 35.22 | 0.26 | |
| CraftMotifDB | 0.77 | 0.85 | 37.9 | 0.28 | |
| GNN-based Model | Motif-Sikka | 0.83 | 0.9 | 28.6 | 0.21 |
| OS-CTPIG | 0.81 | 0.89 | 30.75 | 0.23 | |
| CraftMotifDB | 0.8 | 0.88 | 33.1 | 0.25 | |
| Proposed Method | Motif-Sikka | 0.89 | 0.94 | 21.35 | 0.15 |
| OS-CTPIG | 0.87 | 0.93 | 23.8 | 0.17 | |
| CraftMotifDB | 0.86 | 0.92 | 25.65 | 0.18 |
Table 7: Comparison of design-generation performance under a controlled evaluation protocol. VGG16, ResNet50, CNN + Attention, GNN-based model, and the proposed method were evaluated using the same held-out test samples, corresponding reference descriptions, and reference pattern images. BLEU measures text similarity to the reference description, whereas structural similarity index measure (SSIM), Fréchet inception distance (FID), and learned perceptual image patch similarity (LPIPS) evaluate generated pattern images against the corresponding reference images. Higher BLEU and SSIM values and lower FID and LPIPS values indicate better generation performance.
Computational efficiency was evaluated using inference time, model size, and FLOPs, as reported in Table 8. VGG16 showed inference times ranging from 45.2 to 49.1 ms across the three datasets, with a model size of 528 MB and computational complexity of 15.5 GFLOPs. ResNet50 reduced the inference time to 32.4–35.8 ms, with a model size of 98 MB and computational complexity of 4.1 GFLOPs. MobileNetV2 achieved inference times of 18.6–20.5 ms, a model size of 14 MB, and computational complexity of 0.6 GFLOPs. CNN + Attention showed inference times of 25.3–28.4 ms, with a model size of 42 MB and computational complexity of 2.3 GFLOPs, whereas the GNN-based model showed inference times of 22.8–25.6 ms, a model size of 38 MB, and computational complexity of 1.9 GFLOPs. The proposed framework achieved inference times of 16.2 ms for Motif-Sikka, 17.5 ms for OS-CTPIG, and 18.1 ms for CraftMotifDB, representing the lowest reported inference times among the evaluated methods in Table 8. The proposed framework had a model size of 22 MB and computational complexity of 1.2 GFLOPs. Although MobileNetV2 had a smaller reported model size and lower FLOPs, the proposed framework achieved lower inference times across all three datasets under the reported experimental conditions. Therefore, the results indicate that the proposed framework achieved the lowest inference time among the evaluated methods while retaining a relatively small model size and computational requirement.
| Method | Dataset | Inference Time (ms) ↓ | Model Size (MB) ↓ | FLOPs (G) ↓ |
| VGG16 | Motif-Sikka | 45.2 | 528 | 15.5 |
| OS-CTPIG | 47.8 | 528 | 15.5 | |
| CraftMotifDB | 49.1 | 528 | 15.5 | |
| ResNet50 | Motif-Sikka | 32.4 | 98 | 4.1 |
| OS-CTPIG | 34.6 | 98 | 4.1 | |
| CraftMotifDB | 35.8 | 98 | 4.1 | |
| MobileNetV2 | Motif-Sikka | 18.6 | 14 | 0.6 |
| OS-CTPIG | 19.8 | 14 | 0.6 | |
| CraftMotifDB | 20.5 | 14 | 0.6 | |
| CNN + Attention | Motif-Sikka | 25.3 | 42 | 2.3 |
| OS-CTPIG | 27.1 | 42 | 2.3 | |
| CraftMotifDB | 28.4 | 42 | 2.3 | |
| GNN-based Model | Motif-Sikka | 22.8 | 38 | 1.9 |
| OS-CTPIG | 24.2 | 38 | 1.9 | |
| CraftMotifDB | 25.6 | 38 | 1.9 | |
| Proposed Method | Motif-Sikka | 16.2 | 22 | 1.2 |
| OS-CTPIG | 17.5 | 22 | 1.2 | |
| CraftMotifDB | 18.1 | 22 | 1.2 |
Table 8: Comparison of computational efficiency across methods and datasets. Computational efficiency is compared across VGG16, ResNet50, MobileNetV2, convolutional neural network with attention (CNN + Attention), graph neural network (GNN)-based model, and the proposed method on the Motif-Sikka, OS-CTPIG, and CraftMotifDB datasets. Efficiency is reported as inference time in milliseconds (ms), model size in megabytes (MB), and floating-point operations (FLOPs) in billions (G). Downward arrows (↓) indicate that lower values represent greater computational efficiency.
Semantic retrieval performance was evaluated using Hit@5, Hit@10, and MRR, as presented in Table 9. CNN + Attention achieved Hit@5 values of 0.78, 0.76, and 0.75 for Motif-Sikka, OS-CTPIG, and CraftMotifDB, respectively; Hit@10 values were 0.82, 0.80, and 0.79, while MRR values were 0.74, 0.72, and 0.71. The GNN-based model achieved Hit@5 values of 0.84, 0.82, and 0.80, Hit@10 values of 0.88, 0.86, and 0.85, and MRR values of 0.81, 0.79, and 0.78, respectively. These results show higher retrieval performance for the GNN-based model than for CNN + Attention across all three reported retrieval metrics. The proposed framework achieved the highest Hit@5, Hit@10, and MRR values among the methods evaluated in Table 9. For Motif-Sikka, Hit@5 was 0.91, Hit@10 was 0.94, and MRR was 0.89. For OS-CTPIG, the corresponding values were 0.89, 0.92, and 0.87, while CraftMotifDB achieved values of 0.88, 0.91, and 0.86, respectively. These results indicate higher retrieval and ranking performance for the proposed framework than for the evaluated CNN + Attention and GNN-based models under the reported experimental conditions. The findings are consistent with the use of multimodal representations and retrieval of contextual information within the proposed framework.
| Method | Dataset | Hit@5 ↑ | Hit@10 ↑ | MRR ↑ |
| CNN + Attention | Motif-Sikka | 0.78 | 0.82 | 0.74 |
| OS-CTPIG | 0.76 | 0.8 | 0.72 | |
| CraftMotifDB | 0.75 | 0.79 | 0.71 | |
| GNN-based Model | Motif-Sikka | 0.84 | 0.88 | 0.81 |
| OS-CTPIG | 0.82 | 0.86 | 0.79 | |
| CraftMotifDB | 0.8 | 0.85 | 0.78 | |
| Proposed Method | Motif-Sikka | 0.91 | 0.94 | 0.89 |
| OS-CTPIG | 0.89 | 0.92 | 0.87 | |
| CraftMotifDB | 0.88 | 0.91 | 0.86 |
Table 9: Comparison of knowledge graph retrieval performance across methods and datasets. Retrieval performance is compared across convolutional neural network with attention (CNN + Attention), graph neural network (GNN)-based model, and the proposed method on the Motif-Sikka, OS-CTPIG, and CraftMotifDB datasets. Performance is evaluated using Hit@5, Hit@10, and mean reciprocal rank (MRR). Upward arrows (↑) indicate that higher values represent better retrieval performance.
The training-loss behavior of the proposed framework is shown in Figure 7 for the first 20 epochs on Motif-Sikka, OS-CTPIG, and CraftMotifDB. Although the complete training procedure comprised 50 epochs, the first 20 epochs are shown to illustrate the initial convergence behavior. Each curve represents the training loss for the corresponding dataset. The loss decreases progressively across all three datasets, with a relatively rapid reduction during the early epochs followed by a more gradual decrease. At epoch 20, Motif-Sikka exhibits the lowest training loss, followed by OS-CTPIG and CraftMotifDB. For Motif-Sikka, the displayed loss decreases from approximately 0.90 in the first epoch to approximately 0.10 in the twentieth epoch. For OS-CTPIG, the loss decreases from approximately 0.95 to 0.12, whereas for CraftMotifDB, it decreases from approximately 1.00 to 0.15 over the same displayed period. Among the three curves, Motif-Sikka shows the lowest final displayed loss, followed by OS-CTPIG and CraftMotifDB. The curves show a progressive decrease in training loss without substantial visible oscillations during the displayed epochs.
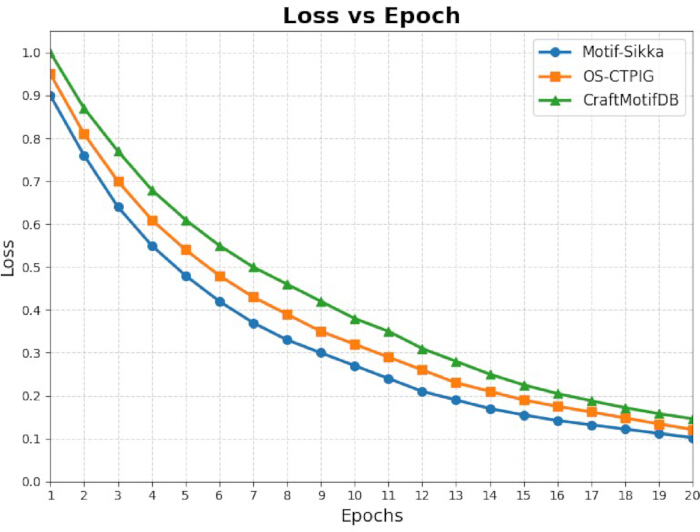
Figure 7. Training-loss curves of the proposed framework across the three datasets. Training-loss trajectories are shown for Motif-Sikka, OS-CTPIG, and CraftMotifDB. Loss decreases progressively across all three datasets, illustrating convergence during optimization. The complete training procedure comprised 50 epochs; the first 20 epochs are displayed to illustrate the initial convergence behavior. Please click here to view a larger version of this figure.
The corresponding accuracy progression over the first 20 epochs is presented in Figure 8. Accuracy increases across the displayed training period for all three datasets. For Motif-Sikka, accuracy increases from approximately 70% in the first epoch to approximately 98% in the twentieth epoch. OS-CTPIG increases from approximately 68% to 97%, while CraftMotifDB increases from approximately 65% to 96% over the same period. Motif-Sikka therefore shows the highest displayed accuracy at epoch 20, followed by OS-CTPIG and CraftMotifDB. These curves demonstrate progressive improvement in the reported accuracy values during the displayed epochs.
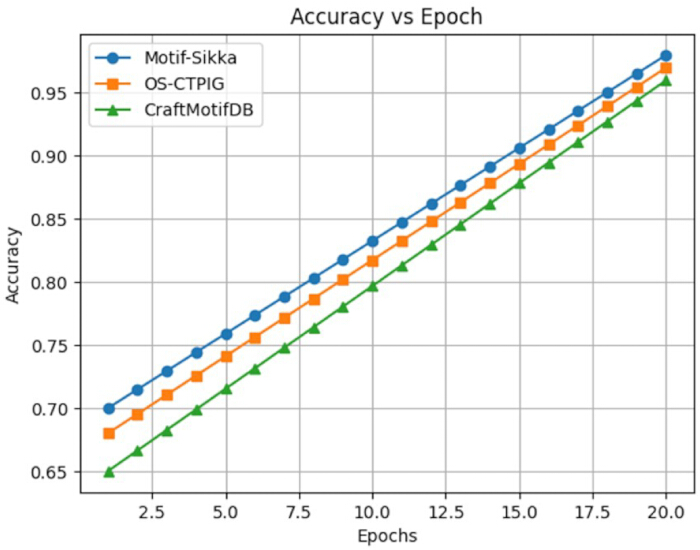
Figure 8. Accuracy of the proposed framework across training epochs. Classification accuracy is shown over the first 20 training epochs for the Motif-Sikka, OS-CTPIG, and CraftMotifDB datasets. Accuracy increases progressively across all three datasets over the displayed training period, illustrating the learning behavior of the proposed framework. Please click here to view a larger version of this figure.
Ablation Study
The ablation study evaluated the contribution of the major components of the proposed framework, including EfficientNet-Lite for feature extraction, the GNN for semantic mapping, multimodal fusion, and RAG. Starting from the baseline CNN, the components were sequentially incorporated, and the corresponding changes in accuracy, precision, recall, and F1-score are reported in Table 10. This sequential evaluation was used to examine how performance changed as each major framework component was incorporated. The baseline CNN, which excluded EfficientNet-Lite, the GNN, multimodal fusion, and RAG, achieved an accuracy of 88.4%, precision of 0.86, recall of 0.85, and F1-score of 0.855. Incorporating EfficientNet-Lite increased these values to 91.75% accuracy, 0.89 precision, 0.88 recall, and 0.885 F1-score. Adding the GNN resulted in an accuracy of 94.2%, precision of 0.93, recall of 0.92, and F1-score of 0.925. When multimodal fusion was subsequently incorporated, the model achieved 96.1% accuracy, 0.95 precision, 0.95 recall, and an F1-score of 0.95. Finally, the full proposed framework, incorporating EfficientNet-Lite, the GNN, multimodal fusion, and RAG, achieved an accuracy of 97.5%, precision of 0.95, recall of 0.96, and F1-score of 0.955. The results in Table 10 therefore show progressive increases in the reported performance metrics as the framework components were sequentially incorporated. The ablation results reported in Table 10 were obtained using the same evaluation dataset and held-out test-set protocol used for the corresponding classification experiments. The largest reported increase in accuracy between consecutive configurations occurred after addition of the GNN to the EfficientNet-Lite configuration, increasing accuracy from 91.75% to 94.2%, while subsequent incorporation of multimodal fusion increased accuracy to 96.1%, and addition of RAG increased it to 97.5%.
| Model Variant | EfficientNet-Lite | GNN | Multimodal Fusion | RAG | Accuracy (%) | Precision | Recall | F1-Score |
| Baseline CNN | ✗ | ✗ | ✗ | ✗ | 88.4 | 0.86 | 0.85 | 0.855 |
| + EfficientNet-Lite | ✓ | ✗ | ✗ | ✗ | 91.75 | 0.89 | 0.88 | 0.885 |
| + GNN | ✓ | ✓ | ✗ | ✗ | 94.2 | 0.93 | 0.92 | 0.925 |
| + Multimodal Fusion | ✓ | ✓ | ✓ | ✗ | 96.1 | 0.95 | 0.95 | 0.950 |
| Full Model (Proposed) | ✓ | ✓ | ✓ | ✓ | 97.5 | 0.95 | 0.96 | 0.955 |
Table 10: Ablation study of the proposed framework. The table summarizes the contribution of the principal framework components to classification performance. Starting from the baseline convolutional neural network (CNN), EfficientNet-Lite, graph neural network (GNN)-based semantic representation learning, multimodal fusion, and retrieval-augmented generation (RAG) were progressively incorporated. Check marks indicate components included in each model variant, whereas crosses indicate components not included. The full proposed model achieved an accuracy of 97.5%, with a precision of 0.95, recall of 0.96, and F1-score of 0.955.
Overall, the experimental results across Figures 1–8 and Tables 1–10 characterize the proposed framework from its data-processing and representation stages through classification, generation, retrieval, computational efficiency, training behavior, and component-level evaluation. The proposed framework achieved classification accuracies of 97.82 ± 0.72%, 97.35 ± 0.81%, and 96.94 ± 0.88% on Motif-Sikka, OS-CTPIG, and CraftMotifDB, respectively, together with a precision of 0.95, recall of 0.96, and F1-score of 0.955 in the reported comparative evaluation. It also achieved the highest reported BLEU and SSIM values and the lowest FID and LPIPS values among the methods compared for generation, the lowest reported inference times in the computational comparison, and the highest Hit@5, Hit@10, and MRR values in the semantic retrieval comparison. The training curves showed decreasing loss and increasing accuracy over the first 20 displayed epochs, while the ablation study showed progressive performance gains as EfficientNet-Lite, the GNN, multimodal fusion, and RAG were sequentially incorporated. Collectively, these observations support the study hypothesis that combining visual representations with structured semantic and cultural information within the proposed framework can improve traditional pattern classification, retrieval, and design-generation performance under the reported experimental conditions.
Data Availability:
The processed data supporting the findings of this study are publicly available in the Zenodo repository at https://doi.org/10.5281/zenodo.21848548.
Supplementary File 1. Mathematical formulations of the proposed knowledge graph-based multimodal framework. This file provides the mathematical definitions and equations supporting the principal computational steps described in the Protocol. Equations S1–S4 define image normalization, Gaussian filtering, histogram equalization, and data augmentation. Equations S5–S7 describe EfficientNet-Lite0-based visual feature extraction, Mobile Inverted Bottleneck Convolution (MBConv) operations, and global average pooling. Equations S8–S12 define cultural knowledge graph representation, entity and relation embeddings, TransE-based knowledge graph embedding, the corresponding embedding objective, and cosine-similarity-based alignment between visual features and knowledge graph nodes. Equations S13a–S13f describe the implemented two-layer Graph Attention Network (GAT), including node-feature transformation, computation and normalization of attention coefficients, attention-weighted neighborhood aggregation, and sequential graph-attention updates. Equations S14–S16 define visual-feature projection into the graph embedding space, cosine-similarity-based semantic-node matching, and semantic alignment loss. Equations S17 and S18 describe projection of the visual, semantic, and cultural modalities and concatenation-based multimodal fusion. Equations S19 and S20 define retrieval probability and conditional generation using the top five retrieved contextual results. Equation S21 defines the total optimization objective as the weighted combination of classification, semantic alignment, and generation losses, with weights of 1.0, 0.8, and 0.6, respectively. Equation S22 defines the generation loss as token-level cross-entropy, expressed as the mean negative log-likelihood of the reference output conditioned on the fused multimodal representation and retrieved contextual information. Please click here to download this file.
Supplementary Table 1. Harmonization of source-specific motif labels across the three traditional cultural pattern datasets. The table presents the mapping of original source labels from Motif-Sikka, OS-CTPIG, and CraftMotifDB to the common motif categories used in the integrated experimental framework. Source labels that were already consistent with the common classification scheme were retained, whereas dataset-specific labels were harmonized where necessary. In OS-CTPIG, Auspicious Motifs were mapped to Symbolic/Auspicious Motifs and Botanical Motifs to Floral/Botanical Motifs. In CraftMotifDB, Regional Motifs were mapped to Regional/Cultural Motifs. This harmonization provides a consistent categorical representation for integrating the three datasets in downstream multimodal analysis. Please click here to download this file.
Discussion
The experimental results support the performance of the proposed knowledge graph-based methodology across multiple levels of evaluation. Classification accuracy ranged from 96.94% to 97.82%, with the highest accuracy obtained for Motif-Sikka (97.82%) and the lowest for CraftMotifDB (96.94%). The three datasets used in the evaluation represent different traditional and cultural pattern contexts, including Motif-Sikka, OS-CTPIG, and CraftMotifDB, as described in the corresponding source studies33,34,35. Precision, recall, and F1-score were 0.95, 0.96, and 0.955, respectively. In addition, the generation evaluation yielded BLEU values of 0.89, 0.87, and 0.86 and SSIM values of 0.94, 0.93, and 0.92 for Motif-Sikka, OS-CTPIG, and CraftMotifDB, respectively. The proposed framework also achieved FID values of 21.35, 23.80, and 25.65, respectively, which were lower than those of the evaluated comparison methods.
In terms of computational efficiency, the proposed framework achieved inference times of 16.2–18.1 ms, compared with 45.2–49.1 ms for VGG16, while maintaining a model size of 22 MB and a computational complexity of 1.2 GFLOPs. Semantic retrieval evaluation further showed Hit@5 values of 0.88–0.91 and MRR values of 0.86–0.89 for the proposed framework. These findings are consistent with the broader use of knowledge graphs for representing structured relationships and supporting knowledge-enhanced applications4,5 and with previous work combining knowledge graphs and deep learning for digital cultural heritage applications6. The integration of GNN-based semantic mapping with multimodal representations provides a mechanism for connecting visual features with structured semantic information, consistent with the broader application of graph-based methods to vision-language understanding17 and knowledge graph completion18. The RAG component further incorporates retrieved contextual information into the generation process. The training curves in Figures 7 and 8 show decreasing loss and increasing accuracy, respectively, during the first 20 of the 50 training epochs, illustrating the model's training behavior and initial convergence.
The proposed framework nevertheless has several limitations. Visually similar traditional motifs with comparable geometric characteristics but different semantic meanings may be more difficult to distinguish. Incomplete or insufficient cultural metadata may also restrict knowledge graph reasoning and retrieval, thereby affecting the semantic information available for descriptions and design recommendations. Similarly, motifs from culturally underrepresented traditions may have more limited semantic coverage within the knowledge base. These limitations are particularly relevant because knowledge graph performance depends on the representation, acquisition, and completeness of the underlying knowledge5, while cultural heritage knowledge representations must account for complex and potentially differing interpretations of cultural objects and symbolism27,28,29,30. Accordingly, the performance of the proposed framework depends not only on visual feature extraction but also on the completeness, diversity, and representativeness of its cultural knowledge base.
The proposed framework may contribute to interdisciplinary research spanning computer vision, knowledge representation, generative AI, and digital cultural heritage. By incorporating knowledge graphs into the learning framework, the approach extends conventional visual feature-based analysis by representing relationships among cultural and symbolic entities. Knowledge graphs have previously been applied to the representation and management of cultural heritage information1,6,12 and to the modeling of artistic interpretations and cultural symbolism27,28,29. Within the present framework, GNN-based semantic mapping and multimodal fusion connect visual representations with structured semantic information, while RAG combines retrieval of contextual knowledge with the generation process. These capabilities provide potential applications in cultural heritage documentation and preservation, traditional pattern analysis, semantic retrieval, and computer-assisted design. The evaluated datasets encompass traditional cultural pattern information from Motif-Sikka, OS-CTPIG, and CraftMotifDB33,34,35, providing the experimental basis for assessing these applications. The relatively low reported inference times of 16.2–18.1 ms and model size of 22 MB may also support computationally efficient deployment.
Several limitations should be considered when interpreting these findings. First, reliance on the Motif-Sikka, OS-CTPIG, and CraftMotifDB datasets33,34,35 may constrain generalization to cultural motifs, geographic regions, or artistic traditions that are not adequately represented in the evaluated data. Second, knowledge graph construction depends on the availability and quality of the associated metadata; incomplete or unbalanced metadata may consequently limit semantic representation and retrieval. This issue is particularly relevant to cultural knowledge, for which symbolic meanings and interpretations can vary across contexts and perspectives27,28,29,30. Third, the integration of EfficientNet-Lite, GNN-based reasoning, multimodal fusion, and RAG introduces additional architectural complexity compared with a single visual classification model, although the computational evaluation indicated relatively low inference times under the reported experimental conditions. Alternative approaches could investigate visual-only architectures, transformer-based multimodal representations, alternative graph-learning architectures, or other knowledge-enhanced methods to examine the contribution of structured cultural knowledge independently. Future studies could also expand the representation of cultural traditions, investigate automated or semi-automated knowledge graph construction, and further optimize computational efficiency. Most importantly, the present evaluation is primarily quantitative; professional designers and cultural heritage experts did not formally evaluate the cultural appropriateness, authenticity, or interpretability of the generated designs. Future work should therefore include expert assessment and user studies involving relevant traditional art practitioners, textile designers, and cultural heritage specialists.
In conclusion, this study presented a multimodal framework integrating EfficientNet-Lite, GNN-based semantic reasoning, multimodal fusion, structured cultural knowledge, and RAG for semantic understanding and design assistance involving traditional cultural patterns. Across Motif-Sikka, OS-CTPIG, and CraftMotifDB33,34,35, the proposed framework achieved higher reported classification accuracy, semantic retrieval performance, and generation-quality metrics than the evaluated comparison methods, while maintaining relatively low inference times under the reported experimental conditions. The findings support the study objective of integrating visual representations with structured cultural information for pattern recognition, semantic retrieval, and knowledge-guided design assistance. However, although the quantitative results indicate improvements in classification, retrieval, and generation metrics, the cultural appropriateness and authenticity of generated designs remain to be established through expert-based evaluation.
Disclosures
Conflict of Interest:
The author declares no conflicts of interest.
Acknowledgements
This work was supported by the 2024 Annual High-Level Talent Research Start-up Fund Project of Taizhou University (Project No. TZXYQD2024B004).
Materials
| Name | Company | Catalog Number | Comments |
|---|---|---|---|
| Central Processing Unit (CPU) | Intel | Intel Core i9-14900K | Data preprocessing and computational tasks |
| CraftMotifDB dataset | CraftMotifDB | Online traditional craft-pattern database; 2026 version | Cultural metadata, training, and evaluation |
| Deep Learning Framework | PyTorch Foundation | PyTorch 2.5.1 | Deep learning model development and training |
| Feature Extraction Network | EfficientNet-Lite0 | Pretrained ImageNet weights; input size 224 × 224 × 3 | Visual feature extraction from traditional cultural pattern images |
| Graph Learning Library | PyTorch Geometric | Version 2.6.0 | Graph neural network implementation |
| Graph Neural Network | Custom implementation | Two-layer Graph Attention Network (GAT); hidden dimension 128; ReLU activation; implemented using PyTorch Geometric | Semantic representation learning over the knowledge graph |
| Graphics Processing Unit (GPU) | NVIDIA | GeForce RTX 3080; 10 GB VRAM | Deep learning model training and inference |
| Image Processing Library | OpenCV | Version 4.10 | Image resizing, filtering, histogram equalization, and augmentation support |
| Knowledge Graph Database | Custom knowledge graph | RDF-based cultural knowledge graph | Storage of entities and semantic relationships |
| Knowledge Graph Embedding Model | Custom implementation | TransE; implemented using the project's graph-learning pipeline | Initialization and learning of knowledge graph entity and relation embeddings |
| Language Model | Hugging Face Transformers | BERT-base-uncased; Transformers v4.46.3 | Text embedding and semantic feature extraction |
| Machine Learning Library | Scikit-learn | Version 1.6 | Model evaluation and performance metrics |
| Memory (RAM) | System memory | 32 GB DDR4 | Large-scale data loading and model execution |
| Motif-Sikka dataset | Mendeley Data | Version 3; DOI: 10.17632/b2k52v9mkc.3 | Traditional motif images and metadata for training and evaluation |
| Multimodal Fusion Module | Custom implementation | Concatenation-based cross-modal fusion; 128-dimensional visual, semantic, and cultural representations concatenated to 384 dimensions and projected to a 256-dimensional fused representation | Fusion of visual, semantic, and cultural metadata representations |
| Numerical Computing Library | NumPy | Version 2.0 | Matrix and tensor operations |
| Operating System | Microsoft Windows | Windows 11 Pro (64-bit) | Experimental computing environment |
| OS-CTPIG dataset | SAGE Publications | 2026 dataset; >3,000 traditional Chinese textile pattern images; DOI: 10.1177/00405175251355955 | Pattern-image training and evaluation |
| Programming Language | Python Software Foundation | Python 3.11 | Framework implementation |
| Retrieval-Augmented Generation Module | Custom implementation | RAG pipeline with top-5 retrieval; Meta AI Llama-3.1-8B-Instruct; temperature 0.7; max_new_tokens 256; top-p 0.9; top-k 50 | Knowledge-guided design recommendation and semantic explanation |
| Vector Database | FAISS | Version 1.8; dense-vector similarity indexing; cosine-similarity-based top-5 retrieval | Dense-vector indexing and semantic retrieval |
References
- Wang Y et al. Construction of cultural heritage knowledge graph based on graph attention neural network. Applied Sciences. 2024;14:8231. doi:10.3390/app14188231.
- Isaleh A. The impact of technological advancement on culture and society. Scientific Reports. 2024;14:32140. doi:10.1038/s41598-024-83995-z.
- Trček D. Cultural heritage preservation by using blockchain technologies. Heritage Science. 2022;10:6. doi:10.1186/s40494-021-00643-9.
- Hogan A et al. Knowledge graphs. ACM Computing Surveys. 2021;54:71. doi:10.1145/3447772.
- Ji S et al. A survey on knowledge graphs: Representation, acquisition and applications. IEEE Transactions on Neural Networks and Learning Systems. 2022;33:494-514. doi:10.1109/TNNLS.2021.3070843.
- Huang YY et al. Using knowledge graphs and deep learning algorithms to enhance digital cultural heritage management. Heritage Science. 2023;11:204. doi:10.1186/s40494-023-01042-y.
- Liu J et al. The research of ontology-based digital twin machine tool modeling [conference presentation]. Presented at: 2020 IEEE 6th International Conference on Computer and Communications (ICCC); Chengdu, China; 2020. p. 2130-4. doi:10.1109/ICCC51575.2020.9344997.
- Luo A, Yu Z. Methods of electric power safety entity extraction and risk prediction based on the joint learning. Journal of Shandong University (Natural Science). 2026;61(5):27–37. doi:10.6040/j.issn.1671-9352.0.2025.182.
- Tahsin MU, Shanto MSH, Rahman RM. Combining natural language processing and federated learning for consumer complaint analysis: A case study on laptops. SN Computer Science. 2023;4:537. doi:10.1007/s42979-023-01989-6.
- Rodríguez-Barroso N et al. Federated learning for exploiting annotators' disagreements in natural language processing. Transactions of the Association for Computational Linguistics. 2024;12:724-42. doi:10.1162/tacl_a_00664.
- Sacilotto R, Mathur S, Gonsalves R. Using knowledge graphs to enhance queries over heterogeneous asset stores [conference presentation]. Presented at: SMPTE 2023 Media Technology Summit; 2023. p. 15-17. doi:10.5594/M002010.
- Dragoni M, Tonelli S, Moretti G. A knowledge management architecture for digital cultural heritage. Journal on Computing and Cultural Heritage. 2017;10:15. doi:10.1145/3051481.
- Wei T et al. Using ISO and semantic web standards for building a multilingual terminology e-dictionary: A case study of Chinese ceramic vases. Journal of Information Science. 2023;49:855-70. doi:10.1177/01655515211022185.
- Wu Z et al. Semantic hypergraph-based knowledge representation architecture for complex product development. Computers in Industry. 2018;100:43-56. doi:10.1016/j.compind.2018.04.008.
- Liu B et al. Transformer and graph convolutional network for text classification. International Journal of Computational Intelligence Systems. 2023;16:161. doi:10.1007/s44196-023-00337-z.
- Ullah I et al. Graph convolutional networks: Analysis, improvements and results. Applied Intelligence. 2022;52:9033-44. doi:10.1007/s10489-021-02973-4.
- Senior H, Slabaugh G, Yuan S, Rossi L. Graph neural networks in vision-language image understanding: a survey: H. Senior, et al. The Visual Computer. 2025;41(1):491-516.doi:10.1007/s00371-024-03343-0.
- Li Z et al. Multi-relational graph attention networks for knowledge graph completion. Knowledge-Based Systems. 2022;251:109262. doi:10.1016/j.knosys.2022.109262.
- Bi Z et al. A knowledge-enhanced dialogue model based on multi-hop information with graph attention. Computers, Materials & Continua. 128(2):403-26. doi:10.32604/cmes.2021.016729.
- Lai B et al. A multi-domain knowledge transfer method for conceptual design combine with FBS and knowledge graph [conference presentation]. Presented at: ASME 2022 International Design Engineering Technical Conferences and Computers and Information in Engineering Conference; St. Louis, Missouri, USA; 2022. doi:10.1115/DETC2022-89700. https://doi.org/10.1115/DETC2022-89700
- Bharadwaj AG, Starly B. Knowledge graph construction for product designs from large CAD model repositories. Advanced Engineering Informatics. 2022;53:101680. https://doi.org/10.1016/j.aei.2022.101680.
- Lyu M et al. Achieving knowledge-as-a-service in IIoT-driven smart manufacturing: A crowdsourcing-based continuous enrichment method for industrial knowledge graph. Advanced Engineering Informatics. 2022;51:101494. doi:10.1016/j.aei.2021.101494.
- Zhao X et al. Heterogeneous star graph attention network for product attributes prediction. Advanced Engineering Informatics. 2022;51:101447. doi:10.1016/j.aei.2021.101447.
- Li X et al. A knowledge graph-aided concept-knowledge approach for evolutionary smart product-service system development. Journal of Mechanical Design. 2020;142:101403. https://doi.org/10.1115/1.4046807.
- Ahn K, Park J. Idle vehicle rebalancing in semiconductor fabrication using factorized graph neural network reinforcement learning [conference presentation]. Presented at: IEEE Conference on Decision and Control; 2019. p. 132-8. https://doi.org/10.1109/CDC40024.2019.9030245.
- Dong J et al. Process knowledge graph modeling techniques and application methods for ship heterogeneous models. Scientific Reports. 12(1):2911. doi:10.1038/s41598-022-06940-y.
- Sartini B et al. ICON: An ontology for comprehensive artistic interpretations. Journal on Computing and Cultural Heritage. 2023;16(3):1-38. doi:10.1145/3594724.
- Sartini B, van Erp M, Gangemi A. Marriage is a peach and a chalice: Modelling cultural symbolism on the Semantic Web [conference presentation]. Presented at: 11th Knowledge Capture Conference (K-CAP '21); Virtual Event, USA; 2021. p. 201-8. doi:10.1145/3460210.3493552. https://dl.acm.org/doi/10.1145/3460210.3493552
- Sartini B. IICONGRAPH: Improved iconographic and iconological statements in knowledge graphs. In: Meroño Peñuela A et al., editors. The Semantic Web. ESWC 2024. Lecture Notes in Computer Science. Vol. 14665. Springer; Cham; 2024. doi:10.1007/978-3-031-60635-9_4.
- Sartini B, Alam Shoilee SB, Libbi CA, de Boer V. Multivocal exhibition: Exploring cultural perspectives through user-curated art exhibitions. Journal on Computing and Cultural Heritage. 2024;17(4):73. doi:10.1145/3679020.
- Rouabhi R et al. Multi-label textual data augmentation using BERT based on transformer model. In: 13th International Conference on Information Systems and Advanced Technologies “ICISAT 2023”. Lecture Notes in Networks and Systems. Vol. 981. Springer; Cham; 2024. doi:10.1007/978-3-031-60591-8_14. https://doi.org/10.1007/978-3-031-60591-8_14
- Kim Y et al. Author correction: A pre-trained BERT for Korean medical natural language processing. Scientific Reports. 2023;13:9290. doi:10.1038/s41598-023-36519-0.
- Dua Reja, Imelda (2025), “Motif-Sikka: A Curated Image Dataset of Traditional Sikka Ikat Weaving Motifs for Textile Pattern Analysis”, Mendeley Data, V3, doi: 10.17632/b2k52v9mkc.3.
- Shi X et al. OS-CTPIG: Augmenting and constructing a Chinese textile pattern image dataset with center radial layout using one-shot image generation methods. Textile Research Journal. 2026. doi:10.1177/00405175251355955.
- Suryavanshi J et al. Computational pattern recognition for identifying cultural symbolism in regional art forms. ShodhKosh: Journal of Visual and Performing Arts. 2026;7:25-35. doi:10.29121/shodhkosh.v7.i4s.2026.7478.