The present study aims to clarify the relationship between the miR-146a rs2910164 polymorphism and allergic rhinitis (AR) susceptibility. Lower plasma miR-146a levels and the rs2910164 GG genotype are linked to elevated AR risk, enhanced inflammatory responses, and more severe clinical manifestations in AR patients.
Research Article
Association Study of Mir-146a Rs2910164 with Susceptibility to Allergic Rhinitis
In This Article
Summary
Abstract
Allergic rhinitis (AR) does not pose a threat to patients' lives, but it seriously impairs their quality of life. MicroRNA-146a (miR-146a) is critical for immune regulation and inflammatory responses; however, the relationship between the miR-146a rs2910164 polymorphism and susceptibility to AR remains incompletely understood. This case-control study was designed to investigate the influence of the miR-146a rs2910164 polymorphism on susceptibility to AR. This study included a total of 180 non-AR volunteers and 211 AR patients. The expression of plasma miR-146a was measured by RT-qPCR; The rs2910164 genotype was detected using the TaqMan-qPCR method. ELISA was used to detect the levels of serum IgE, IL-4, IL-6, and IL-10. Pearson correlation analysis evaluated the linear correlations between the expression of miR-146a and the TNSS score, RQLQ score, as well as the concentration of serum factors. The risk factors of AR were identified through logistic regression. The GG genotype and G allele of miR-146a rs2910164 were significantly more frequent in AR patients than in healthy controls. The plasma miR-146a level was reduced in AR patients. The plasma miR-146a level was lower in AR patients carrying the GG genotype, exhibiting more active allergic and inflammatory responses. The miR-146a expression was closely related to allergic symptoms and the severity of clinical manifestations. Logistic regression indicates that the levels of serum IgE and IL-4 were independent risk factors for AR, IL-10 and miR-146a expression were independent protective factors. Low plasma miR-146a levels are observed in AR patients, and the GG genotype of miR-146a rs2910164 increases susceptibility to AR.
Introduction
Allergic rhinitis (AR) is an allergen-mediated non-infectious inflammatory disorder of the nasal mucosa. The typical clinical symptoms of AR include an itchy nose, nasal congestion, clear nasal discharge, and frequent sneezing1. In more severe cases, patients may also experience a reduced sense of smell, and even affect the quality of sleep. Epidemiological data indicate that the global prevalence rate of AR is increasing year by year, reaching 10% to 25%2. Although AR does not endanger patients' lives, it seriously disrupts sleep, learning, and work, significantly reduces the quality of life, and imposes a heavy economic burden on individuals and society3. The study verified that AR serves as a risk factor for asthma, and as the disease progresses, patients are more likely to develop sinusitis or nasal polyps, further increasing the burden of the disease4,5. Therefore, prevention and control of AR become a key task in the field of respiratory diseases. However, the pathogenesis of AR has not been fully elucidated. In-depth exploration of the pathophysiological mechanism of AR and the development of targeted treatment strategies hold crucial significance. It is also the current scientific issues that need to be urgently addressed.
The onset of AR is related to environmental and genetic factors6. Current research generally holds that the synergistic effect of individual genetic susceptibility and allergen exposure environment is the core driving factor for the onset of AR. The Brozek team further confirmed that the interplay between genetic susceptibility of the body and environmental exposures is the fundamental cause of AR2. In the field of AR genetic mechanism research, genetic polymorphism has gradually become the focus of attention for scholars. Single-nucleotide polymorphisms (SNPs), as the prevalent form of genetic polymorphism, are the primary cause of genetic information variation in organisms7. Accumulating evidence indicates that the TT genotype at the IL-33 rs7044343 may serve as a potential target for the prevention and treatment of AR8. Additionally, the TT genotype at the CD14 promoter C-159T site acts as a predictive marker for the risk of AR9. This indicates that the key gene SNPs can serve as important molecular targets for assessing the risk of AR, providing early warnings, and achieving precise prevention and treatment. This provides crucial clues for a deeper understanding of the genetic susceptibility mechanism of AR.
Numerous studies have revealed that abnormal expression of microRNAs (miRNAs) is one of the core driving factors for the occurrence and development of a wide spectrum diseases10. miRNAs possess the characteristic of stable existence in body fluids, making them highly sensitive molecular markers for disease diagnosis. miR-146a is a type of non-coding RNA molecule with extensive biological functions11. The rs2910164 polymorphism is located within the stem-loop region of the precursor miR-146a sequence. Variation at this site can affect the processing and maturation efficiency of pre-miR-146a, thereby altering the expression level of mature miR-146a and influencing downstream immune and inflammatory responses. Previous studies have confirmed that overexpression of miR-146a can significantly reduce airway hyperresponsiveness in asthma mouse models and inhibit the activation of sensitized lymphocytes12. By targeting and inhibiting the activity of the epidermal growth factor receptor (EGFR), miR-146a can effectively alleviate the inflammatory damage of sinusitis13. Furthermore, overexpression of miR-146a can also alleviate the pathological symptoms of the AR mouse model by blocking the Toll-like receptor 4 (TLR4) signaling pathway14. These observations highlight the vital role of miR-146a in modulating respiratory system diseases.
Existing evidence from genetic polymorphism studies indicates that the G allele frequency at the miR-146a rs2910164 locus is closely related to airway hyperresponsiveness15. This SNP is also regarded as a potential biomarker of asthma risk in the Korean population15. In addition, the Jimenez-Morales team further revealed that the CC genotype at the miR-146a rs2910164 locus conferred protection against asthma16. However, there were no relevant studies reporting on the association between miR-146a rs2910164 polymorphism and AR susceptibility. Therefore, this study aims to verify the influence of the polymorphism of miR-146a rs2910164 on AR, providing a new theoretical basis for the pathogenesis, clinical diagnosis, and treatment of AR.
Protocol
Ethical statement:
All the participants were fully informed of the purpose of our experiment and signed the informed consent form. This research was approved by the ethics committee of Longyan First Affiliated Hospital of Fujian Medical University (Approval number. LYREC2023-k007-01). All procedures were performed in accordance with relevant guidelines, regulations, and the Declaration of Helsinki.
Participant Recruitment, Eligibility Criteria, and Sample Collection
A total of 211 individuals diagnosed with AR and 180 healthy participants (non-AR) were recruited from the otolaryngology outpatient department of Longyan First Affiliated Hospital of Fujian Medical University between January 2023 and May 2025. The diagnosis criteria for AR were adopted from the Chinese Society of Allergy Guidelines for Diagnosis and Treatment of Allergic Rhinitis17. Patients were required to exhibit no fewer than two clinical symptoms of AR, including nasal itching, sneezing, nasal congestion, or runny nose. In addition, nasal mucosal examination was required to demonstrate pallor and edema, and either the Skin Prick Test (SPT) result or the serum IgE test result had to be positive. The SPT was performed by dedicated staff in the outpatient allergen testing room to guarantee the accuracy and consistent results. All patients with AR underwent the Rhino conjunctivitis Quality of Life Questionnaire (RQLQ) and Total Nasal Symptom Score (TNSS) assessments with assistance from medical staff, and the scores were recorded for subsequent analysis.
Healthy volunteers undergoing routine physical examinations at the hospital were recruited as the non-AR group. Eligible participants had no personal or family history of AR, no history of asthma or other allergic diseases, no chronic sinusitis or other inflammatory diseases of the nasal cavity, and no respiratory tract infection within the previous month. In addition, individuals with a history of serious cardiac, hepatic, pulmonary, or renal diseases, or any malignant tumors, were excluded from the study.
The peripheral venous blood samples of the two groups of volunteers were collected. A portion of the anticoagulated venous blood was used for DNA extraction and for extracting plasma RNA. Another portion of the venous blood was separated to obtain serum, which was used for the detection of serum-related factors (immunoglobulin E (IgE), interleukin-4 (IL-4), IL-6, and IL-10).
DNA Extraction:
200 µL of peripheral venous blood samples were extracted for DNA using the whole blood genomic DNA extraction kit (Refer to Table of Materials). The blood samples were collected into lithium heparin anticoagulation tubes and then aliquoted and frozen at -20 °C for storage. The specific operation procedures should strictly follow the instructions of the kit. Finally, 100 µL of elution buffer was used to elute the DNA. The purity of the extracted DNA sample was determined by the nucleic acid/protein analyzer (Spectrophotometer) (the OD₂₆₀/OD₂₈₀ ratio was between 1.8 and 2.0). The DNA samples after the detection were stored at -20 °C for future use in the subsequent genotyping experiments.
Genotype Detection
The TaqMan SNP genotyping kit was available for detecting the distribution of miR-146a rs2910164 genotypes. The kit information has been entered into the consumables list. The PCR total reaction volume was 10 µL, containing Master Mix 5 µL, typing probe primer mixture 0.5 µL, template DNA 10 ng, and RNase-free water. DNA amplification was carried out with the Roche LightCycler 480 II real-time fluorescence quantitative PCR instrument. Reaction conditions: Pre-denaturation at 95 °C for 10 min; 40 cycles (95 °C for 15 seconds, 60 °C for 1 min), and the FAM/VIC fluorescence was read at 60 °C. After the amplification was completed, the collected FAM/VIC dual fluorescence signals were analyzed using LightCycler 480 Software, and the genotype data were statistically processed. A single FAM signal represents a homozygous genotype, a single VIC signal represents another homozygous genotype, and the presence of both signals indicates a heterozygous genotype. Samples with abnormal signals or inconsistent results upon repetition will be re-tested. Each experiment was conducted with both template-free control and positive control for quality control. All samples were subjected to three technical replicates.
RT-qPCR
Total plasma miRNA extraction was performed from 100 µL plasma using a dedicated miRNA extraction kit. The kit information has been entered into the consumables list. The RNA concentration was determined using a spectrophotometer. The OD₂₆₀/OD₂₈₀ ratio of the extracted qualified miRNA samples ranged from 1.8 to 2.0. 200 ng of RNA was used for reverse transcription to synthesize cDNA, and the reaction procedure followed the standard instructions of the kit. Reverse transcription was performed in a total volume of 20 µL, including incubation at 42 °C for 60 min and inactivation at 85 °C for 5 min. The qPCR reaction was prepared following the established protocol, with a total volume of 20 µL. The reaction mixture was configured as follows: 10 µL of qPCR pre-mix, 0.4 µL of forward primer, 0.4 µL of reverse primer, 1 µL of cDNA template, and 8.2 µL of RNase-free water. The specific primers for miR-146a and the internal reference gene U6 were used. The amplification was completed using the Roche LightCycler 480 II real-time fluorescence quantitative PCR instrument. The qPCR thermal cycling conditions were: 95 °C for pre-denaturation for 30 s, followed by 40 cycles of denaturation at 95 °C for 5 s and annealing and extension at 60 °C for 30 s. All samples were subjected to three technical replicates. The experimental data were analyzed using the LightCycler 480 Software. Using U6 as the internal reference to correct the inter-sample variation, first calculate ΔCt (the Ct value of miR-146a - the Ct value of U6), then calculate ΔΔCt (the ΔCt of the experimental group - the ΔCt of the control group), and finally the relative expression level of miR-146a was obtained through 2⁻ΔΔCt.
ELISA
The serum levels of IgE, IL-4, IL-6, and IL-10 were detected by ELISA kits. The experimental procedures were referenced in the instruction manual. Specific steps were as follows: Firstly, the concentrated washing solution was diluted, and the standards were gradiently diluted to prepare working solutions for the standard curve. Secondly, the 50 µL diluent, standard solution, and the sample to be tested were added to the wells and incubated at 37 °C for 60 min. After incubation, the wells were washed three times with washing buffer. Subsequently, 50 µL of enzyme-conjugated antibody working solution was added, and the plates were incubated at 37 °C for 30 min. After the incubation was completed, the liquid was discarded, and the wells were washed again, followed by the addition of chromogenic solution for a 15-min incubation at 37 °C in the dark. After adding the stop solution, the absorbance was measured at 450 nm using a microplate reader. Sample concentrations were calculated according to the standard curve. Each sample was tested three times. Data with a coefficient of variation less than 10% were considered valid. Blank wells and control wells were set up during the experiment for quality control. The detection range and sensitivity of the kit complied with the regulations specified in the manufacturer's manual.
Data statistics
The experimental data were analyzed using SPSS and GraphPad Prism 9 softwares. The data were presented as mean ± standard deviation (mean ± SD). The Shapiro-Wilk test was used to assess the normality of continuous variables, and Levene’s test was applied to evaluate homogeneity of variance. Comparison of continuous variables between the two groups was analyzed using the independent samples t-test. One-way ANOVA followed by Tukey’s post-hoc test was performed for multiple group comparisons, and Two-way ANOVA was applied to evaluate the main effects of two independent factors and their interaction effect. Outliers were identified and excluded based on the 3-standard deviation rule. No missing data were detected in this study. The receiver operating characteristic (ROC) curve was used to analyze the diagnostic efficacy of miR-146a for AR. Relevant ROC parameters and 95% confidence intervals were calculated using built-in statistical algorithms. Pearson correlation analysis was used to measure the linear correlation between miR-146a expression and the levels of serum-related factors. Univariate and multivariate logistic regression analyses were conducted to screen risk factors for AR. Variables with p < 0.05 in univariate analysis were included in the multivariate logistic regression model. p < 0.05 was considered statistically significant.
Results
Participant Characteristics and Genotype Distribution
The clinical baseline data of the two groups of subjects were statistically analyzed. The results indicated that the serum levels of IgE, IL-4, IL-6, and IL-10 showed significant differences. Compared with the non-AR volunteer group, the concentration of serum IgE, IL-4, and IL-6 in the AR patient group was increased, while the IL-10 level was decreased (Table 1). The genotype distribution of miR-146a rs2910164 was detected using the TaqMan-qPCR method. The analysis results showed that the GG genotype (χ2=7.018, OR (95% CI) = 0.471 (0.269-0.825), p=0.008) and the G allele (χ2=7.474, OR (95% CI) = 0.637 (0.506-0.894), p=0.006) of rs2910164 were more prevalent in the AR patient group compared to the non-AR group. The genotype distribution at rs2910164 locus followed the Hardy-Weinberg equilibrium (pHWE = 0.191) (Table 2).
Plasma miR-146a Expression Analysis
The expression level of plasma miR-146a across the two study cohorts was measured. A marked reduction in miR-146a level was observed in AR patients (Figure 1A). The ROC curve analysis demonstrated that miR-146a has a good diagnostic efficacy for AR (Figure 1B). The AUC was 0.891. At the optimal cutoff value of 0.785, the sensitivity was 83.89%, the specificity was 79.44%, and the Youden index was 0.633. Based on the miR-146a rs2910164 genotype, the two groups of subjects were respectively divided into three subgroups: GG, GC, and CC. The miR-146a expression differences in each subgroup were compared. The statistical results showed that in the non-AR group, miR-146a expression showed no significant statistical difference among different genotype subgroups (Figure 1C); In the AR group, the expression level of plasma miR-146a in the GG genotype subgroup was significantly lower than that in the GC and CC genotype subgroups (Figure 1D). The above data indicate that the expression of plasma miR-146a in AR patients carrying the GG genotype of rs2910164 is reduced.
Serum Cytokine Analysis and Correlation with miR-146a Expression
Next, the serum levels of IgE, IL-4, IL-6, and IL-10 in the different genotype subgroups of the subjects were statistically analyzed. The statistical results revealed no significant differences in serum levels of IgE, IL-4, IL-6, and IL-10 among different genotype subgroups (Figure 2A-D); In the AR group, the levels of serum IgE, IL-4, and IL-6 in patients carrying the GG genotype were significantly higher than those in patients with the GC and CC genotypes, while the level of serum IL-10 was lower (Figure 2A-D). Pearson correlation analysis was used to investigate the linear correlations between the expression of plasma miR-146a and the TNSS score, RQLQ score, as well as the serum levels of IgE, IL-4, IL-6, and IL-10. The results indicated that the expression of miR-146a was significantly negatively correlated with the TNSS score, RQLQ score, and serum levels of IgE, IL-4, and IL-6, while it was positively correlated with the serum level of IL-10 (Table 3). These findings suggest that the expression level of miR-146a is closely related to the severity of AR as well as the levels of allergic reactions and inflammation.
Risk Factor Analysis for Allergic Rhinitis
Univariate logistic regression was used to analyze the risk factors of AR, and the results indicated that IgE (OR = 1.719, 95% CI = 1.151-2.568, p = 0.008), IL-4 (OR = 1.602, 95% CI = 1.073-2.392, p = 0.021), IL-6 (OR = 1.566, 95% CI = 1.048-2.341, p = 0.029), IL-10 (OR = 0.649, 95% CI = 0.435-0.968, p = 0.034), and miR-146a expression (OR = 0.149, 95% CI = 0.096-0.233, p < 0.001) had impact on the occurrence of AR. After controlling for confounding factors through multivariate logistic regression analysis, it was statistically found that IgE (OR=1.724, 95% CI = 1.092-2.722, p = 0.019), IL-4 (OR = 1.943, 95% CI = 1.206-3.131, p = 0.006), IL-10 (OR = 0.479, 95% CI = 0.296-0.773, p = 0.003), and miR-146a expression (OR = 0.148, 95% CI = 0.093-0.235, p < 0.001) were independent risk factors for AR (Table 4).
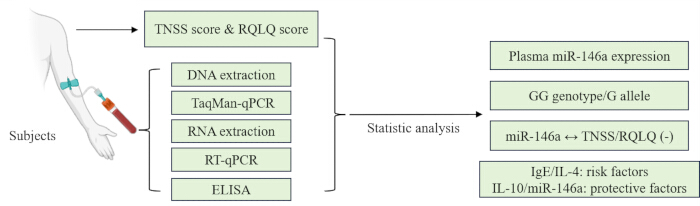
Figure 1: Schematic diagram of the workflow. Please click here to view a larger version of this figure.
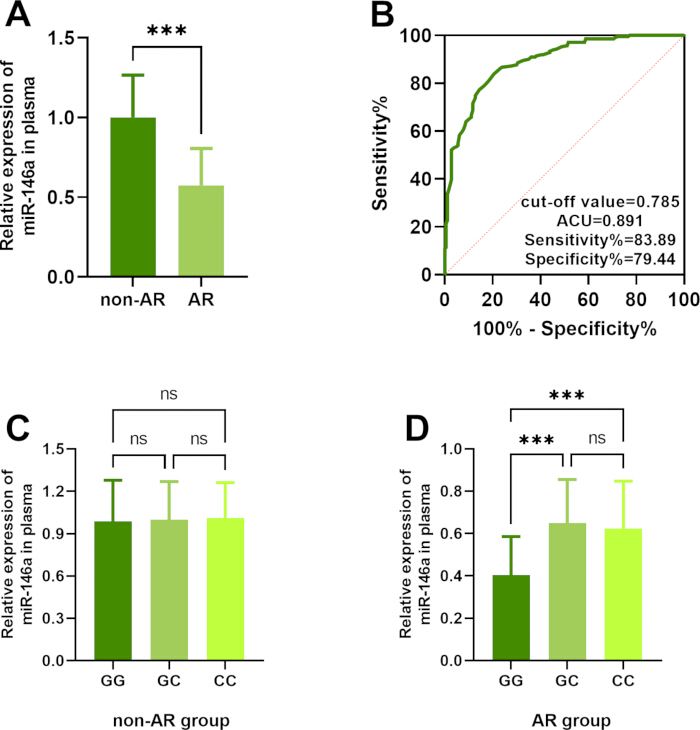
Figure 2. Plasma miR-146a expression and diagnostic performance in AR.
(A) Relative plasma miR-146a expression in non-AR volunteers and patients with AR. (B) ROC curve evaluating the diagnostic performance of plasma miR-146a for AR. (C) Plasma miR-146a expression among GG, GC, and CC genotype subgroups in the non-AR group. (D) Plasma miR-146a expression among GG, GC, and CC genotype subgroups in the AR group. Data are presented as mean ± SD. ***p < 0.001. Please click here to view a larger version of this figure.
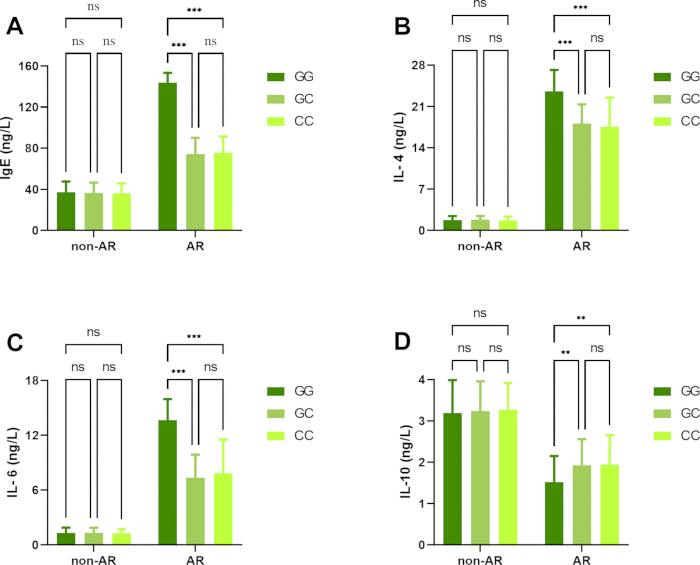
Figure 3. Serum cytokine concentration of subjects with different genotypes of miR-146a rs2910164 in non-AR and AR groups.
Serum levels of (A) IgE, (B) IL-4, (C) IL-6, and (D) IL-10 in GG, GC, and CC genotype subgroups of the non-AR and AR groups. Data are presented as mean ± SD. *p < 0.05, **p < 0.01, ***p < 0.001; ns, not significant. Please click here to view a larger version of this figure.
| Information | non-AR | AR | p-value |
| Age (years) | 42.37±12.43 | 41.81±11.86 | 0.316 |
| BMI (kg/m2) | 23.72±2.36 | 23.58±2.71 | 0.302 |
| Sex (male, n) | 87 | 97 | 0.641 |
| Smoker | 81 | 94 | 0.929 |
| IgE (IU/ml) | 36.17±10.44 | 116.52±24.38 | <0.001 |
| IL-4 (ng/L) | 1.76±0.61 | 18.74±4.62 | <0.001 |
| IL-6 (ng/L) | 1.29±0.57 | 9.63±3.79 | <0.001 |
| IL-10 (ng/L) | 3.26±0.68 | 1.74±0.73 | <0.001 |
| TNSS | / | 5.92±1.82 | |
| RQLQ | / | 2.43±1.16 | |
| Abbreviation: AR, Allergic rhinitis; BMI, Body Mass Index; IgE, Immunoglobulin E; IL, Interleukin; TNSS, Total Nasal Symptom Score; RQLQ, Rhinoconjunctivitis Quality of Life Questionnaire; p<0.05 indicates statistical significance. | |||
Table 1: Clinical characteristics of study participants.
Comparison of demographic characteristics, serum cytokine levels, and clinical assessment scores between the non-AR and AR groups. Abbreviations are defined in the table footnote.
| rs2910164 | non-AR (n=180) (%) | AR (n=211) (%) | Χ2 | p-value | OR (95% CI) |
| Codominant model | |||||
| GG | 31 (17.22%) | 57 (27.01%) | 1 | ||
| GC | 82 (45.56%) | 96 (45.50%) | 2.832 | 0.092 | 0.637 (0.376-1.079) |
| CC | 67 (37.22%) | 58 (27.49%) | 7.018 | 0.008 | 0.471 (0.269-0.825) |
| Dominant model | |||||
| GG+ GC | 113 (62.78%) | 153 (72.51%) | 1 | ||
| CC | 67 (38.22%) | 58 (27.49%) | 4.232 | 0.04 | 0.639 (0.417-0.980) |
| Recessive model | |||||
| GG | 31 (17.22%) | 57 (27.01%) | 1 | ||
| GC + CC | 149 (82.78%) | 154 (72.99%) | 5.34 | 0.021 | 0.562 (0.344-0.919) |
| Alleles | |||||
| G | 144 (40.00%) | 210 (49.76%) | 1 | ||
| C | 216 (60.00%) | 212 (50.24%) | 7.474 | 0.006 | 0.637 (0.506-0.894) |
| pHWE | 0.494 | 0.191 | |||
| Abbreviation: AR, Allergic rhinitis. OR, Odds Ratio; pHWE>0.05 suggests that the group is consistent with the Hardy-Weinberg equilibrium. p < 0.05 indicates statistical significance. Note: The GG genotype was set as the reference group (OR = 1.000) for all genetic models. | |||||
Table 2: Association between miR-146a rs2910164 polymorphism and allergic rhinitis.
Distribution of rs2910164 genotypes and alleles in the non-AR and AR groups analyzed using codominant, dominant, recessive, and allele genetic models.
| Items | miR-146a | TNSS | RQLQ | IgE | IL-4 | IL-6 | IL-10 |
| Pearson correlation | 1 | -0.742 | -0.736 | -0.806 | -0.756 | -0.727 | 0.757 |
| p-value | / | <0.001 | <0.001 | <0.001 | <0.001 | <0.001 | <0.001 |
| Abbreviation: TNSS, Total Nasal Symptom Score; RQLQ, Rhinoconjunctivitis Quality of Life Questionnaire; IgE, Immunoglobulin E; IL, Interleukin; p<0.05 indicates statistical significance. | |||||||
Table 3: Correlation of plasma miR-146a expression with clinical and inflammatory parameters.
Pearson correlation analysis of plasma miR-146a expression with TNSS score, RQLQ score, serum IgE level, and cytokine levels in study participants.
| Items | Univariate regression analysis | Multivariate regression analysis | ||||
| OR | 95% CI | p-value | OR | 95% CI | p-value | |
| Age | 0.984 | 0.661-1.465 | 0.937 | |||
| BMI | 1.301 | 0.799-2.119 | 0.29 | |||
| Sex | 1.099 | 0.738-1.638 | 0.641 | |||
| Smoker | 1.018 | 0.683-1.519 | 0.929 | |||
| IgE | 1.719 | 1.151-2.568 | 0.008 | 1.724 | 1.092-2.722 | 0.019 |
| IL-4 | 1.602 | 1.073-2.392 | 0.021 | 1.943 | 1.206-3.131 | 0.006 |
| IL-6 | 1.566 | 1.048-2.341 | 0.029 | 1.489 | 0.924-2.353 | 0.088 |
| IL-10 | 0.649 | 0.435-0.968 | 0.034 | 0.479 | 0.296-0.773 | 0.003 |
| miR-146a expression | 0.149 | 0.096-0.233 | <0.001 | 0.148 | 0.093-0.235 | <0.001 |
| Abbreviation: AR, Allergic rhinitis; BMI, Body Mass Index; IgE, Immunoglobulin E; IL, Interleukin. | ||||||
Table 4: Logistic regression analysis of factors associated with allergic rhinitis.
Univariate and multivariate logistic regression analyses evaluating demographic variables, serum cytokines, and plasma miR-146a expression as factors associated with AR.
Supplementary File 1: Raw Data Please click here to download this file.
Discussion
AR is a chronic allergic inflammatory disease of the respiratory tract. The core mechanism of AR is that after the body is exposed to allergens, inflammatory lesions in the nasal mucosa are mediated by IgE17,18. The clinical symptoms mainly include nasal itching, nasal congestion, sneezing, and clear nasal discharge, which seriously impair patients’ quality of life. The epidemiological and genetic studies confirmed that genetic susceptibility exerts a vital and indispensable effect on the onset and development of AR19. This study further revealed that miR-146a rs2910164 polymorphism was closely related to susceptibility to AR, and the GG genotype of rs2910164 may be the pathogenic genotype. The elevated serum concentration of IgE, IL-4, and IL-6, together with the reduced IL-10 level observed in patients with AR, indicate enhanced allergic and inflammatory responses that are consistent with the immunopathological characteristics of the disease.
Prior work has shown that the miR-146a SNP contributes to the pathogenesis of various allergic diseases, such as rheumatoid arthritis20, systemic lupus erythematosus21, and inflammatory bowel disease22. Rasha et al. further reported that the distribution of the GG genotype frequency and the G allele at the rs2910164 locus was significantly correlated with the susceptibility of inflammatory bowel disease22. The Hai-Bo team discovered that the CC genotype at the rs2910164 locus was a protective genotype for psoriasis. Individuals carrying the GG genotype have a significantly lower risk of developing psoriasis23. Multiple studies reported that the rs2910164 polymorphism was closely related to asthma susceptibility, and it was confirmed that the GG genotype significantly increased the risk of developing asthma15,16,24. This study further revealed that the distribution frequency of the miR-146a rs2910164 GG genotype in AR patients was higher than that in the healthy control group, suggesting that the GG genotype may increase susceptibility to AR. The observed enrichment of the GG genotype and G allele in the AR group further supports the potential contribution of miR-146a rs2910164 genetic variation to disease susceptibility. For AR patients carrying rs2910164 GG genotype, the concentrations of serum IgE, IL-4, IL-6, and IL-10 were increased. The altered cytokine profile observed in individuals carrying the GG genotype suggests a stronger inflammatory and allergic response, which may contribute to increased disease susceptibility. This result suggests that the GG genotype may be involved in the pathogenesis of AR by enhancing the allergic and inflammatory response.
As a pivotal regulator of inflammatory response, miR-146a exerts a potent anti-inflammatory effect. Overexpression of miR-146a regulates downstream genes and significantly alleviates multiple inflammation-related damages25,26,27. Previous studies have confirmed that overexpression of miR-146a can effectively suppress the inflammatory response of allergic conjunctivitis via upregulating the expression of transcription factor forkhead box protein 3 (FOXP3)28. Further animal experiments have revealed that the knockdown of miR-146a in mutant mice has a higher risk of developing emphysema compared to wild-type mice, further confirming the protective role of miR-146a in respiratory disease29. In the sinusitis model, miR-146a inhibits the activation of Mucin5AC (MUC5AC), reducing mucosal inflammation and excessive mucus secretion13. This study result showed that the level of miR-146a in AR patients was decreased, and the plasma miR-146a expression in patients carrying the rs2910164 GG genotype was even lower. These findings point out that the rs2910164 GG genotype may influence susceptibility to AR through its association with reduced miR-146a expression and altered immune regulation. The GG genotype may reduce the miR-146a expression, weakening its anti-inflammatory regulatory function and increasing the susceptibility to AR. The Pearson correlation analysis further indicated the association between the miR-146a expression level and the severity of AR, as well as the inflammatory state. The miR-146a expression was linearly negatively correlated with TNSS, RQLQ, and serum levels of IgE, IL-4, and IL-6; and linearly positively correlated with the level of IL-10. This indicates that for AR patients with lower miR-146a expression, their clinical symptoms are more severe, their quality of life is more impaired, and allergic reactions and inflammatory responses are stronger.
This study was a case-control study. The analysis confirmed a significant association between miR-146a rs2910164 polymorphism and AR susceptibility. However, the research still has certain limitations. On the one hand, the relatively small sample size may restrict the generalizability of our findings and cannot accurately characterize distribution characteristics of the rs2910164 genotype in the population. On the other hand, this study only demonstrates the association between the miR-146a rs2910164 polymorphism and the susceptibility to AR, but cannot clearly demonstrate the causal relationship between the miR-146a rs2910164 polymorphism and AR. Therefore, in the future, a prospective cohort study will be conducted to include more patients, to clarify the relationship between the miR-146a rs2910164 polymorphism and the onset, progression, and prognosis of AR, and providing a more sufficient theoretical basis for the prevention and treatment of AR.
Overall, plasma miR-146a expression was decreased in patients with AR, and the rs2910164 GG genotype was associated with increased disease susceptibility. This study provides a potential molecular marker for identifying individuals at increased risk of AR and offers a foundation for future investigations into the genetic mechanisms underlying disease development and progression.
Disclosures
There is no disclosure in this paper.
Data availability:
All data generated or analyzed during this study are included in this article as a Supplementry file. Further enquiries can be directed to the corresponding author.
Author’s contribution:
YMY made substantial contributions to the conception and design, acquisition of data or analysis and interpretation of data, involved in drafting the manuscript. YYH aided with data acquisition, data analysis and statistical analysis. GML and JCW contributed with interpretation of the results and critically revised the manuscript. All authors read and approved the final manuscript.
Acknowledgements
Not applicable.
Materials
| Name | Company | Catalog Number | Comments |
|---|---|---|---|
| 15mL centrifuge tube | Corning | 430791 | For plasma separation, sample subpackaging, nucleic acid extraction operation |
| Applied Biosystems TaqMan Genotyping Master Mix | Thermo Fisher Scientific | 4371355 | 2× concentrated master mix optimized for SNP genotyping, containing hot-start Taq polymerase, dNTPs, magnesium ions, reaction buffer and ROX reference dye. No manual system preparation required. Compatible with the above TaqMan SNP Genotyping Assay, it provides a stable enzymatic reaction system for SNP amplification and fluorescent genotyping with good reproducibility and clear clustering results. |
| Applied Biosystems TaqMan SNP Genotyping Assay (rs2910164, miR-146a) | Thermo Fisher Scientific | C__15946974_10 | Pre-designed primer and probe mix for SNP genotyping of human miR-146a rs2910164 locus. It contains specific PCR primers and two MGB fluorescent probes. VIC labels C allele and FAM labels G allele. It can accurately distinguish three genotypes (CC, CG, GG) in a single reaction tube, suitable for end-point allelic discrimination on qPCR instruments. |
| BD Lithium Heparin Anticoagulant Blood Collection Tubes | BD Vacutainer | 367884 | Clinical biochemistry, emergency tests, and hematology research |
| Graphpad | USA | / | Professional scientific graphing & statistics software, standard for biology/medicine, no coding required. Key strengths: t-tests, ANOVA, survival analysis, nonlinear regression (e.g., dose-response curves); generates publication-ready graphs (bar, scatter, survival curves) for qPCR, Western Blot, cell assays. |
| Immunoglobulin E (IgE) ELISA Kit | Jiancheng | H108-1-2 | Application: Immune response, allergic disease research |
| Interleukin-10 (IL-10) ELISA Kit | Jiancheng | H010-1-2 | Application: Inflammation, immune regulation, clinical biomarker research |
| Interleukin-4 (IL-4) ELISA Kit | Jiancheng | H005-1-2 | Research field: Inflammation, Th2 immune response, allergic reaction |
| Interleukin-6 (IL-6) ELISA Kit | Jiancheng | H007-1-2 | Application: Inflammation, immune regulation, clinical biomarker research |
| LightCycler 480 Software (v1.5 /v1.6) | Roche Diagnostics | / | Official Roche software that enables one-click qPCR data acquisition, quantitative analysis, melting curve analysis, and SNP genotyping (TaqMan end-point method + HRM). |
| miRcute Enhanced miRNA cDNA First-Strand Synthesis Kit | TIANGEN | KR211-02 | Suitable for all mature miRNA reverse transcription |
| miRcute Serum/Plasma miRNA Extraction and Isolation Kit | TIANGEN | DP503 | Applicable sample: Human serum, plasma, cell supernatant |
| Roche LightCycler 480 Instrument II (Real-Time PCR System) | Roche Diagnostics | 05015278001 | qPCR Quantification + SNP Genotyping (including TaqMan) + HRM High-Resolution Melting Curve Analysis |
| SPSS 27.0 | USA | / | All-in-one social science/medical statistics software, menu-driven (no coding), ideal for large samples & complex designs. Core features: descriptive stats, ANOVA, regression, chi-square, survival analysis, reliability, sample size calculation; supports data cleaning & multi-format import (Excel/CSV) for clinical, survey, epidemiological data. |
| SuperReal PreMix Plus (SYBR Green) | TIANGEN | FP205-02 | High-specificity enhanced master mix; optimized buffer with H-Bond factor minimizes primer dimers & non-specifics; hot-start Taq + ROX for LightCycler 480 II; high sensitivity & reproducibility; ideal for low-abundance genes, complex samples, high-throughput genotyping. |
| Thermo Scientific Multiskan FC Microplate Photometer | Thermo | 51119180 | High-end multimode plate reader; absorbance (450 nm included) + fluorescence + luminescence; linearity 0–4 Abs (±2%) at 450 nm, precision SD<0.001 Abs; 96/384-well compatible, auto dynamic range; ideal for ELISA, cell viability, immunoassays, molecular interactions. |
| Thermo Scientific NanoDrop One UV-Vis Spectrophotometer | Thermo | / | Gold-standard microvolume UV-Vis spectrophotometer; 1–2 μL sample, no cuvette needed; directly measures nucleic acids (260 nm), proteins (280 nm), OD600 with concentration & purity ratios (A260/A280, A260/A230); full-spectrum scan 190–850 nm, auto-calibration, touchscreen; ideal for qPCR, NGS, protein purification QC. |
| Whole blood genomic DNA extraction kit | TIANGEN | DP304-03 | Applicable sample: Peripheral whole blood, blood cells, tissue samples |
References
- Bernstein, J. A., Bernstein, J. S., Makol, R. & Ward, S. Allergic Rhinitis: A Review. JAMA. 331 (10), 866-877, (2024).
- Brozek, J. L. et al. Allergic Rhinitis and its Impact on Asthma (ARIA) guidelines-2016 revision. J Allergy Clin Immunol. 140 (4), 950-958, (2017).
- Pagel, J. M. L. & Mattos, J. L. Allergic Rhinitis and Its Effect on Sleep. Otolaryngol Clin North Am. 57 (2), 319-328, (2024).
- Nappi, E. et al. Comorbid allergic rhinitis and asthma: important clinical considerations. Expert Rev Clin Immunol. 18 (7), 747-758, (2022).
- Grimm, D., Hwang, P. H. & Lin, Y. T. The link between allergic rhinitis and chronic rhinosinusitis. Curr Opin Otolaryngol Head Neck Surg. 31 (1), 3-10, (2023).
- Wise, S. K. et al. International consensus statement on allergy and rhinology: Allergic rhinitis - 2023. Int Forum Allergy Rhinol. 13 (4), 293-859, (2023).
- Vignal, A., Milan, D., SanCristobal, M. & Eggen, A. A review on SNP and other types of molecular markers and their use in animal genetics. Genet Sel Evol. 34 (3), 275-305, (2002).
- Falahi, S. et al. Association between IL-33 Gene Polymorphism (Rs7044343) and Risk of Allergic Rhinitis. Immunol Invest. 51 (1), 29-39, (2022).
- Kamel, M. A. et al. Association of serum CD14 level and functional polymorphism C-159T in the promoter region of CD14 gene with allergic rhinitis. Clin Exp Med. 23 (8), 4861-4869, (2023).
- Vishnoi, A. & Rani, S. miRNA Biogenesis and Regulation of Diseases: An Updated Overview. Methods Mol Biol. 2595 1-12, (2023).
- Vijayakumar, S., Yesudhason, B. V., Anandharaj, J. L., Kalaivanan, L. & Selvan Christyraj, J. R. S. Exosomes and Their miRNA as a Potential Biomarker in the Diagnosis of Parkinson's Disease. ACS Chem Neurosci. 16 (15), 2756-2766, (2025).
- Han, S., Ma, C., Bao, L., Lv, L. & Huang, M. miR-146a Mimics Attenuate Allergic Airway Inflammation by Impacted Group 2 Innate Lymphoid Cells in an Ovalbumin-Induced Asthma Mouse Model. Int Arch Allergy Immunol. 177 (4), 302-310, (2018).
- Yan, D. et al. Human Neutrophil Elastase Induces MUC5AC Overexpression in Chronic Rhinosinusitis Through miR-146a. Am J Rhinol Allergy. 34 (1), 59-69, (2020).
- Wang, J. et al. MiR-146a mimic attenuates murine allergic rhinitis by downregulating TLR4/TRAF6/NF-kappaB pathway. Immunotherapy. 11 (13), 1095-1105, (2019).
- Trinh, H. K. T. et al. Association of the miR-196a2, miR-146a, and miR-499 Polymorphisms with Asthma Phenotypes in a Korean Population. Mol Diagn Ther. 21 (5), 547-554, (2017).
- Jimenez-Morales, S. et al. MiR-146a polymorphism is associated with asthma but not with systemic lupus erythematosus and juvenile rheumatoid arthritis in Mexican patients. Tissue Antigens. 80 (4), 317-321, (2012).
- Bayar Muluk, N., Bafaqeeh, S. A. & Cingi, C. Anti-IgE treatment in allergic rhinitis. Int J Pediatr Otorhinolaryngol. 127 109674, (2019).
- Lv, R. et al. Research progress of anti-IGE treatment for allergic rhinitis. Am J Otolaryngol. 46 (3), 104646, (2025).
- Davila, I. et al. Genetic aspects of allergic rhinitis. J Investig Allergol Clin Immunol. 19 Suppl 1 25-31, (2009).
- Bogunia-Kubik, K. et al. Significance of Polymorphism and Expression of miR-146a and NFkB1 Genetic Variants in Patients with Rheumatoid Arthritis. Arch Immunol Ther Exp (Warsz). 64 (Suppl 1), 131-136, (2016).
- El-Akhras, B. A. et al. mir-146a genetic polymorphisms in systemic lupus erythematosus patients: Correlation with disease manifestations. Noncoding RNA Res. 7 (3), 142-149, (2022).
- Ghorab, R. A. et al. MiR-146a (rs2910164) Gene Polymorphism and Its Impact on Circulating MiR-146a Levels in Patients with Inflammatory Bowel Diseases. Inflammation. 48 (3), 1193-1205, (2025).
- Gong, H. B., Zhang, S. L., Wu, X. J., Pu, X. M. & Kang, X. J. Association of rs2910164 polymorphism in MiR-146a gene with psoriasis susceptibility: A meta-analysis. Medicine (Baltimore). 98 (6), e14401, (2019).
- Dong, J., Sun, D. & Lu, F. Association of two polymorphisms of miRNA-146a rs2910164 (G > C) and miRNA-499 rs3746444 (T > C) with asthma: a meta-analysis. J Asthma. 58 (8), 995-1002, (2021).
- Zhou, Z., Zhu, Y., Gao, G. & Zhang, Y. Long noncoding RNA SNHG16 targets miR-146a-5p/CCL5 to regulate LPS-induced WI-38 cell apoptosis and inflammation in acute pneumonia. Life Sci. 228 189-197, (2019).
- Olivieri, F. et al. miR-21 and miR-146a: The microRNAs of inflammaging and age-related diseases. Ageing Res Rev. 70 101374, (2021).
- Xiong, J. R. et al. miR-146a Regulates Neuroinflammation and Immune Cell Function in Neurodegenerative Diseases. Curr Med Sci. 45 (4), 725-744, (2025).
- Guo, H. et al. MiR-146a upregulates FOXP3 and suppresses inflammation by targeting HIPK3/STAT3 in allergic conjunctivitis. Ann Transl Med. 10 (6), 344, (2022).
- Yoshikawa, H. et al. miR-146a regulates emphysema formation and abnormal inflammation in the lungs of two mouse models. Am J Physiol Lung Cell Mol Physiol. 326 (1), L98-L110, (2024).