Integrated bioinformatics and experimental analyses identified LINC01871 as a potential predictor of cyclin-dependent kinase 4/6 inhibitor sensitivity and showed that LINC01871 overexpression suppresses breast cancer proliferation and is associated with reduced NF-κB signaling.
Research Article
LINC01871-Mediated Sensitivity to Cyclin-Dependent Kinase 4/6 Inhibitors in Human Breast Cancer
In This Article
Summary
Abstract
Breast cancer remains the most frequently diagnosed malignancy in women, and resistance to cyclin-dependent kinase 4 and 6 (CDK4/6) inhibitors limits long-term treatment efficacy. This study aimed to identify long non-coding RNAs (lncRNAs) associated with predicted sensitivity to CDK4/6 inhibitors and to investigate their biological functions in breast cancer. Transcriptomic data from The Cancer Genome Atlas (TCGA) and drug sensitivity data from the Genomics of Drug Sensitivity in Cancer 2 (GDSC2) database were integrated, and drug sensitivity was predicted using the oncoPredict algorithm. Candidate lncRNAs were identified through differential expression analysis, weighted gene co-expression network analysis, prognostic analysis, and machine learning. The biological functions of LINC01871 were subsequently evaluated using in vitro and in vivo experiments. Sixty-two lncRNAs associated with predicted sensitivity to ribociclib and palbociclib were identified, and six core lncRNAs were selected. LINC01871 showed the highest discriminatory performance for predicted drug sensitivity. Overexpression of LINC01871 was associated with increased sensitivity of breast cancer cells to ribociclib and palbociclib, inhibition of cell proliferation, promotion of apoptosis, and suppression of nuclear factor kappa B (NF-κB) signaling. Single-cell transcriptomic analysis demonstrated high LINC01871 expression in T cells and natural killer (NK) cells, while transcriptome-based immune infiltration analyses showed that high LINC01871 expression was associated with increased immune infiltration. These findings identify LINC01871 as a candidate biomarker of sensitivity to CDK4/6 inhibitors and demonstrate its tumor-suppressive effects in breast cancer. Further clinical and mechanistic studies are required to validate its predictive value and therapeutic relevance.
Introduction
Breast cancer remains a major cause of cancer mortality among women worldwide, despite continued advances in its clinical management1,2. Treatment has progressively expanded beyond endocrine therapy and chemotherapy to incorporate molecularly targeted approaches3. Among these, inhibitors of cyclin-dependent kinases 4 and 6 (CDK4/6), such as ribociclib, palbociclib, and abemaciclib, have produced substantial clinical benefits in estrogen receptor- and/or progesterone receptor-positive breast cancer4,5,6. Nevertheless, prolonged treatment can be accompanied by acquired resistance, which limits the durability of therapeutic benefit7.
CDK4/6 inhibition acts principally through the Rb–E2F cell-cycle regulatory axis. Inhibition of CDK4/6–cyclin D activity decreases phosphorylation of the retinoblastoma (Rb) protein, allowing hypophosphorylated Rb to restrain E2F-dependent transcription and consequently promote G1-phase arrest and limit tumor-cell proliferation8. Although several mechanisms contributing to CDK4/6 inhibitor resistance have been characterized, they do not fully account for differences in treatment response. These mechanisms include aberrant activation of the phosphatidylinositol 3-kinase/protein kinase B/mammalian target of rapamycin (PI3K/AKT/mTOR) pathway and increased expression of cyclin–CDK complexes9,10. Notably, components of the PI3K/AKT/mTOR pathway are themselves therapeutic targets in advanced disease11. Collectively, these observations indicate that additional molecular determinants of CDK4/6 inhibitor sensitivity and resistance remain to be identified. The clinical relevance of predictive biomarkers is illustrated by emerging biomarker-guided strategies for HR-positive metastatic breast cancer. Serial analysis of circulating tumor DNA (ctDNA), for example, can detect the emergence of ESR1 mutations during CDK4/6 inhibitor-based treatment. The PADA-1 and SERENA-6 studies showed that such molecular detection can inform an early change in endocrine therapy while CDK4/6 inhibition is maintained12,13. ESR1 mutations, however, represent only one determinant of therapeutic response and cannot explain all instances of sensitivity or resistance. This limitation has increasing clinical relevance because patients with HR-positive/HER2-negative metastatic breast cancer who progress during CDK4/6 inhibitor-based treatment now have several subsequent therapeutic options, including oral selective estrogen receptor degraders, PI3K/AKT pathway inhibitors, and antibody–drug conjugates. Identifying additional candidate biomarkers associated with differential CDK4/6 inhibitor sensitivity may therefore help distinguish patients more likely to benefit from these therapies from those who may require earlier treatment adaptation.
Long non-coding RNAs (lncRNAs) are transcripts without protein-coding capacity that participate in the regulation of numerous biological processes. Several lncRNAs have been implicated in cancer progression and treatment response. In oral squamous cell carcinoma, LOC100506114 has been reported to promote proliferation and migration through its interaction with the transcription factor RUNX and subsequent regulation of downstream gene expression14. In breast cancer, HISLA has been associated with increased glycolysis and enhanced resistance to apoptosis15, while LINC02568 contributes to endocrine resistance through regulation of ESR1 and CA1216. Despite the recognized involvement of lncRNAs in cancer biology, their relationship with CDK4/6 inhibitor resistance remains insufficiently characterized. In this study, an integrated multi-omics and machine-learning strategy was used to identify lncRNAs associated with predicted sensitivity to ribociclib and palbociclib, from which LINC01871 emerged as a candidate. We subsequently examined the association of LINC01871 with sensitivity to both agents and assessed its effects on breast cancer cell proliferation using in vitro and in vivo experimental approaches.
Protocol
All procedures involving animals were performed under institutional animal-welfare requirements and received approval from the Animal Ethical and Welfare Committee of Fujian Cancer Hospital & Fujian Medical University Cancer Hospital (Approval No. SQ2021-159-01).
Data acquisition
Bulk transcriptomic profiles were downloaded from TCGA in January 2025 and converted to transcripts per million (TPM) before downstream analysis. Single-cell RNA-sequencing data were obtained from the Gene Expression Omnibus (GEO), using dataset GSE161529.
Drug sensitivity estimation of ribociclib and palbociclib
GDSC2 data were used to train the drug-response prediction model, and TCGA-BRCA transcriptomic profiles were used as the test dataset. Clinical information required for the subgroup analysis was retrieved from the TCGA Pan-Cancer Atlas Clinical with Follow-up dataset. Four clinical variables were considered: ER status (breast_carcinoma_estrogen_receptor_status), PR status (breast_carcinoma_progesterone_receptor_status), HER2 status determined by IHC (lab_proc_her2_neu_immunohistochemistry_receptor_status), and HER2 status determined by FISH (lab_procedure_her2_neu_in_situ_hybrid_outcome_type). A tumor was classified as HR-positive if either ER or PR was annotated as “Positive.” A tumor was classified as HER2-negative when at least one of the HER2 IHC or FISH results was negative and neither test had a positive result. Cases for which HR or HER2 status could not be definitively determined were excluded. Using these criteria, 601 patients were identified as HR-positive/HER2-negative. Among them, 599 had corresponding records in both the Pan-Cancer clinical dataset and the TCGA-BRCA expression matrix and were included in the subgroup analysis. Ribociclib and palbociclib IC₅₀ values were estimated with the oncoPredict R package (version 1.2) using default parameters. Scatter plots generated with ggplot2 were used to display the distribution of predicted IC₅₀ values among patients. Patients within the highest 25% of predicted IC₅₀ values were designated as resistant, whereas those within the lowest 25% were designated as sensitive.
Identification of CDK4/6 inhibitor resistance–related genes
Differential expression between the predicted sensitive and resistant groups was assessed using the limma package, and the resulting gene-expression patterns were displayed as volcano plots with ggplot2. Weighted gene co-expression network analysis (WGCNA) was then conducted with the WGCNA package to identify expression modules associated with resistance to both CDK4/6 inhibitors. Genes shared across the four resulting datasets were identified and illustrated using the VennDiagram package. The intersecting genes were subsequently evaluated by Kaplan–Meier survival analysis and univariate Cox regression using the survival and survminer packages, with corresponding survival curves generated for visualization. Genes reaching statistical significance in both survival analyses were entered into LASSO regression with the glmnet package to select core prognostic factors. The ability of the selected genes to discriminate predicted drug resistance was then assessed by ROC analysis using pROC, with performance quantified by the area under the ROC curve. AUC values for the different drugs were compared graphically using bar plots generated with ggplot2.
Single-gene analysis of LINC01871
LINC01871 expression was first compared between tumor and normal tissues by differential expression analysis. Its prognostic association across multiple cancer types was subsequently examined by Kaplan–Meier survival analysis and univariate Cox regression using the survival and survminer R packages. Differences in LINC01871 expression among clinicopathological groups were assessed with the Wilcoxon rank-sum test and displayed as boxplots using ggpubr. For the single-cell RNA-sequencing analysis, data preprocessing and downstream analysis were carried out with Seurat. Inter-batch variation was corrected using Harmony with its default parameter settings. Following batch correction, the resulting cell clusters were represented in a UMAP embedding. Cell identities were then assigned automatically with SingleR using reference transcriptomic profiles.
Functional enrichment analysis
Genes showing differential expression between the high- and low-LINC01871 groups were determined with the limma package. In parallel, Pearson correlation analysis was used to identify mRNAs whose expression levels were correlated with LINC01871 expression. GO and KEGG enrichment analyses were subsequently conducted with clusterProfiler. The resulting enrichment profiles were presented as bar and bubble plots generated using ggplot2.
Immune infiltration analysis
Immune cell infiltration was initially characterized using CIBERSORT with the LM22 signature matrix, which was applied to estimate the relative distribution of 22 immune cell populations. Differences in these estimates between the high- and low-LINC01871 expression groups were visualized using ggpubr. Stromal, immune, and ESTIMATE scores were then calculated for individual samples with the estimate package and displayed as violin plots. In addition, single-sample gene set enrichment analysis (ssGSEA) was performed using the GSVA package to estimate the relative abundance of immune cell populations in each sample. Differences in the resulting immune infiltration estimates between the two LINC01871 expression groups were evaluated and visualized with ggpubr.
Cell culture
MDA-MB-231, MCF-10A, and HEK293T cell lines were used in this study. MDA-MB-231 and HEK293T cells were grown in DMEM containing 10% fetal bovine serum, whereas MCF-10A cells were maintained in medium specifically formulated for this cell line. Cultures were kept at 37°C under humidified conditions with 5% CO₂. To establish LINC01871-overexpressing cells, the LINC01871 overexpression construct and lentiviral packaging plasmids were co-transfected into HEK293T cells for lentiviral production. Virus-containing supernatant was subsequently harvested and used to transduce MDA-MB-231 cells. Transduced cells were selected with 1 μg/mL puromycin. Wild-type control and transduced cells were both subjected to puromycin treatment, and selection was terminated after 3–4 days once all wild-type control cells had died.
Reverse transcription quantitative polymerase chain reaction (RT-qPCR)
Cellular RNA was isolated using RNAiso Plus reagent, and RNA concentrations were adjusted to equivalent levels before reverse transcription. Complementary DNA (cDNA) was generated with a reverse transcription kit following the manufacturer’s protocol. RT-qPCR amplification began with denaturation at 95°C for 30 s and was followed by 40 cycles consisting of 95°C for 5 s, 60°C for 30 s, and 72°C for 30 s. Transcript abundance was determined by the 2−ΔΔCt method using GAPDH for normalization. Primer sequences used for the analysis are listed in Supplementary Table 1.
Cell proliferation and cytotoxicity assays
For assessment of drug cytotoxicity, 8,000 cells per well were plated in 96-well plates and allowed to grow for 24 h. The culture medium was subsequently exchanged for fresh medium containing the indicated drug concentrations, followed by a further 24 h of incubation. CCK-8 reagent was then applied, and the plates were maintained in the dark for 2 h before absorbance was recorded at 450 nm. These measurements were used to construct drug dose–response curves and determine IC₅₀ values. For proliferation measurements, cells were prepared at a density of 1,000 cells/mL, and 100 μL of the cell suspension was added to each well of a 96-well plate. CCK-8 measurements were performed at 24 h intervals. At each time point, the reagent was added and the plates were incubated in the dark for 2 h before absorbance was measured at 450 nm to assess cell proliferation.
Colony formation assay
For colony formation experiments, 1,000 cells were plated per well in 6-well plates, with three replicates included for each experimental group. Cells were maintained for 1–2 weeks to permit visible colony development. The medium was then discarded, and the cells were fixed in 4% paraformaldehyde, rinsed with PBS, and subsequently stained with 1% crystal violet.
5-Ethynyl-2′-deoxyuridine incorporation assay
Cells from each experimental group were plated in 12-well plates and maintained overnight. The following day, cells were exposed to the EdU working solution for 2 h. After fixation and permeabilization, EdU labeling was carried out, followed by nuclear counterstaining with Hoechst. Fluorescence microscopy was then used to acquire images for evaluation of EdU incorporation.
Western blot
Cells were lysed in RIPA buffer supplemented with protease and phosphatase inhibitors to obtain total protein. Protein concentrations were quantified by BCA assay. Following addition of loading buffer, the protein samples were denatured at 95°C and resolved by SDS–PAGE before transfer to PVDF membranes. The membranes were blocked at room temperature for 1 h and subsequently incubated with the designated primary antibodies at 4°C overnight (Supplementary Table 2). After three TBST washes, the corresponding secondary antibodies were applied for 45 min at room temperature. Protein signals were detected by enhanced chemiluminescence (ECL) and subsequently imaged. GAPDH or β-actin served as the loading control.
Flow cytometry analysis
For cell-cycle assessment, cells were collected by trypsinization, rinsed with PBS, and fixed overnight in 70% ethanol at 4°C. The fixed cells were washed again with PBS and incubated with a cell-cycle detection reagent before flow cytometric measurement. For apoptosis assessment, harvested cells were washed with PBS and suspended in binding buffer. The cell suspension was stained with Annexin V and propidium iodide (PI) for 10–15 min at room temperature under light-protected conditions. Flow cytometry was subsequently performed to quantify the apoptotic cell populations.
Xenograft mouse models
In vivo experiments were conducted using five-week-old NOD/ShiLtJGpt immunodeficient mice. Animals were maintained in a specific pathogen-free (SPF) facility on a 12 h light/dark schedule, with no more than four animals housed in each cage. Before tumor-cell implantation, mice were anesthetized by inhaled isoflurane. Following confirmation of adequate anesthesia, the animals were allocated to two groups and received abdominal fat-pad injections of either control or LINC01871-overexpressing MDA-MB-231 cells. Tumor growth was designated as the primary outcome. Tumor dimensions were recorded with calipers at intervals of 3–4 days. Tumor volume was determined as V = ( L x W2 ) / 2', where L denotes the longest tumor diameter and W the shortest, with volume expressed in mm3. The study was terminated before any tumor reached a maximum diameter of 1.5 cm or a volume of 2,000 mm3. At the experimental endpoint, mice were anesthetized with isoflurane, and cervical dislocation was performed only after deep anesthesia had been confirmed. Animals were euthanized before the scheduled endpoint if substantial signs of distress were observed, including lethargy, weight loss, hunched posture, or inability to eat or drink. At study completion, tumors were removed and subsequently weighed and imaged.
Statistical analysis
Data analyses were conducted using GraphPad Prism version 10.3.1 and R version 4.3.1. The statistical method applied to each comparison was selected according to the study design and distribution of the corresponding data. As appropriate, analyses included Student’s t-test, paired t-test, Wilcoxon signed-rank test, Mann–Whitney U test, one-way or two-way analysis of variance (ANOVA), Kaplan–Meier analysis with the log-rank test, univariate Cox proportional hazards regression, and Pearson or Spearman correlation analysis. Statistical significance was defined using a two-sided P value <0.05.
Results
LINC01871 Is Closely Associated with Sensitivity to Ribociclib and Palbociclib
Predicted IC50 values for ribociclib and palbociclib were estimated for patients in the TCGA-BRCA cohort using GDSC2 data and arranged in ascending order. Patients within the lowest quartile of predicted IC50 values were assigned to the sensitive group, whereas those within the highest quartile were assigned to the resistant group (Figure 1A,B). Comparison of these groups identified differentially expressed lncRNAs for each drug (Supplementary Figure 1A,B). WGCNA further identified lncRNA modules significantly associated with predicted sensitivity to ribociclib and palbociclib (Figure 1C,D; Supplementary Figure 1C,D). Integration of the four resulting gene sets yielded 62 shared lncRNAs (Figure 1E), of which 18 were significantly associated with prognosis in both univariate Cox regression and Kaplan–Meier survival analyses. LASSO regression was then applied to further refine this set, resulting in six prognostically relevant lncRNAs: ANKRD44-AS1, AC083837.1, AC242842.1, DBH-AS1, LINC00926, and LINC01871 (Figure 1F,G; Supplementary Figure 2A). Their ability to discriminate predicted drug resistance was subsequently compared by AUC analysis. Among the six candidates, LINC01871 yielded the highest average AUC across ribociclib and palbociclib (Figure 1H–J; Supplementary Figure 2B,C).
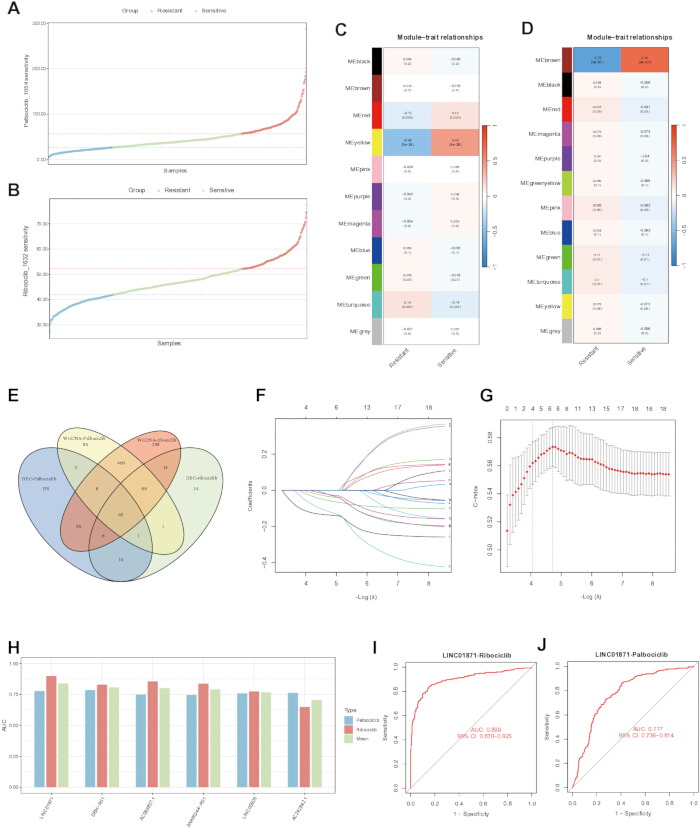
Figure 1. Identification of long non-coding RNAs associated with predicted sensitivity to ribociclib and palbociclib.
(A,B) Distribution of predicted half-maximal inhibitory concentration (IC50) values for palbociclib (A) and ribociclib (B) in the The Cancer Genome Atlas breast invasive carcinoma (TCGA-BRCA) cohort, estimated using the Genomics of Drug Sensitivity in Cancer 2 (GDSC2) dataset. (C,D) Weighted gene co-expression network analysis (WGCNA) showing module–trait associations for palbociclib (C) and ribociclib (D). (E) Venn diagram illustrating genes shared among the differentially expressed gene sets and WGCNA-derived gene sets associated with the two drugs. (F,G) Least absolute shrinkage and selection operator (LASSO) regression for selection of prognostically relevant long non-coding RNAs (lncRNAs). (H) Comparison of area under the receiver operating characteristic curve (AUC) values for the six lncRNAs selected by LASSO. (I,J) Receiver operating characteristic (ROC) curves assessing the ability of LINC01871 to discriminate predicted sensitivity to ribociclib (I) and palbociclib (J). Please click here to view a larger version of this figure.
Overexpression of LINC01871 Enhanced Drug Sensitivity in Breast Cancer Cells
Within the TCGA-BRCA cohort, higher LINC01871 expression was associated with lower predicted IC50 values for both ribociclib and palbociclib (Figure 2A,B). This relationship was further examined in the clinically relevant HR-positive/HER2-negative subgroup (n = 599). In this subgroup, predicted IC50 values for both agents were significantly lower among patients with high LINC01871 expression than among those with low expression. Furthermore, LINC01871 expression was inversely correlated with the predicted IC50 values of ribociclib and palbociclib (Supplementary Figure 3A,B). The computational association was subsequently examined experimentally. Cytotoxicity assays demonstrated greater sensitivity to both ribociclib and palbociclib in LINC01871-overexpressing breast cancer cells than in vector-control cells (Figure 2C,D). Flow cytometry showed a higher proportion of cells in G1 phase and a lower proportion in S phase following LINC01871 overexpression, consistent with enhanced G1-phase arrest (Figure 2E). In colony formation assays, increasing concentrations of either ribociclib or palbociclib progressively reduced colony formation (Figure 2F,G). At equivalent drug concentrations, colony-forming capacity was significantly lower in LINC01871-overexpressing cells than in vector-control cells. Western blot analysis additionally revealed lower levels of CDK4, CDK6, and cyclin D1, accompanied by reduced RB phosphorylation, in LINC01871-overexpressing cells (Figure 2H). These molecular changes were consistent with the greater G1-phase arrest observed following LINC01871 overexpression.
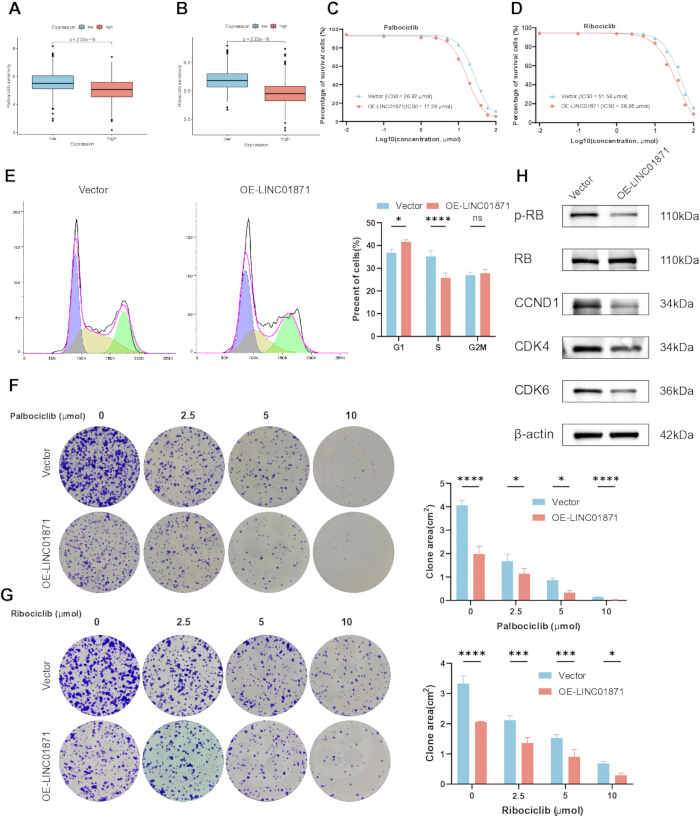
Figure 2. Association of LINC01871 overexpression with sensitivity to cyclin-dependent kinase 4/6 inhibitors in breast cancer cells. (A,B) Predicted sensitivity to palbociclib (A) and ribociclib (B) according to low or high LINC01871 expression. (C,D) Drug dose–response curves for palbociclib (C) and ribociclib (D) in vector-control and LINC01871-overexpressing cells, with the corresponding half-maximal inhibitory concentration (IC50) values indicated in each panel. (E) Flow cytometric assessment of cell-cycle distribution in vector-control and LINC01871-overexpressing cells. (F,G) Colony formation following treatment with increasing concentrations of palbociclib (F) and ribociclib (G). (H) Western blot assessment of cyclin-dependent kinase 4 (CDK4), cyclin-dependent kinase 6 (CDK6), cyclin D1 (CCND1), retinoblastoma protein (RB), and phosphorylated RB (p-RB), with β-actin serving as the loading control. OE-LINC01871, LINC01871 overexpression; ns, not significant. All experiments were independently conducted in triplicate. Data are presented as mean ± SD. IC50 values were determined by nonlinear regression. Cell-cycle distribution and colony formation data were analyzed using two-way ANOVA. *P < 0.05, **P < 0.01, ***P < 0.001, and ****P < 0.0001; ns, not significant. Please click here to view a larger version of this figure.
Patients with High LINC01871 Expression Tended to Have Favorable Clinical Outcomes
The prognostic association of LINC01871 was further examined in the TCGA-BRCA cohort. Kaplan–Meier analyses indicated that higher LINC01871 expression was generally associated with longer overall survival and progression-free interval (Figure 3A; Supplementary Figure 3C). Comparisons of both paired and unpaired samples also revealed significantly lower LINC01871 expression in tumor tissues than in normal tissues (Figure 3B,C). We next examined the relationship between LINC01871 expression and clinicopathological features. Lower LINC01871 expression tended to be associated with larger tumor size and was observed in patients recorded as deceased compared with those recorded as alive (Figure 3D,E). Among patients who received radiotherapy, subgroup analysis further showed significantly more favorable survival outcomes in those with high LINC01871 expression (Supplementary Figure 3D). A prognostic nomogram incorporating LINC01871 expression together with multiple clinical characteristics was subsequently developed (Supplementary Figure 3E). Calibration analysis showed close agreement between the survival probabilities estimated by the nomogram and the observed outcomes (Supplementary Figure 3F).
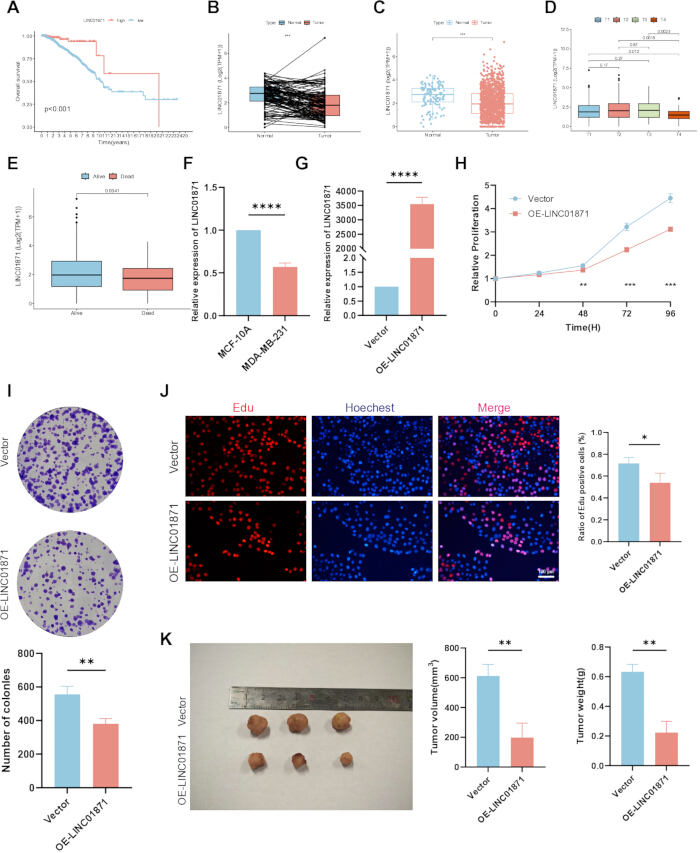
Figure 3. LINC01871 expression, prognostic associations, and suppression of breast cancer proliferation.
(A) Kaplan–Meier analysis of overall survival stratified by LINC01871 expression. (B,C) Paired (B) and unpaired (C) analyses comparing LINC01871 expression between normal and tumor tissues. (D,E) LINC01871 expression in relation to tumor T category (D) and survival status (E). (F) Comparison of relative LINC01871 expression between MCF-10A and MDA-MB-231 cells. (G) Reverse transcription quantitative polymerase chain reaction confirmation of LINC01871 overexpression in MDA-MB-231 cells. (H–J) Evaluation of cell proliferation by Cell Counting Kit-8 (CCK-8) assay (H), colony formation assay (I), and 5-ethynyl-2′-deoxyuridine (EdU) incorporation assay (J). The scale bar in panel J represents 100 μm. (K) Xenograft tumor appearance, volume, and weight in the vector-control and LINC01871-overexpression groups. TPM, transcripts per million; OE-LINC01871, LINC01871 overexpression. Overall survival was evaluated by Kaplan–Meier analysis with the log-rank test. Paired comparisons between tumor and normal tissues were assessed using the Wilcoxon signed-rank test. For the remaining two-group comparisons, an unpaired Student’s t-test or Mann–Whitney U test was selected after evaluating normality with the Shapiro–Wilk test. CCK-8 measurements were analyzed by two-way analysis of variance. In vitro experiments comprised three independent biological replicates, whereas xenograft experiments included three mice in each group. Data are presented as mean ± standard deviation. *P < 0.05, **P < 0.01, ***P < 0.001, and ****P < 0.0001; ns, not significant. Please click here to view a larger version of this figure.
Overexpression of LINC01871 Suppresses Tumor Cell Proliferation and Is Associated with Reduced NF-κB Signaling
The inhibitory effect of LINC01871 on tumor cell proliferation was further examined using in vitro and in vivo models. LINC01871 expression was significantly higher in the normal breast epithelial cell line than in the breast cancer cell line (Figure 3F). Successful establishment of the LINC01871-overexpression model was confirmed by RT-qPCR, which showed markedly elevated LINC01871 expression relative to the vector-control group (Figure 3G). CCK-8 assays subsequently revealed significantly reduced proliferative capacity in LINC01871-overexpressing cells (Figure 3H). Consistent with this finding, LINC01871 overexpression decreased colony-forming ability (Figure 3I) and reduced the proportion of EdU-positive cells (Figure 3J). In the xenograft model, tumors derived from LINC01871-overexpressing cells were significantly smaller than those derived from vector-control cells (Figure 3K).
To explore potential mechanisms underlying these effects, functional enrichment analyses were conducted using two gene sets: genes differentially expressed between the high- and low-LINC01871 expression groups and genes identified as co-expressed with LINC01871 by Pearson correlation analysis. GO analysis of these gene sets revealed associations with several immune-related functions, including T-cell receptor binding, major histocompatibility complex (MHC) protein complex binding, positive regulation of leukocyte activation, and immune receptor activity (Figure 4A,C). KEGG analysis similarly identified immune-associated pathways, including T-cell receptor signaling and the programmed death-ligand 1 (PD-L1) expression and programmed cell death protein 1 (PD-1) checkpoint pathway in cancer. Enrichment was also observed for the Janus kinase/signal transducer and activator of transcription (JAK-STAT) and NF-κB signaling pathways (Figure 4B,D). Because NF-κB signaling was identified in both enrichment analyses, its activity was further examined by western blotting. P65 phosphorylation was markedly lower in LINC01871-overexpressing cells than in the control group (Figure 4E), a finding consistent with reduced NF-κB pathway activation. The relationship between LINC01871 overexpression and apoptosis was also evaluated. Western blotting showed increased expression of the pro-apoptotic protein Bax and decreased expression of the anti-apoptotic protein Bcl-2 following LINC01871 overexpression (Figure 4F). Flow cytometry further revealed a significantly greater proportion of apoptotic cells in the LINC01871-overexpression group than in the vector-control group (Figure 4G).
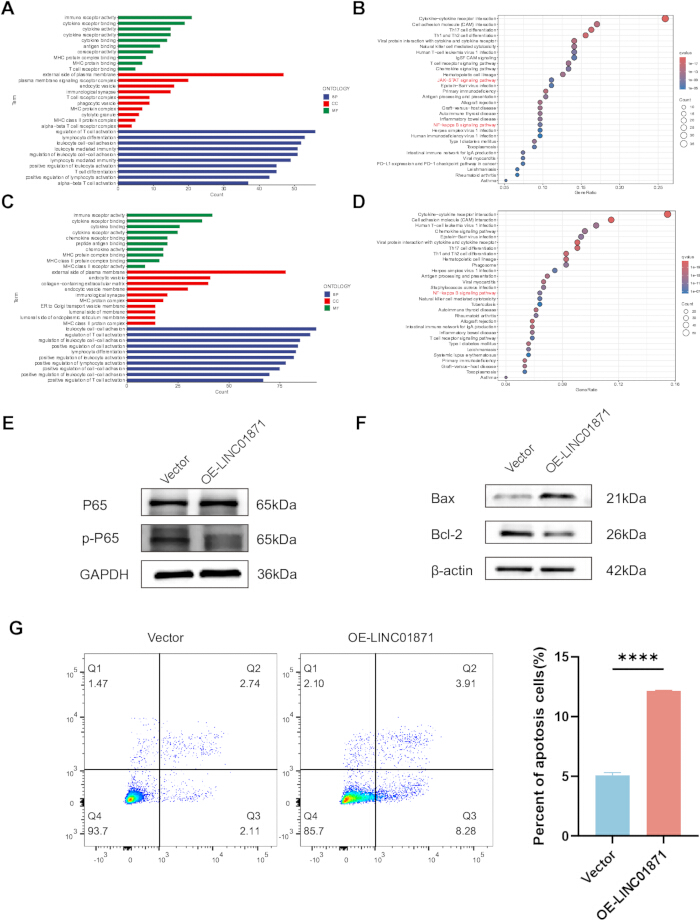
Figure 4. Association of LINC01871 with nuclear factor kappa B signaling and apoptosis.
(A,B) Gene Ontology (GO) (A) and Kyoto Encyclopedia of Genes and Genomes (KEGG) (B) enrichment analyses of genes showing differential expression between the high- and low-LINC01871 expression groups. (C,D) GO (C) and KEGG (D) enrichment analyses of genes co-expressed with LINC01871. (E) Western blot assessment of nuclear factor kappa B (NF-κB) pathway proteins P65 and phosphorylated P65 (p-P65), with glyceraldehyde-3-phosphate dehydrogenase (GAPDH) serving as the loading control. (F) Western blot assessment of the apoptosis-related proteins B-cell lymphoma 2 (Bcl-2) and Bcl-2-associated X protein (Bax), using β-actin as the loading control. (G) Flow cytometric assessment and quantification of apoptosis in vector-control and LINC01871-overexpressing cells. All in vitro experiments included three independent biological replicates. The western blot images shown are representative of three independent biological experiments. Data are presented as mean ± SD. Comparisons between vector-control and LINC01871-overexpressing cells were performed using an unpaired Student’s t-test or Mann–Whitney U test following assessment of normality with the Shapiro–Wilk test. *P < 0.05, **P < 0.01, ***P < 0.001, and ****P < 0.0001; ns, not significant. Please click here to view a larger version of this figure.
Pan-Cancer Analysis of LINC01871
Given the tumor-suppressive features associated with LINC01871 in breast cancer, we extended the analysis across multiple cancer types to characterize its expression and prognostic associations. Differential expression of LINC01871 was observed in several malignancies in addition to breast cancer (Figure 5A). In colon adenocarcinoma (COAD), kidney renal clear cell carcinoma (KIRC), kidney renal papillary cell carcinoma (KIRP), lung squamous cell carcinoma (LUSC), and thyroid carcinoma (THCA), significant differences between tumor and normal tissues were detected in both paired and unpaired comparisons (Figure 5B). Survival analyses further identified significant prognostic associations for LINC01871 in head and neck squamous cell carcinoma (HNSC), KIRC, brain lower grade glioma (LGG), rectum adenocarcinoma (READ), skin cutaneous melanoma (SKCM), uterine corpus endometrial carcinoma (UCEC), bladder urothelial carcinoma (BLCA), liver hepatocellular carcinoma (LIHC), and prostate adenocarcinoma (PRAD) (Figure 5C–E).
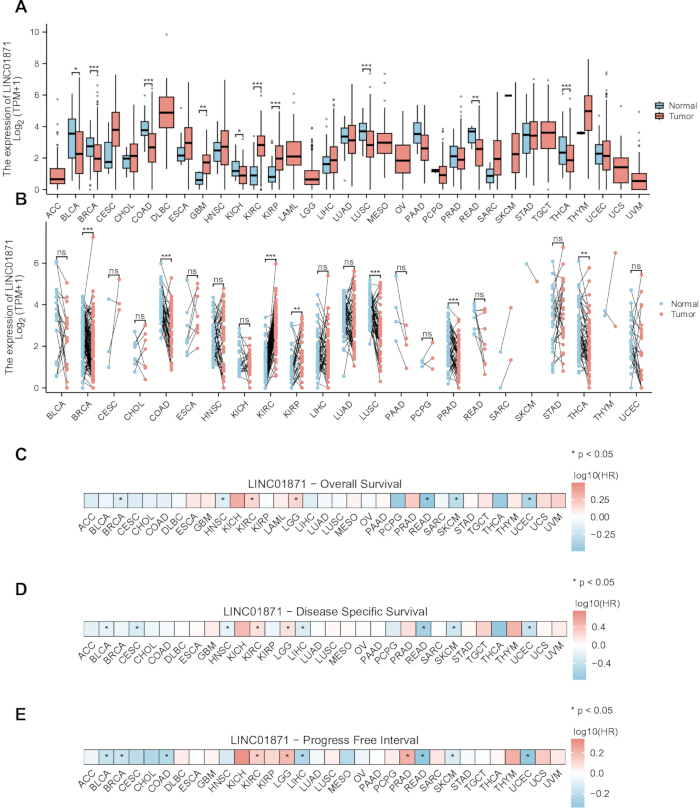
Figure 5. Pan-cancer expression and prognostic analyses of LINC01871.
(A,B) Comparison of LINC01871 expression between tumor and normal tissues across multiple cancer types using unpaired (A) and paired (B) analyses. (C–E) Prognostic associations of LINC01871 showing log-transformed hazard ratios for overall survival (C), disease-specific survival (D), and progression-free interval (E). HR, hazard ratio; TPM, transcripts per million; ns, not significant. Cancer-type abbreviations are based on The Cancer Genome Atlas nomenclature. Unpaired tumor–normal data were evaluated using the Mann–Whitney U test (A), while paired tumor–normal data were evaluated using the Wilcoxon signed-rank test (B). Associations with overall survival, disease-specific survival, and progression-free interval were examined by univariate Cox proportional hazards regression (C–E). *P < 0.05, **P < 0.01, ***P < 0.001, and ****P < 0.0001; ns, not significant. Please click here to view a larger version of this figure.
Correlation Between LINC01871 Expression and Immune Cell Infiltration
We next characterized the cellular distribution of LINC01871 using single-cell RNA-sequencing data from breast cancer samples (GSE161529). Following quality control, correction of batch effects, clustering, and cell-type annotation, the identified populations included epithelial cells, CD8⁺ T cells, T cells, macrophages, fibroblasts, natural killer (NK) cells, and B cells (Figure 6A). Among these populations, LINC01871 expression was most prominent in T cells and NK cells (Figure 6B,C). We therefore further examined the relationship between LINC01871 and the immune microenvironment using transcriptome-based infiltration estimates. CIBERSORT analysis indicated that the high-LINC01871 expression group had higher estimated proportions of several immune populations, including CD8⁺ T cells, NK cells, and M1 macrophages, together with lower estimated proportions of regulatory T cells (Tregs) and M2 macrophages (Figure 6D). Similarly, ESTIMATE-derived immune scores were higher in samples with high LINC01871 expression (Figure 6E). Analysis by ssGSEA using previously reported immune-cell marker genes produced broadly consistent patterns (Figure 6F). Extending this analysis across cancer types showed significant correlations between LINC01871 expression and the estimated abundance of multiple immune cell populations (Figure 6G).
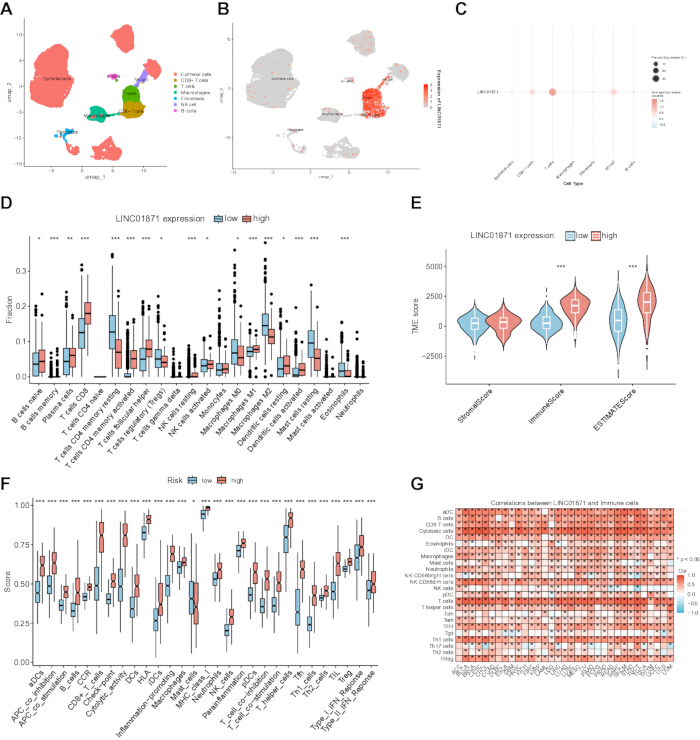
Figure 6. Single-cell expression and immune infiltration analyses of LINC01871.
(A) Uniform Manifold Approximation and Projection (UMAP) representation of annotated cell populations identified from single-cell RNA-sequencing data. (B) UMAP feature plot depicting the distribution of LINC01871 expression among the annotated cell populations. (C) Dot plot displaying the proportion of LINC01871-expressing cells and scaled average expression for each cell type. (D) Relative proportions of 22 immune cell populations in the low- and high-LINC01871 expression groups, estimated by Cell-type Identification by Estimating Relative Subsets of RNA Transcripts (CIBERSORT). (E) Stromal, immune, and tumor microenvironment scores derived using Estimation of STromal and Immune cells in MAlignant Tumour tissues using Expression data (ESTIMATE). (F) Immune-related scores obtained by single-sample gene set enrichment analysis (ssGSEA) in the low- and high-LINC01871 expression groups. (G) Pan-cancer associations between LINC01871 expression and immune cell infiltration estimated using ssGSEA. NK, natural killer; TME, tumor microenvironment. Cancer-type abbreviations are based on The Cancer Genome Atlas nomenclature. Differences between the low- and high-LINC01871 expression groups were evaluated using the Mann–Whitney U test (D–F). Pan-cancer associations between LINC01871 expression and immune cell infiltration were evaluated using Spearman correlation analysis (G). *P < 0.05, **P < 0.01, ***P < 0.001, and ****P < 0.0001; ns, not significant. Please click here to view a larger version of this figure.
Data Availability:
The datasets analyzed in this study are publicly available from The Cancer Genome Atlas (TCGA; https://portal.gdc.cancer.gov) and the Gene Expression Omnibus (GEO; https://www.ncbi.nlm.nih.gov/geo/). The datasets used include the TCGA-BRCA cohort and GSE161529 (https://www.ncbi.nlm.nih.gov/geo/query/acc.cgi?acc=GSE161529). Supplementary Figures 1–3 provide additional bioinformatic and prognostic analyses. Supplementary Table 1 lists the primer sequences used for reverse transcription quantitative polymerase chain reaction (RT-qPCR), and Supplementary Table 2 lists the primary and secondary antibodies used for western blot analysis. The R scripts used for the bioinformatic and statistical analyses are provided as Supplementary File 1.
Supplementary Figure 1. Identification of differentially expressed genes and weighted gene co-expression network modules associated with predicted CDK4/6 inhibitor sensitivity.
(A,B) Volcano plots showing differentially expressed genes between the predicted resistant and predicted sensitive groups for ribociclib (A) and palbociclib (B). (C,D) Cluster dendrograms generated by WGCNA showing gene clustering and module assignment for ribociclib (C) and palbociclib (D). Differentially expressed genes were defined as those with an absolute log2 fold change of ≥0.5 and an adjusted P value of <0.05. Please click here to download this file.
Supplementary Figure 2. Prognostic and predictive performance of five additional candidate lncRNAs.
(A) Kaplan–Meier survival analyses of five additional candidate lncRNAs identified by LASSO regression. (B,C) Receiver operating characteristic curve analyses showing the diagnostic performance of these five lncRNAs for predicting resistance to ribociclib (B) and palbociclib (C). Corresponding analyses of LINC01871 are presented in Figures 1 and 3. Please click here to download this file.
Supplementary Figure 3. Prognostic evaluation of LINC01871 in breast cancer.
(A) Predicted half-maximal inhibitory concentration (IC50) values for ribociclib and palbociclib in the high- and low-LINC01871 expression groups within the hormone receptor-positive/human epidermal growth factor receptor 2-negative (HR-positive/HER2-negative) subgroup. (B) Spearman correlation analyses between LINC01871 expression and predicted IC50 values for ribociclib and palbociclib in the HR-positive/HER2-negative subgroup. (C) Kaplan–Meier survival analysis of progression-free interval (PFI) according to LINC01871 expression. (D) Kaplan–Meier survival analysis of patients who received radiotherapy stratified by LINC01871 expression. (E) Nomogram integrating LINC01871 expression and clinicopathological characteristics for predicting overall survival in the overall TCGA-BRCA cohort. (F) Calibration curves evaluating the agreement between predicted and observed survival probabilities for the nomogram at 1, 3, and 5 years. Comparisons in panel A were analyzed using the Mann–Whitney U test, and correlations in panel B were assessed using Spearman correlation analysis. IC50, half-maximal inhibitory concentration; PFI, progression-free interval; HR, hormone receptor; HER2, human epidermal growth factor receptor 2. *P < 0.05, **P < 0.01, ***P < 0.001, and ****P < 0.0001; ns, not significant. Please click here to download this file.
Supplementary Table 1. Primer sequences used for reverse transcription quantitative polymerase chain reaction (RT-qPCR).
Forward and reverse primer sequences (5′→3′) used for RT-qPCR analysis of LINC01871 and the endogenous reference gene GAPDH. Please click here to download this file.
Supplementary Table 2. Primary and secondary antibodies used for western blot analysis.
Primary and secondary antibodies used for western blot analysis, including the target protein or antibody specificity, supplier, catalog number, host species, working dilution, and Research Resource Identifier (RRID). Please click here to download this file.
Supplementary File 1. R scripts used for bioinformatic and statistical analyses.
This supplementary file contains the R scripts used to generate the bioinformatic analyses and figures presented in this study, including transcriptomic analysis, differential expression analysis, weighted gene co-expression network analysis (WGCNA), least absolute shrinkage and selection operator (LASSO) regression, survival analysis, receiver operating characteristic (ROC) analysis, functional enrichment analysis, immune infiltration analysis, single-cell RNA sequencing analysis, and figure generation. Individual scripts correspond to the main and supplementary figures presented in the manuscript. Please click here to download this file.
Discussion
The expanding understanding of cancer biology has led to the identification of new therapeutic targets and established targeted therapies as an important component of cancer treatment17. However, the development of treatment resistance continues to limit their long-term effectiveness. In this study, integration of multi-omics analyses with machine-learning approaches identified LINC01871 as a candidate associated with predicted sensitivity to ribociclib and palbociclib. Experimental analyses further showed that LINC01871 overexpression increased sensitivity to both agents in vitro and suppressed breast cancer cell proliferation in cell-based and xenograft models. These effects were accompanied by reduced NF-κB pathway activity, suggesting a potential relationship between LINC01871 and this signaling pathway. These observations may be relevant to the increasing use of biomarkers to inform treatment decisions during CDK4/6 inhibitor-based therapy. However, the evidence supporting LINC01871 differs substantially from that available for established biomarker-guided approaches. For example, circulating tumor DNA monitoring of ESR1 mutations has undergone prospective evaluation as a strategy for adapting endocrine treatment. LINC01871, by contrast, remains a candidate biomarker and should not yet be considered suitable for clinical decision-making. This distinction is particularly important as treatment options after progression on CDK4/6 inhibitor-based therapy in HR-positive/HER2-negative metastatic breast cancer now include oral selective estrogen receptor degraders, PI3K/AKT pathway inhibitors, and antibody–drug conjugates18,19. Within this evolving therapeutic landscape, biomarkers capable of distinguishing differences in CDK4/6 inhibitor sensitivity could potentially assist treatment stratification. Although our findings support an association between LINC01871 and sensitivity to ribociclib and palbociclib, the evidence currently derives from computational estimates of drug sensitivity together with in vitro experiments. Prospective cohorts with documented CDK4/6 inhibitor exposure and clinical outcomes will therefore be required to determine whether LINC01871 has predictive value in patients.
The therapeutic benefit of CDK4/6 inhibitors in estrogen receptor- and/or progesterone receptor-positive breast cancer has been demonstrated in multiple clinical trials4,5,6. Their potential utility in triple-negative breast cancer has also attracted investigation20,21. For example, Yang et al. found that simultaneous targeting of CDK4/6 and CDK7 inhibited triple-negative breast cancer cell proliferation22. Other studies have identified molecular alterations that may modify responsiveness to CDK4/6 inhibition. GPX4 inhibition has been reported to increase palbociclib sensitivity in both estrogen receptor-positive and triple-negative breast cancer23, whereas C9orf142 has been associated with CDK4/6 inhibitor resistance in triple-negative breast cancer20. Conversely, inhibition of ACAA1 has been reported to enhance the sensitivity of breast cancer cells to CDK4/6 inhibitors24. Much of the existing work on molecular determinants of CDK4/6 inhibitor response has focused on protein-coding genes, leaving the contribution of lncRNAs less well characterized. Our findings extend this area by identifying LINC01871 as a potential non-coding RNA associated with CDK4/6 inhibitor response. Cytotoxicity and colony formation assays, together with flow cytometric assessment and analysis of cell cycle-related proteins, consistently associated LINC01871 overexpression with greater sensitivity to ribociclib and palbociclib. Separate proliferation assays and the xenograft model further supported an inhibitory association between LINC01871 overexpression and breast cancer growth.
To explore mechanisms that might underlie these observations, we examined the functional profiles of genes differentially expressed between the high- and low-LINC01871 groups and genes co-expressed with LINC01871. GO and KEGG analyses linked both gene sets to immune-related processes and NF-κB signaling. This finding is relevant to cell-cycle regulation because NF-κB signaling has previously been reported to increase cyclin D expression and thereby facilitate cell-cycle progression25,26. Zhou et al. further showed that NF-κB can interact with the CDK6 promoter and stimulate CDK6 transcription27. Crosstalk between NF-κB and the PI3K/AKT/mTOR pathway has also been described28, and the latter pathway is implicated in CDK4/6 inhibitor resistance11. Together, these observations provide a rationale for examining NF-κB activity in the context of LINC01871. Consistent with the enrichment results, LINC01871-overexpressing cells exhibited lower P65 phosphorylation. Nevertheless, these data establish an association rather than a direct regulatory mechanism, and how LINC01871 influences NF-κB signaling remains to be determined.
The immune microenvironment represents another potential contributor to CDK4/6 inhibitor response. γδ T cells, for example, have been reported to facilitate resistance through effects mediated by CX3CR1⁺ macrophages29. Luo et al. observed greater CD8⁺ T-cell and NK-cell infiltration in tumors from patients who developed resistance to CDK4/6 inhibitors at later time points30. Our single-cell analysis showed that LINC01871 expression was more prominent in T cells and NK cells than in epithelial cells. Complementary transcriptome-based analyses associated higher LINC01871 expression with greater estimated infiltration of CD8⁺ T cells, M1 macrophages, and NK cells and with lower estimated infiltration of M2 macrophages and Tregs. CD8⁺ T cells, M1 macrophages, and NK cells have been associated with antitumor immune activity, whereas M2 macrophages have been linked to tumor-promoting functions31,32,33,34. Taken together, our results suggest that higher LINC01871 expression may be associated with a more immune-active tumor microenvironment. This interpretation remains preliminary, however, because the immune-cell estimates were inferred from transcriptomic profiles rather than directly measured, and functional studies will be necessary to establish whether LINC01871 has a role in shaping the immune microenvironment.
Several limitations should be acknowledged when interpreting these findings. First, LINC01871 was identified through an integrative multi-omics analysis in which drug response was computationally inferred rather than obtained from patients receiving CDK4/6 inhibitors. Although direct in vitro experiments showed greater sensitivity to palbociclib and ribociclib following LINC01871 overexpression, these results do not establish its predictive value in patients. Independent cohorts with documented CDK4/6 inhibitor exposure and clinical response data will therefore be required to evaluate LINC01871 as a predictive biomarker. Second, the discovery analysis was initially conducted across the entire TCGA-BRCA cohort, which encompasses clinically heterogeneous breast cancer subtypes. The association between LINC01871 and predicted drug sensitivity was also observed within the HR-positive/HER2-negative subgroup; however, confirmation in clinically treated HR-positive/HER2-negative populations remains necessary. Third, our drug-response analyses were restricted to palbociclib and ribociclib because corresponding abemaciclib response data were not available in the GDSC2 dataset used for this study. Whether the observed association extends to abemaciclib therefore remains unknown. Fourth, despite the tumor-suppressive effects observed in the cell-based and xenograft experiments, the molecular link between LINC01871 and NF-κB signaling has not been established. Reduced P65 phosphorylation accompanied LINC01871 overexpression, but the mechanism responsible for this association requires further investigation. Similarly, the immune-related observations were derived primarily from transcriptome-based computational analyses and should be interpreted as associations rather than evidence that LINC01871 directly regulates the tumor immune microenvironment. Finally, CDK4/6 inhibitor resistance involves multiple biological processes, and LINC01871 is unlikely to account for the full complexity of treatment response. Further investigation should therefore incorporate subtype-specific cohorts, assessment of abemaciclib, experimental validation of the immune-related associations, mechanistic studies of the relationship between LINC01871 and NF-κB signaling, and prospective clinical evaluation to determine whether LINC01871 has utility as a predictive biomarker.
Disclosures
Conflict of Interest:
The authors declare that they have no competing interests.
Acknowledgements
This research was supported by the Natural Science Foundation of Fujian Province (Grant No. 2022J011056). The authors acknowledge The Cancer Genome Atlas (TCGA) and the Gene Expression Omnibus (GEO) for providing the publicly available datasets used in this study.
Materials
| Name | Company | Catalog Number | Comments |
|---|---|---|---|
| 25 G syringe needles | Beyotime | FS802-30pcs | Disposable syringe needles used for the mouth retractor and optional periodontal ligament pre-loosening |
| 4% paraformaldehyde solution | Solarbio | P1110 | 4% paraformaldehyde solution used for specimen fixation |
| 75% ethanol | Ouse Medical Devices Store | N/A | 75% medical-grade ethanol used for surface disinfection |
| C57BL/6 mice | Charles River | 213 | 8-week-old male C57BL/6 mice weighing 22–29 g |
| Carprofen | Solarbio | C5350 | Postoperative analgesic administered subcutaneously at 5 mg/kg |
| Cotton balls | Ouning Medical Devices | N/A | Sterile cotton balls used for oral cleaning and hemostasis |
| CTAn v1.18.4.0+ | SkyScan | N/A | Software used for μCT image analysis |
| DataViewer v1.5.6.2 | SkyScan | N/A | Software used for viewing and exporting reconstructed μCT images |
| Finger sleeves | LeSu Office | MEKU-1/2/3B | Finger sleeves used for thumb protection during extraction |
| Foam board | Dongguan Lijianglong Industrial Co., Ltd. | N/A | Foam board used as the operating and fixation platform |
| Gel diet | ReadyDietech | J10001 | Postoperative diet provided on the cage floor for 3 days, when used |
| GraphPad Prism v10.1.2 | GraphPad | RRID: SCR_002798 | Software used for statistical analysis and graph generation |
| Headlamp | Bazhou Pengen Protective Equipment Factory | N/A | Headlamp used to illuminate the surgical field |
| Heating pad | Shijiazhuang Jianuan Electrical Appliances Co., Ltd. | N/A | Heating pad preheated to approximately 38 °C for postoperative recovery |
| Hydroxyapatite phantom | QRM | QRM-70127 | Calibration phantom used to convert CT attenuation values into bone mineral density |
| Magnification device | Olympus Corporation | SZX10 | Device used to inspect the toothed tweezer tips and extraction socket under magnification |
| Mask | Senlun Medical Devices Specialty Store | N/A | Surgical mask |
| Micro-computed tomography scanner | Bruker SkyScan | SkyScan 1276 | μCT scanner used at 80 kV, 500 μA, and 10 μm voxel resolution |
| Mimics Research v21.0 | Materialise | RRID: SCR_015802 | Software used for three-dimensional reconstruction |
| Pentobarbital sodium | Sigma-Aldrich | P3761 | Pentobarbital sodium salt used as a 1% anesthetic solution |
| Phosphate-buffered saline solution | Solarbio | P1010 | 0.01 M phosphate-buffered saline powder, pH 7.2–7.4 |
| Povidone-iodine antiseptic solution | Belkon Pharmacy Flagship Store | N/A | Povidone-iodine solution used for abdominal disinfection |
| Rubber bands | Foshan Puli Rubber Products Factory | N/A | Rubber bands used to assemble the mouth retractor |
| Saline solution | Thermo Fisher | BR0053G | Saline tablets used to prepare the solution for oral cleaning |
| Standard chow diet | Jiangsu Xietong Pharmaceutical and Biotechnology Engineering Co., Ltd. | XTC01WC-001 | Standard chow used for routine housing and softened for postoperative feeding |
| Steam sterilizer | Institutional facility | N/A | Equipment used to sterilize the toothed tweezers and saline solution |
| Sterile cotton swabs | Kangbailai Medical Devices Store | N/A | Single-use sterile cotton swabs |
| Sterile gloves | Senlun Medical Devices Specialty Store | N/A | Sterile latex gloves |
| Sterile non-woven fabric | Shandong Xinhua Infection Control Supplies Hangzhou Store | N/A | Sterile non-woven fabric used to cover the operating surface and heating pad |
| Sterile surgical cap | Senlun Medical Devices Specialty Store | N/A | Sterile surgical cap |
| Surgical scrubs | Senlun Medical Devices Specialty Store | N/A | Clean surgical scrubs worn during the procedure |
| Tape | Thermo Fisher | 15947 | Adhesive tape used to secure the mouse limbs |
| Toothed ophthalmic tweezers | Beyotime | FS229 | Toothed ophthalmic forceps used as dental forceps |
| Veterinary ophthalmic ointment | Dechra Veterinary Products | 143-16 | Ophthalmic ointment applied after anesthesia to prevent corneal drying |
References
- Bray F, et al. Global cancer statistics 2022: GLOBOCAN estimates of incidence and mortality worldwide for 36 cancers in 185 countries. CA Cancer J Clin. 2024;74(3):229-63.
- Xiong X, et al. Breast cancer: Pathogenesis and treatments. Signal Transduct Target Ther. 2025;10(1):49.
- Ye F, et al. Advancements in clinical aspects of targeted therapy and immunotherapy in breast cancer. Mol Cancer. 2023;22(1):105.
- Johnston SRD, et al. Abemaciclib plus endocrine therapy for hormone receptor-positive, HER2-negative, node-positive, high-risk early breast cancer (monarchE): Results from a preplanned interim analysis of a randomised, open-label, phase 3 trial. Lancet Oncol. 2023;24(1):77-90.
- Slamon D, et al. Ribociclib plus endocrine therapy in early breast cancer. N Engl J Med. 2024;390(12):1080-91.
- Finn RS, et al. The cyclin-dependent kinase 4/6 inhibitor palbociclib in combination with letrozole versus letrozole alone as first-line treatment of oestrogen receptor-positive, HER2-negative, advanced breast cancer (PALOMA-1/TRIO-18): A randomised phase 2 study. Lancet Oncol. 2015;16(1):25-35.
- Morrison L, Loibl S, Turner NC. The CDK4/6 inhibitor revolution-a game-changing era for breast cancer treatment. Nat Rev Clin Oncol. 2024;21(2):89-105.
- Guo Z, et al. Cyclin-dependent kinase 4 and 6 inhibitors in breast cancer treatment. Oncogene. 2025;44(17):1135-52.
- Vora SR, et al. CDK4/6 inhibitors sensitize PIK3CA-mutant breast cancer to PI3K inhibitors. Cancer Cell. 2014;26(1):136-49.
- Foffano L, et al. Cyclin-dependent kinase 4 and 6 inhibitors (CDK4/6i): Mechanisms of resistance and where to find them. Breast. 2025;79:103863.
- Hao C, et al. PI3K/AKT/mTOR inhibitors for hormone receptor-positive advanced breast cancer. Cancer Treat Rev. 2025;132:102861.
- Bidard FC, et al. Switch to fulvestrant and palbociclib versus no switch in advanced breast cancer with rising ESR1 mutation during aromatase inhibitor and palbociclib therapy (PADA-1): A randomised, open-label, multicentre, phase 3 trial. Lancet Oncol. 2022;23(11):1367-77.
- Bidard FC, et al. First-line camizestrant for emerging ESR1-mutated advanced breast cancer. N Engl J Med. 2025;393(6):569-80.
- Zhang D, et al. Cancer-associated fibroblasts promote tumor progression by lncRNA-mediated RUNX2/GDF10 signaling in oral squamous cell carcinoma. Mol Oncol. 2022;16(3):780-94.
- Chen F, et al. Extracellular vesicle-packaged HIF-1α-stabilizing lncRNA from tumour-associated macrophages regulates aerobic glycolysis of breast cancer cells. Nat Cell Biol. 2019;21(4):498-510.
- Chen X, et al. Estrogen-induced lncRNA LINC02568 promotes estrogen receptor-positive breast cancer development and drug resistance through both in trans and in cis mechanisms. Adv Sci (Weinh). 2023;10(25):e2206663.
- Huang R, Zhou PK. DNA damage repair: Historical perspectives, mechanistic pathways and clinical translation for targeted cancer therapy. Signal Transduct Target Ther. 2021;6(1):254.
- Güren AK, et al. Post-CDK4/6 inhibitor treatment landscape in metastatic hormone receptor-positive breast cancer: A narrative review. Expert Rev Anticancer Ther. 2026;26(4):425-35.
- Güren AK, et al. Efficacy and safety of sacituzumab govitecan in hormone receptor-positive metastatic breast cancer: A systematic review and meta-analysis. J Oncol Pharm Pract. 2026. doi:10.1177/10781552261462434.
- Liao L, et al. C9orf142 transcriptionally activates MTBP to drive progression and resistance to CDK4/6 inhibitors in triple-negative breast cancer. Clin Transl Med. 2023;13(11):e1480.
- Zhu X, et al. Efficacy and mechanism of the combination of PARP and CDK4/6 inhibitors in the treatment of triple-negative breast cancer. J Exp Clin Cancer Res. 2021;40(1):122.
- Yang Y, et al. Dual inhibition of CDK4/6 and CDK7 suppresses triple-negative breast cancer progression via epigenetic modulation of SREBP1-regulated cholesterol metabolism. Adv Sci (Weinh). 2025;12(5):e2413103.
- Herrera-Abreu MT, et al. Inhibition of GPX4 enhances CDK4/6 inhibitor and endocrine therapy activity in breast cancer. Nat Commun. 2024;15(1):9550.
- Peng WT, et al. Inhibition of ACAA1 restrains proliferation and potentiates the response to CDK4/6 inhibitors in triple-negative breast cancer. Cancer Res. 2023;83(10):1711-24.
- Joyce D, et al. NF-κB and cell-cycle regulation: The cyclin connection. Cytokine Growth Factor Rev. 2001;12(1):73-90.
- Iwanaga R, et al. Activation of the cyclin D2 and CDK6 genes through NF-κB is critical for cell-cycle progression induced by HTLV-I Tax. Oncogene. 2008;27(42):5635-42.
- Zhou B, et al. Bortezomib suppresses self-renewal and leukemogenesis of leukemia stem cells by NF-κB-dependent inhibition of CDK6 in MLL-rearranged myeloid leukemia. J Cell Mol Med. 2021;25(6):3124-35.
- Yu M, et al. Baicalein increases cisplatin sensitivity of A549 lung adenocarcinoma cells via the PI3K/AKT/NF-κB pathway. Biomed Pharmacother. 2017;90:677-85.
- Petroni G, et al. IL-17A-secreting γδ T cells promote resistance to CDK4/CDK6 inhibitors in HR-positive/HER2-negative breast cancer via CX3CR1-positive macrophages. Nat Cancer. 2025;6(10):1656-75.
- Luo L, et al. Single-cell RNA sequencing identifies molecular biomarkers predicting late progression to CDK4/6 inhibition in patients with HR-positive/HER2-negative metastatic breast cancer. Mol Cancer. 2025;24(1):48.
- Komuro H, et al. Single-cell sequencing of CD8-positive tumor-infiltrating lymphocytes revealed the nature of exhausted T cells recognizing neoantigens and cancer/testis antigens in non-small cell lung cancer. J Immunother Cancer. 2023;11(8):e007180.
- Rafei H, et al. CREM is a regulatory checkpoint of CAR and IL-15 signalling in NK cells. Nature. 2025;643(8073):1076-86.
- Van Elsas MJ, et al. Immunotherapy-activated T cells recruit and skew late-stage activated M1-like macrophages that are critical for therapeutic efficacy. Cancer Cell. 2024;42(6):1032-50.e1010.
- Yang J, et al. STK11 coordinates IL-4 signaling with metabolic reprogramming to control M2 macrophage polarization and antitumor immunity. Sci Adv. 2025;11(39):eadx5495.