This protocol describes a structured service design methodology for diagnosing complex problems in low-risk public service application and consultation processes. The approach integrates stakeholder mapping, journey mapping, co-design, and low-fidelity prototyping, along with simulated, task-based evaluation of user behavior, decision-making, and service-material usability prior to implementation.
Method Article
A Systemic Service Design Visualization Protocol for Complex Problems in Low-risk Public Service Application and Consultation Processes
58 views
⸱
September 11th, 2026
In This Article
Summary
Abstract
Complex public service problems with wicked-like features, including multiple actors, fragmented information, unclear responsibility boundaries, and no single uncontested solution, are difficult to structure in routine administrative settings. This article presents a systematic service design visualization protocol for low-risk public service applications and consultation processes, defined as administrative services that do not determine medical treatment, legal status, financial eligibility, child protection, disciplinary outcomes, or other high-stakes rights-affecting decisions. The protocol integrates stakeholder mapping, public service journey mapping, Double Diamond co-design, and low-fidelity prototype testing to translate fragmented administrative challenges into actionable, co-designed service concepts and evaluate them using simulated tasks. In a representative low-risk administrative application pathway, simulated task testing with 28 participants (112 baseline and 112 post-prototype task records) showed shorter task completion times (178.4 ± 49.6 s–121.7 ± 38.2 s), fewer errors (1.86 ± 0.91–0.79 ± 0.63 errors per task), and higher task success (62.5%–82.1%) after exposure to protocol-generated materials. These findings represent task-based usability evidence because the fixed pre-/post-sequence may include learning effects. This reproducible protocol provides a structured, visually driven approach for diagnosing complex public service problems and prototyping solutions in low-risk public service environments.
Introduction
Public service organizations increasingly confront complex challenges that defy simple administrative adjustments. These issues are characterized by the involvement of multiple actors, fragmented responsibilities, uneven access to information, and tensions between standardized administrative procedures and diverse user needs. Rather than claiming that such problems can be solved through a fully reproducible formula, this protocol treats them as bounded, low-risk service problems with wicked-like features that can be structured, visualized, and explored through reproducible facilitation steps1,2. In routine public service delivery, these problems manifest as operational breakdowns: citizens struggle to identify required materials, frontline staff face repetitive inquiries, and administrators enforce rules that are not readily visible to end users.
To address these complexities, public service innovation has shifted from internal efficiency reforms toward participatory, user-centered approaches. Current research indicates that co-creation and co-production enable citizens, professionals, and organizations to contribute collaboratively to service innovation3,4,5. However, this participatory shift introduces a methodological challenge. Although diverse stakeholders may agree that a service is inefficient, they rarely reach consensus on where the structural breakdown occurs, who is most affected, or which specific interventions are required.
This protocol is intended for service design researchers, public administration researchers, municipal or university service improvement teams, and trained facilitators who require a repeatable approach to translating multi-actor complaints into visual diagnostic materials prior to implementation. It is most appropriate for low-risk applications, such as consultation, registration, status-checking, and follow-up services, in which users must interpret requirements, prepare materials, progress through multiple service stages, and coordinate with multiple actors. It should not be used as the primary method for emergency decision-making, highly standardized transactions with established one-step procedures, legal adjudication, medical treatment, child protection, immigration status decisions, financial aid determinations, disciplinary processes, or any setting that requires access to identifiable case files.
Compared with standalone stakeholder analysis, journey mapping, or participatory workshops, the proposed workflow links actor mapping, stage-specific service breakdowns, co-designed challenge formulation, and simulated prototype testing within a single auditable sequence. This integration helps prevent teams from moving directly from broad dissatisfaction to solution ideas without first identifying who is affected, where the breakdown occurs, and which materials can be tested safely. Recent public-sector and public health co-design reviews likewise emphasize the need for transparent processes, explicit facilitation, and careful evaluation of participation and power dynamics4,6,7,8,9.
Service design offers a practical framework for addressing this challenge through visual, participatory, and prototype-oriented methods6,8,10. Rather than treating service failures as abstract policy deficits, service design examines the interactions among users, staff, touchpoints, and backstage processes. Consequently, co-design is increasingly proposed within public administration as a means of engaging citizens in defining complex problems4,7,11. However, co-design initiatives often fall short when they lack a structured mechanism for translating subjective stakeholder experiences into testable public service materials or fail to explicitly manage power differences among participants.
A rigorous methodological transition requires the sequential integration of specific analytical tools. Stakeholder mapping serves as the diagnostic baseline by clarifying actor involvement, influence, dependencies, and information asymmetries12. Journey mapping is then used to identify specific pain points and ambiguities in responsibility across sequential service stages13. Subsequently, the Double Diamond framework provides a structured pathway for converting these mapped breakdowns into actionable design challenges, separating divergent problem exploration from convergent solution development7,8,14. Finally, low-fidelity prototype testing enables co-designed concepts to be evaluated safely before implementation—an essential step in public services, where premature changes can disrupt citizen access or increase administrative workloads15,16.
Despite growing methodological guidance on these tools, reproducibility remains a critical limitation in the public service co-design literature6,7,8,17. Many studies describe design workshops in broad terms, obscuring the precise analytical steps required for independent replication. A rigorous method should establish fixed stages, defined time allocations, standardized scoring rules, consistent visual outputs, and transparent decision criteria. Furthermore, it should clearly distinguish the evaluation of early-stage, task-based usability from broader claims regarding real-world agency performance.
This article presents a systematic service design visualization protocol developed to structure complex, multi-actor problems in low-risk public service innovation4,6,16,17. Designed specifically for public service application and consultation processes, the protocol sequentially integrates stakeholder mapping, journey mapping, a Double Diamond workshop, and prototype testing. The overall goal is to provide researchers and practitioners with a highly reproducible, step-by-step approach for moving from fragmented service complaints to visual diagnosis, objective problem definition, and the empirical testing of co-designed service concepts.
Protocol
The representative application reported in this article was approved by the Ethics Committee on Human Research Protection, City University of Macau, Macau, China (Approval No. 2600AL2401; valid from January 10, 2026, to January 10, 2028). Written or electronic informed consent was obtained from all participants before their participation. The protocol did not involve medical interventions, vulnerable populations, deception, biological samples, private financial data, individual performance evaluation, or access to official administrative records. The research tools used for the protocol are listed in the Table of Materials.
1. Participant recruitment and context definition
- Select a low-risk public service application and consultation process to evaluate, such as a municipal, university, or community administrative pathway that requires information search, eligibility clarification, material preparation, application submission, processing, notification, and follow-up support.
- Exclude contexts involving medical treatment, legal case handling, immigration status, child protection, financial aid determination, disciplinary procedures, emergency decisions, or official administrative records.
- Consider a public service issue suitable for this protocol when it displays at least three complex or wicked-like features: involvement of multiple stakeholder groups, unclear responsibility boundaries, repeated cross-actor coordination failures, incomplete or inconsistent service information, and the absence of a single agreed solution.
NOTE: Do not present the protocol as a solution to a fully wicked problem. Present it as structuring a bounded, low-risk public service problem for diagnosis, co-design, and simulated testing. - Recruit 80 – 120 participants for the questionnaire stage based on their familiarity with public service use, delivery, coordination, or management.
- Use this sample size as a pragmatic planning target to support stable descriptive stakeholder profiles across several role groups while remaining feasible for a non-interventional service design study.
- Select participants to represent all major stakeholder roles involved in the public service process.
- Assemble a subgroup of 20–30 participants to participate in the co-design workshop and prototype testing stages.
- Form 4–6 mixed-role workshop groups while keeping each group small enough to support active participation.
- Ensure that each mixed-role group includes at least three stakeholder categories, such as citizens, frontline service staff, community workers, or administrators.
- Separate citizens and service providers for the initial stakeholder-mapping discussions if power imbalances are expected.
- Conduct mixed-role synthesis after the initial discussions. During mixed-role synthesis, use structured turn-taking, silent idea writing, anonymous card submission, and anonymous dot voting to prevent administrators or professional staff from dominating citizen contributions.
- Pay careful attention to participant recruitment, role preparation, and conditions that allow users to contribute ideas rather than merely respond to expert-defined problems7,9,18.
- Instruct all participants not to disclose identifiable names, identity numbers, home addresses, phone numbers, case IDs, medical records, legal records, income records, or agency performance files.
- Assign non-identifiable participant codes (e.g., P001 and P002).
- Train all facilitators before data collection using the same facilitation script, sample pain-point cards, design challenge rubric, and prototype-scoring examples.
- CRITICAL STEP: Calibrate facilitators by asking them to independently classify at least five sample pain points and five draft "How might we" statements.
NOTE: Facilitators must reach at least 80% agreement on inclusion, clustering, and revision decisions before proceeding. - Discuss discrepancies until facilitators reach at least 80% agreement on inclusion, clustering, and revision decisions.
- Use at least two facilitators whenever possible: one lead facilitator to guide the discussion and one observer to record timing, participation balance, and protocol deviations.
- If multiple facilitators lead parallel groups, conduct a 15–20 min debrief after each major stage and document any differences in prompts or interpretation rules in the audit sheet.
CAUTION: After participant recruitment, consent, facilitator training, and material preparation are complete, investigators may pause before beginning Stage 1. Resume only after confirming that all participants have assigned codes and that all worksheets contain no identifying information.
2. Preparation of protocol materials
- Prepare the protocol materials before implementation.
- Prepare the participant information sheet, anonymous role-based questionnaire, stakeholder-mapping worksheet, five-point stakeholder-rating sheet, public service journey-mapping template, pain-point cards, design challenge template, solution cards, prototype-selection sheet, facilitator calibration rubric, simulated task sheets, task-set equivalence checklist, prototype-scoring rubric, coding sheet, analysis syntax or workflow notes, and de-identification checklist.
- Assign each study-specific material a stable internal identifier and version number.
- Organize the journey-mapping template into seven default stages: information search, eligibility or requirement clarification, material preparation, application submission, interdepartmental processing, outcome notification, and follow-up support.
- Adapt the stage names only after documenting how the selected service differs from the default low-risk administrative application pathway.
- Retain the same sequence of touchpoints, responsible actors, information inputs, outputs, pain points, and downstream consequences.
- Design simulated public service scenarios for the prototype task sheets without including any real personal, administrative, or agency data.
- Refer to Table 1 for the stages, time allocations, materials, and predefined outputs required for the protocol.
- Refer to Table 2 for the data collection items, scoring rules, validity thresholds, and data-protection controls.
- Use service design methods to make complex public service problems visible, discussable, and testable19.
Table 1: Protocol stages, timing, required materials, and predefined outputs. The workflow of the protocol includes the main activities, participants, estimated time allocation, required materials, and expected outputs for each stage.Please click here to download this Table.
Table 2: Data collection metrics, methods, exclusion criteria, and data protection controls. The metrics collected at each protocol stage, the corresponding data collection methods, the predefined exclusion criteria, and the measures implemented to protect participant confidentiality and data integrity.Please click here to download this Table.
3. Stage 1: Stakeholder mapping
- Instruct participants to use the stakeholder-mapping worksheet to individually list five to eight actors involved in the selected public service process.
- Allocate 25–35 min for the stakeholder-mapping stage.
- Refer to Figure 1 for the overall workflow of the visualization protocol.
- Direct participants to rate each listed actor on four dimensions using a five-point anchored scale (1 = very low; 5 = very high): influence on the service outcome, dependency on other actors, access to service information, and coordination pressure.
- Provide written examples before participants complete the ratings.
- Define high influence as an actor whose decision, delay, or interpretation substantially affects the service outcome.
- Define high dependency as an actor who cannot complete the service process without information, confirmation, or action from other actors.
- Calculate the mean score for each stakeholder group on each dimension.
- Flag a discrepancy of two points or more between stakeholder groups on the same dimension as a perception gap because it represents a shift of at least 40% of the five-point scale and is large enough to support workshop discussion rather than minor rating noise.
- Carry each flagged perception gap forward to the workshop discussion.
- Use the stakeholder-mapping results to make actor roles, dependencies, influence, and information asymmetries visible before redesign work begins20.
- Generate an actor-relationship profile containing stakeholder categories, mean dimension scores, and flagged perception gaps.
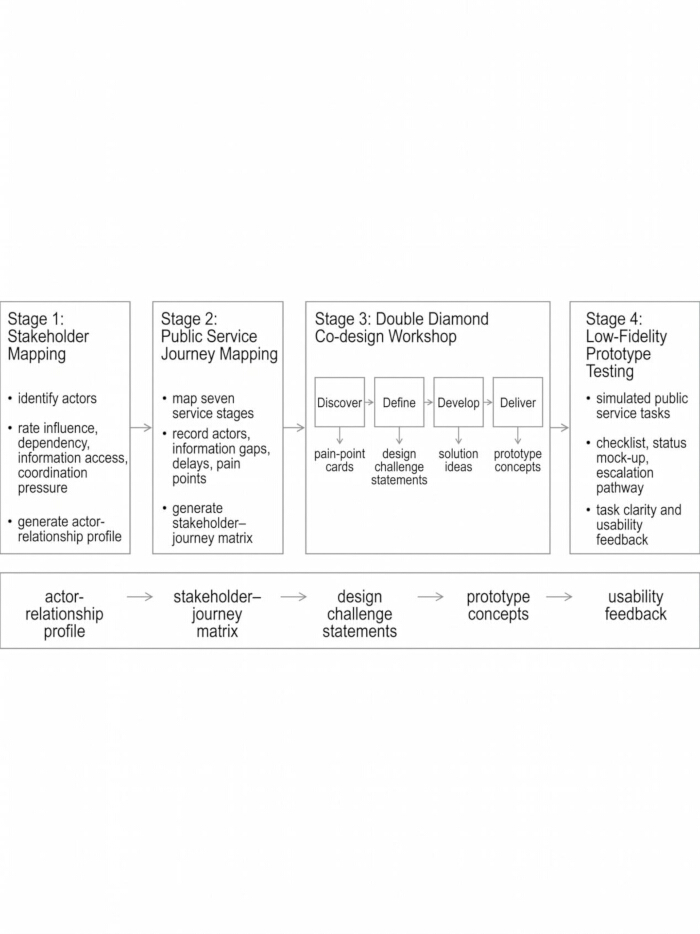
Figure 1: Overall workflow of the public service design visualization protocol. The workflow consists of four connected stages: stakeholder mapping, public service journey mapping, Double Diamond co-design, and prototype testing. The outputs include actor-relationship profiles, stakeholder-journey matrices, design challenge statements, prototype concepts, and early-stage usability feedback. The Discover, Define, Develop, and Deliver phases of the Double Diamond framework are highlighted to illustrate the transition from divergent exploration to convergent solution development. Please click here to view a larger version of this figure.
4. Stage 2: Public service journey mapping
- Guide the workshop subgroup to map the seven-stage service process.
- Allocate 45–60 min for this stage.
- Instruct participants to record the main actor, input information, output information, communication channel, typical delay, pain point, severity, and downstream consequence for each stage.
- Ask participants to rate the severity of each pain point on a five-point scale (1 = minor inconvenience; 5 = severe breakdown likely to affect service access, trigger a formal complaint, or cause a major escalation).
- CRITICAL STEP: Merge pain points only when they refer to the same journey stage, involve the same type of information gap or responsibility ambiguity, and produce a similar downstream consequence.
- Retain pain points reported by only one participant in the raw coding file. Do not prioritize these pain points unless they receive a severity score of 4 or 5.
- Generate an integrated stakeholder-journey matrix (Figure 2) to visualize the presence of pain points (P), information gaps (I), responsibility ambiguity (R), and redesign opportunities (O) across matrix cells.
- Use journey mapping to locate service breakdowns across sequential touchpoints rather than treating dissatisfaction or delay as a single aggregated outcome21.
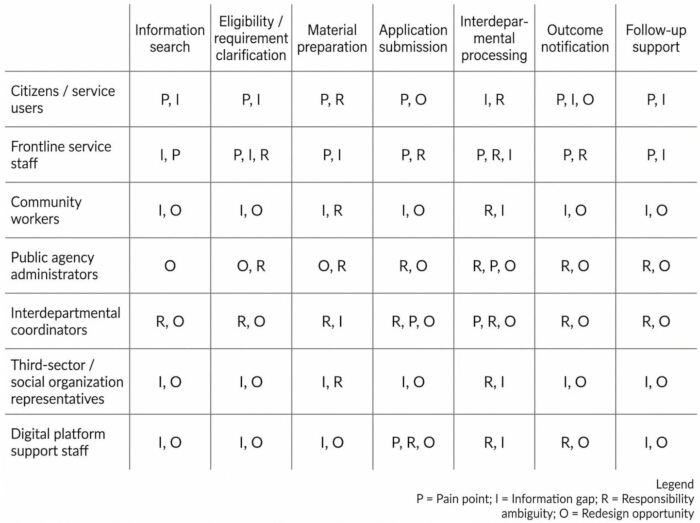
Figure 2: Integrated stakeholder-journey matrix for public service problem visualization. The matrix organizes seven public service stages on the horizontal axis and the major stakeholder groups on the vertical axis. Each cell indicates the presence of specific service issues, denoted by the following abbreviations: P = pain point; I = information gap; R = responsibility ambiguity; O = redesign opportunity. The matrix serves as a visual bridge between stakeholder mapping and co-design by linking stakeholder roles and service-stage-specific issues. Please click here to view a larger version of this figure.
5. Stage 3: Double Diamond co-design workshop
- Conduct the Double Diamond co-design workshop over a 2.5–3 h session.
- Adopt the Double Diamond framework to separate divergent exploration from convergent decision-making7,8,14.
- Ensure that citizens, frontline providers, administrators, and partner organizations participate in co-creation or co-design rather than relying solely on expert-led internal reform4,22.
- Execute the Discover phase (30–40 min).
- Instruct participants to review the stakeholder-journey matrix and add missing pain-point cards.
- Ensure that each valid pain-point card records the journey stage, affected actor, service breakdown, information gap or responsibility ambiguity, and downstream consequence.
- Execute the Define phase (40–50 min).
- Ask each participant to silently select the three pain-point cards that best represent high-severity, cross-actor service breakdowns.
- Use anonymous dot voting or written ranking before open discussion to reduce status effects and power imbalances.
- Cluster the selected cards according to journey stage, affected actor, information gap or responsibility ambiguity, and downstream consequence.
- Ask the facilitator to read each cluster aloud and confirm that participants agree the cards describe the same service breakdown.
- Convert each cluster into a single "How might we" design challenge statement.
- Ensure that each design challenge statement specifies the affected actor, the problematic journey stage, the service breakdown, and the desired improvement direction.
- Screen each design challenge using a four-item rubric that evaluates specificity, actor clarity, linkage to mapped evidence, and feasibility for low-fidelity prototype testing.
- Revise any statement that omits an actor, combines multiple unrelated breakdowns, proposes a solution prematurely, or cannot be tested using simulated service materials.
- Record the original draft, the reason for revision, and the final validated statement in the audit sheet.
CAUTION: Investigators may pause after approving the final design challenge statements and resume when the solution cards and prototype-selection sheets have been prepared. - Execute the Develop phase (50–60 min).
- Instruct participants to generate service improvement ideas for each design challenge and record them on solution cards.
- Exclude ideas requiring real case data, individual eligibility records, major legal or policy changes, or identifiable administrative files.
- Execute the Deliver phase (30–40 min).
- Ask participants to rate each solution idea on a five-point scale according to expected service impact, implementation feasibility, stakeholder agreement, and suitability for simulated-task testing.
NOTE: Select prototype concepts with a mean score of at least 4.0 for both feasibility and testability. This threshold is required to ensure that the prototypes are viable for simulated-task testing without implementation bottlenecks.
6. Stage 4: Low-fidelity prototype testing
- Develop low-fidelity prototypes for the prioritized concepts.
- Prepare three prototype formats: a one-page service requirement checklist, a service-status tracking mock-up, and a follow-up or escalation pathway.
- CRITICAL STEP: Create two matched task sets before testing. Ensure that the task sets are balanced by decision steps, reading length, required fields, scenario complexity, and expected completion time.
- Match the task sets by the number of decision steps, reading length, required fields, scenario complexity, and expected completion time.
- Pilot the matched task sets with three to five non-study users.
- Revise the task sets if the mean completion time differs by more than 10%.
- Administer simulated public service tasks to evaluate the prototypes.
- Whenever feasible, use a counterbalanced or control-group design to distinguish task familiarity from prototype exposure.
- If all participants complete the baseline tasks before the post-prototype tasks, record this as a potential learning-effect risk in the Protocol, Results, and Discussion sections.
- Provide each participant with four baseline task scenarios before prototype exposure.
- After prototype exposure, provide four comparable, but not identical, task scenarios.
- Set a maximum time limit of 5 min for each task.
- Read identical task instructions to each participant.
- Do not provide hints during task completion. Limit clarifications to procedural questions only.
- Measure task completion time in seconds from task presentation to the final response.
- Record the task as incomplete, assign a completion time of 300 s, and code task success as 0 if a participant does not complete the task within 5 min.
- Code a task as successful only when the participant selects the correct answer or completes all required decision steps within the time limit.
- Calculate the error count by tallying missed, incorrect, or unnecessary decision steps.
- Measure participant-rated clarity immediately after each task using a five-point scale (1 = very unclear; 5 = very clear).
- After all tasks have been completed, ask participants to rate prototype usability and adoption intention.
NOTE: Prototype testing assesses the task-based clarity and usability of the protocol-generated materials rather than improvements in public service performance23.
7. Data analysis and quality control
- Exclude questionnaire responses completed in less than 3 min, responses with more than 20% missing values, identical responses across all Likert-scale items, or responses containing inconsistent role information.
- Summarize questionnaire data using means and standard deviations for continuous variables, and frequencies and percentages for categorical variables.
- Code stakeholder and journey mapping data using the structured coding sheet. Have two researchers independently code at least 20% of the material before consensus discussion, then report percentage agreement and Cohen's kappa or an equivalent reliability statistic.
- Analyze workshop outputs by counting valid pain-point cards, problem clusters, design challenge statements, solution ideas, feasibility ratings, and shortlisted prototype concepts.
- Calculate the protocol-specific prototype usability score from five five-point items: requirement clarity, status visibility, next-step clarity, ease of task completion, and confidence in using the material. Transform the raw score (ranging from 5 to 25) to a 0-100 scale using the formula:
usability score = (raw score - 5) / 20 x 10017 - Analyze prototype testing data to extract task-based clarity and usability indicators. Use IBM SPSS Statistics (Analyze > Compare Means > Paired-Samples T Test; Analyze > Nonparametric Tests > Related Samples; Analyze > Descriptive Statistics > Crosstabs > Statistics > McNemar) or equivalent R commands (t.test(..., paired = TRUE), wilcox.test(..., paired = TRUE), and mcnemar.test()) to export the test statistic, exact P value, 95% confidence interval when available, and effect size.
- Interpret P values descriptively with a predefined alpha of 0.05 and emphasize effect direction, magnitude, and consistency across indicators24.
- Aggregate repeated task records to the participant level or use an appropriate repeated-measures model if four tasks per condition are analyzed simultaneously.
NOTE: Do not treat all task records as statistically independent unless this assumption is explicitly justified. - CRITICAL STEP: Document all data-cleaning, coding, task-set matching, and statistical-analysis decisions in an audit sheet to maintain reproducibility. Ensure all de-identified data are stored in password-protected files accessible only to the research team
Results
Participant inclusion and protocol feasibility
The protocol was successfully implemented, with 100 valid questionnaire responses (89.3% completion rate) and a dedicated subgroup of 28 participants who completed the workshop and prototype testing stages. The retained participants represented seven stakeholder categories involved in the public service process: citizens or service users (n = 32), frontline service staff (n = 18), community workers (n = 14), public agency administrators (n = 12), interdepartmental coordinators (n = 8), third-sector representatives (n = 10), and digital platform support staff (n = 6).
The 28 workshop participants were divided into five mixed-role groups, with each group including at least three stakeholder categories. All groups completed stakeholder mapping, journey mapping, Double Diamond co-design, and prototype testing, producing actor-relationship profiles, stakeholder-journey matrices, validated design challenge statements, prototype concepts, and simulated task-testing records (Table 3). The structured mapping stages required fewer facilitator interventions than the problem-definition phases.
Table 3: Participant inclusion, stakeholder composition, and protocol implementation stages. Participant recruitment and inclusion, stakeholder group composition, workshop participation, protocol completion, and the implementation outcomes across the four protocol stages. Please click here to download this Table.
Visualization outputs: stakeholder and journey mapping
The stakeholder-mapping stage identified nine actor categories, seven of which consistently appeared across all groups and formed the vertical axis of the stakeholder-journey matrix. Public agency administrators had the highest mean influence scores, whereas citizens had the highest dependency scores and the lowest information-access scores. Nine perception gaps, defined as rating discrepancies of two points or more, were identified. The largest gap occurred in perceived information access between citizens and administrators.
The journey-mapping stage generated 126 raw pain-point statements. After structured merging according to journey stage and downstream consequence, 38 unique service breakdowns were retained, of which 12 met the predefined prioritization criteria (frequency ≥10% or severity ≥4.0). Most prioritized breakdowns occurred during material preparation, eligibility clarification, and interdepartmental processing. These findings were synthesized into the integrated stakeholder-journey matrix (Figure 2).
Co-Design transformation and prototype generation
During the Double Diamond co-design workshop, participants generated 94 valid pain-point cards, which were clustered into 14 problem areas. Of the 17 initial design challenge statements, six required revisions because they lacked a direction for improvement, defined the affected actor too broadly, or proposed a solution before clearly defining the problem. Following rubric-based revision, 11 design challenge statements were retained.
During the Develop phase, participants generated 32 service improvement ideas. Applying the predefined feasibility and testability thresholds (scores ≥4.0) reduced these to six shortlisted concepts. Three low-fidelity prototype concepts were selected for task-based testing: a one-page service requirements checklist, a service status tracking mock-up, and a defined escalation pathway (Figure 3). Numerical outputs from all visualization and co-design stages are summarized in Table 4.
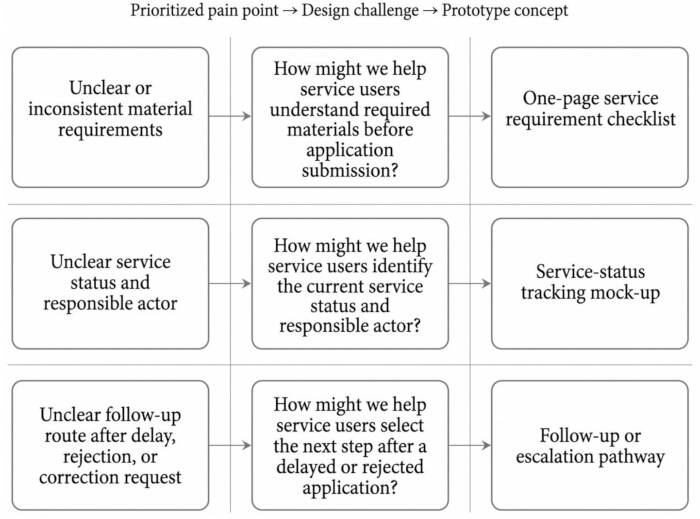
Figure 3: Pain-point-to-prototype transformation pathway. The figure illustrates three transformation pathways from prioritized pain points to design challenge statements and low-fidelity prototype concepts. Design challenge statements are presented using the “How might we” format, a collaborative design technique used to frame problems as open-ended opportunities for solution generation. Examples shown include: (1) unclear or inconsistent material requirements to a one-page service requirement checklist; (2) unclear service status and responsible actor to a service-status tracking mock-up; and (3) unclear follow-up routes after delays, rejection, or correction requests to a follow-up or escalation pathway. Please click here to view a larger version of this figure.
Table 4: Protocol-generated outputs and quantitative task-based testing results. The outputs generated at each protocol stage, together with quantitative results from the simulated task-based prototype evaluation, include usability and performance indicators. Please click here to download this Table.
Task-based prototype testing outcomes
The protocol generated 224 simulated task records from 28 participants, comprising 112 baseline and 112 post-prototype task records. The protocol-generated materials were associated with improved performance during the simulated tasks. We performed paired-samples analysis at the participant level (n = 28) to account for intra-individual correlations across repeated tasks. Mean task completion time significantly decreased from 178.4 ± 35.8 s at baseline to 121.7 ± 28.4 s post-prototype (mean difference = −56.7 s; 95% CI, −68.3 – −45.1 s; Cohen’s dz = −1.92; paired t-test, P < 0.001). Similarly, the mean error count per participant reduced from 1.86 ± 0.61 to 0.79 ± 0.44 (mean difference = −1.07 errors; 95% CI, −1.27 – −0.87; Cohen’s dz = −2.05; paired t-test, P < 0.001). Task success rates were analyzed using a Wilcoxon signed-rank test on participant-level success proportions, showing a significant improvement (Z = −4.12, P < 0.001). Mean clarity ratings also improved significantly at the participant level, increasing from 3.1 ± 0.5 to 4.2 ± 0.4 (mean difference = 1.10 points; 95% CI, 0.94 to 1.26; Cohen’s dz = 2.71; paired t-test, P < 0.001).
The overall task success rate increased from 62.5% (70/112 task records) at baseline to 82.1% (92/112 task records) after prototype exposure, representing a 19.6 percentage-point increase (95% CI, 8.2 to 31.1 percentage points; two-proportion comparison, P = 0.001). Because the aggregate counts indicate 22 additional successful task records after prototype exposure, all feasible paired discordance tables produced an exact McNemar sensitivity result below P < 0.01, supporting the same directional conclusion while avoiding reconstruction of unavailable individual-level discordant pairs.
Participant-reported outcomes were consistent with these operational findings. Mean clarity ratings increased from 3.1 ± 0.7 to 4.2 ± 0.5 on the five-point scale (n = 112 task records per condition; mean difference = 1.10 points; 95% CI, 0.94 to 1.26; summary-level standardized mean difference = 1.81; summary-level P < 0.001). The final materials achieved a protocol-specific usability score of 78.4 ± 9.6 and an adoption intention rating of 4.1 ± 0.6 (Figure 4). These usability scores were calculated from the five protocol-specific study items rather than from the standardized System Usability Scale (SUS). Open-ended feedback supported these findings: 21 of 28 participants reported improved visual clarity of the stakeholder-journey matrix, 17 of 28 reported clearer actor roles, 19 of 28 reported clearer service stages, and 20 of 28 confirmed the practical usability of the prototype materials.
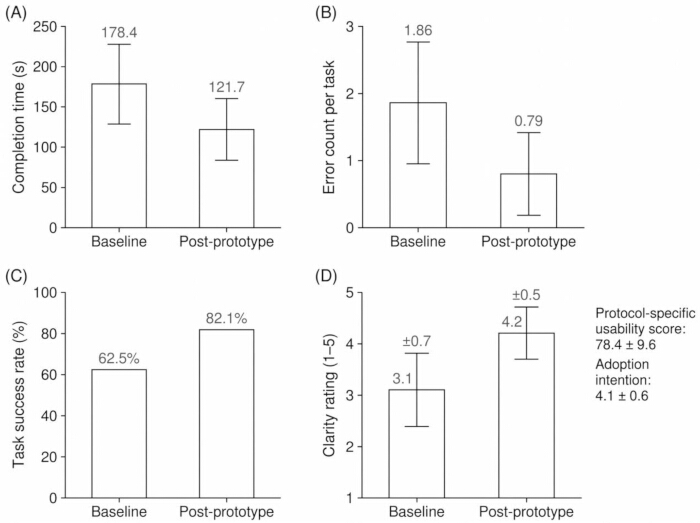
Figure 4: Task-based clarity and usability outcomes after prototype exposure. (A) Mean task completion time (s). (B) Mean error count per task. (C) Task success rate (%). (D) Participant-rated clarity (1–5 scale). Additional metrics in panel (D) include the protocol-specific usability score and adoption intention. Bars represent participant-level means, and error bars indicate the standard deviation (SD). Comparisons between baseline and post-prototype conditions were conducted at the participant level and were statistically significant (P < 0.001) for completion time, error count, clarity, and task success rate. Please click here to view a larger version of this figure.
Discussion
This protocol provides a systematic, reproducible method for structuring complex problems in low-risk public service environments. By sequentially integrating stakeholder mapping, journey mapping, Double Diamond co-design, and low-fidelity prototype testing, the method translates fragmented multi-actor complaints into testable service interventions while maintaining a clear distinction between simulated usability evidence and live administrative performance. The representative results demonstrate that public service challenges are rarely isolated to a single procedural step; instead, they are distributed across users, frontline staff, and back-office administrators. A key contribution of this protocol is its ability to make these multi-actor dependencies and information asymmetries visible before solution development begins.
A central component of this protocol is the stakeholder-journey matrix. In multi-actor public services, stakeholders frequently have different interpretations of where service failures originate. The matrix functions as a boundary object, a tangible artifact that is adaptable across different conceptual boundaries while maintaining a common identity among participant groups, thereby facilitating cross-role consensus and collaborative design25,26. By translating diffuse user dissatisfaction into observable, stage-specific events, the matrix reduces the risk of vague problem framing and helps prevent workshop participants from defaulting to familiar but ineffective administrative adjustments.
The structured application of the Double Diamond framework supports a controlled transition from problem exploration to actionable service redesign. The results indicate that moving from broad complaints to precise "How might we" design challenges is often the most demanding phase of the process, requiring active facilitation, explicit screening criteria, and documented revisions. Without these structural constraints (specifying the affected actor, journey stage, service breakdown, and intended improvement), co-design sessions may generate generic solutions that do not address the mapped service breakdowns. The direct linkage between a prioritized pain point (e.g., unclear material requirements) and its corresponding prototype (e.g., a one-page checklist) illustrates the protocol's generative validity.
It is important to distinguish the task-based prototype-testing outcomes generated by this protocol from claims of actual organizational improvement. The observed reductions in task completion time and error rates indicate that the co-designed materials are clear and usable under simulated conditions. However, early-stage prototyping in the public sector is primarily intended to support learning and risk mitigation before implementation16,27. The fixed pre/post testing sequence used in the representative application may also introduce task familiarity or learning effects because participants completed the baseline tasks before the post-prototype tasks. Future implementations should use counterbalanced task orders, matched control groups, or repeated-measures models to distinguish prototype effects from learning effects.
Troubleshooting common protocol failures is essential for reproducibility. If stakeholder mapping produces only generic actor labels, facilitators should ask participants to specify the decision, information, or coordination dependency associated with each actor. If journey maps become complaint lists, facilitators should return each card to a specific journey stage, affected actor, information gap, and downstream consequence.
Protocol modification is expected when the workflow is transferred to different public service environments. For university administrative services, stage labels may emphasize registration, appeals, and support processes. For healthcare outpatient pathway redesign, ethics safeguards and clinical governance approvals should be expanded. For social welfare coordination, cross-agency data-protection requirements may necessitate stronger de-identification and referral controls. Cultural, administrative, and governmental differences may also influence how freely participants criticize procedures, how authority is distributed within mixed groups, and whether anonymous voting or separate user-provider mapping is required.
Several limitations should be considered when applying this method. First, the protocol is designed specifically for low-risk consultative and administrative services. Applying it to high-stakes environments, such as medical interventions or legal adjudications, would require substantially enhanced ethical safeguards, domain expertise, and data-protection protocols. Second, although separating user and provider groups during the initial mapping stage may reduce the suppression of negative feedback, inherent power imbalances may still influence collaborative dynamics during mixed-role synthesis. Third, the success of the Define phase remains dependent on facilitator expertise. Independent research groups should therefore use standardized facilitator training, calibration exercises, observation checklists, and post-session debriefs before comparing outputs across settings.
In conclusion, this systematic visualization protocol provides a structured, ethically bounded approach for diagnosing and prototyping solutions to complex public service problems. It advances public service innovation beyond abstract policy discussions by providing a reproducible toolkit that bridges expert-led reform and user-centered design. Future research should apply this protocol to additional public service domains, including municipal digital services, university administrative services, education support, healthcare outpatient pathway redesign, and social welfare coordination. Future studies should also evaluate how prototypes developed in controlled workshops perform after implementation in routine administrative workflows.
Disclosures
The authors declare no competing interests.
Acknowledgements
The authors thank all participants, including citizens, frontline service staff, and public agency administrators, for their participation in the questionnaires, co-design workshops, and prototype-testing sessions. Their contributions and insights into multi-actor public service experiences supported the development of this systematic service design visualization protocol.
The authors also acknowledge the institutional and academic support provided by the Faculty of Innovation and Design, City University of Macau; the College of Art and Design, Shenzhen University; and the College of Art and Design, Guangdong Baiyun University. This research received no specific grant from any funding agency in the public, commercial, or not-for-profit sectors.
Materials
| Name | Company | Catalog Number | Comments |
|---|---|---|---|
| Analysis syntax or workflow notes | Research team | PSD-VP-S17 v1.1 | To document SPSS or equivalent R workflow for paired comparisons, Wilcoxon tests, McNemar sensitivity checks, effect sizes, confidence intervals, and reporting outputs. |
| Anonymous role-based questionnaire | Research team | PSD-VP-S02 v1.1 | To collect stakeholder role information and baseline perceptions of the selected public service process. |
| De-identification checklist | Research team | PSD-VP-S14 v1.1 | To ensure that participant names, ID numbers, addresses, case IDs, and administrative records are not collected or disclosed. |
| Design challenge template | Research team | PSD-VP-S07 v1.1 | To convert clustered pain points into structured, testable How might we statements. |
| Facilitator calibration rubric | Research team | PSD-VP-S15 v1.1 | To standardize facilitator preparation, example coding, challenge-statement revision, and cross-facilitator consistency. |
| Five-point stakeholder-rating sheet | Research team | PSD-VP-S04 v1.1 | To rate each stakeholder's influence, dependency, information access, and coordination pressure. |
| IBM SPSS Statistics | IBM Corporation | Version 26.0 or later | To conduct descriptive analyses, paired t-tests, Wilcoxon signed-rank tests, and McNemar tests for prototype-testing outcomes. |
| Low-fidelity prototype materials | Research team | PSD-VP-S10 v1.1 | To develop and test early-stage service materials, including a requirement checklist, service-status mock-up, and follow-up pathway. |
| Microsoft Excel | Microsoft Corporation | Microsoft 365 or equivalent | To organize questionnaire data, calculate descriptive statistics, manage coding sheets, and prepare summary tables. |
| Pain-point cards | Research team | PSD-VP-S06 v1.1 | To record service breakdowns, information gaps, responsibility ambiguity, affected actors, and downstream consequences. |
| Participant information sheet | Research team | PSD-VP-S01 v1.1 | To explain the study purpose, procedures, participant rights, and consent requirements before participation. |
| Password-protected data storage | Institutional or research team computer system | Access restricted to research team | To securely store de-identified questionnaire data, workshop outputs, coding files, and task-testing records. |
| Prototype scoring rubric | Research team | PSD-VP-S12 v1.1 | To assess prototype clarity, usability, task success, error count, and adoption intention. |
| Prototype-selection sheet | Research team | PSD-VP-S09 v1.1 | To select prototype concepts that meet predefined feasibility and testability thresholds. |
| Public service journey-mapping template | Research team | PSD-VP-S05 v1.1 | To map the public service process across information search, requirement clarification, material preparation, submission, processing, notification, and follow-up support. |
| Simulated task sheets | Research team | PSD-VP-S11 v1.1 | To evaluate task completion, decision accuracy, and clarity before and after prototype exposure. |
| Solution cards | Research team | PSD-VP-S08 v1.1 | To document service improvement ideas generated during the Double Diamond co-design workshop. |
| Stakeholder-mapping worksheet | Research team | PSD-VP-S03 v1.1 | To identify 5-8 actors involved in the public service process and visualize actor roles and dependencies. |
| Structured coding sheet | Research team | PSD-VP-S13 v1.1 | To code stakeholder-mapping data, journey-mapping outputs, pain-point clusters, and workshop results. |
| Task-set equivalence checklist | Research team | PSD-VP-S16 v1.1 | To document matching of baseline and post-prototype tasks by decision steps, reading length, required fields, complexity, and pilot completion time. |
References
- Rittel HWJ, Webber MM. Dilemmas in a general theory of planning. Policy Sci. 1973;4(2):155-69.
- Suoheimo M, Vasques R, Rytilahti P. Deep diving into service design problems: Visualizing the iceberg model of design problems through a literature review on the relation and role of service design with wicked problems. Des J. 2021;24(2):231-51.
- Voorberg WH, Bekkers V, Tummers LG. A systematic review of co-creation and co-production: Embarking on the social innovation journey. Public Manag Rev. 2015;17(9):1333-57.
- Schwoerer K, Keppeler F, Mussagulova A, Puello S. CO-DESIGN-ing a more context-based, pluralistic, and participatory future for public administration. Public Adm. 2022;100(1):72-97.
- Edelmann N, Mergel I. Co-production of digital public services in Austrian public administrations. Adm Sci. 2021;11(1):https://doi.org/10.3390/admsci11010022
- Blomkamp E. Systemic design practice for participatory policymaking. Policy Des Pract. 2022;5(1):12-31.
- Vargas C, et al. Exploring co-design: A systematic review of concepts, processes, models, and frameworks used in public health research. J Public Health. 2025;47(4):https://doi.org/10.1093/pubmed/fdaf084
- Wacnik P, Daly SR, Verma A. Participatory design: A systematic review and insights for future practice. Des Sci. 2025;11:https://doi.org/10.1017/dsj.2025.10009
- Udoewa V. An introduction to radical participatory design: Decolonising participatory design processes. Des Sci. 2022;8:https://doi.org/10.1017/dsj.2022.24
- Stickdorn M, Schneider J. This is service design thinking: Basics, tools, cases. BIS Publishers; Amsterdam; 2011. https://www.wiley.com/en-us/This+is+Service+Design+Thinking%3A+Basics%2C+Tools%2C+Cases-p-9781118156308
- Blomkamp E. The promise of co-design for public policy. Aust J Public Adm. 2018;77(4):729-43.
- Bryson JM. What to do when stakeholders matter: Stakeholder identification and analysis techniques. Public Manag Rev. 2004;6(1):21-53.
- Folstad A, Kvale K. Customer journeys: A systematic literature review. J Serv Theory Pract. 2018;28(2):196-227.
- Design C. Eleven lessons: Managing design in eleven global brands. Design Council; London; 2007. https://www.idi-design.ie/content/files/ElevenLessons_Design_Council_2.pdf
- Steen M, Manschot M, De Koning N. Benefits of co-design in service design projects. Int J Des. 2011;5(2):53-60.
- Not E, et al. Designing a digital environment to support the co-production of public services: Balancing multiple requirements and governance concepts. Digit Gov: Res Pract. 2024;5(3):https://doi.org/10.1145/3603632
- Excellence UGCfPS. Design thinking for public service excellence. UNDP Global Centre for Public Service Excellence; Singapore; 2014. https://www.undp.org/publications/designthinking-public-service-excellence
- Osborne SP. The new public governance? Public Manag Rev. 2006;8(3):377-87.
- Hartley J. Innovation in governance and public services: Past and present. Public Money Manage. 2005;25(1):27-34.
- Freeman RE. Strategic management: A stakeholder approach. Pitman; Boston; 1984.
- Stickdorn M, Hormess ME, Lawrence A, Schneider J. This is service design doing: Applying service design thinking in the real world. O'Reilly Media; Sebastopol; 2018. https://www.thisisservicedesigndoing.com/
- Bovaird T. Beyond engagement and participation: User and community coproduction of public services. Public Adm Rev. 2007;67(5):846-60.
- Donetto S, Pierri P, Tsianakas V, Robert G. Experience-based co-design and healthcare improvement: Realizing participatory design in the public sector. Des J. 2015;18(2):227-48.
- Tomczak M, Tomczak E. The need to report effect size estimates revisited: An overview of some recommended measures of effect size. Trends Sport Sci. 2014;21(1):19-25.
- Sanders EBN, Stappers PJ. Co-creation and the new landscapes of design. CoDesign. 2008;4(1):5-18.
- Star SL, Griesemer JR. Institutional ecology, 'translations' and boundary objects: Amateurs and professionals in Berkeley's Museum of Vertebrate Zoology, 1907-39. Soc Stud Sci. 1989;19(3):387-420.
- Liedtka J. Why design thinking works. Harv Bus Rev. 2018;96(5):72-9.