We present a simple protocol for reconstituting functional mitochondrial respiratory supercomplexes into well-defined proteoliposomes for correlated structural and functional characterization.
Method Article
Functional Reconstitution of Mitochondrial Respiratory Supercomplexes
* These authors contributed equally
In This Article
Summary
Abstract
Mitochondria are central hubs in bioenergetic metabolism and are the primary source of ATP. The inner mitochondrial membrane houses the oxidative phosphorylation system, which includes electron transport chain complexes (CI, CII, CIII2, and CIV) and the ATP synthase (CV). In mammals, CI, CIII2, and CIV form higher-order structures called supercomplexes (SCs) such as SC I+III2+IV, SC I+III2, and SC III2+IV. Although the physiological factors favoring SC formation remain unclear, it has been proposed that SC formation may enhance electron-transfer rates between complexes, reduce reactive oxygen species production, or prevent nonspecific protein aggregation within the densely packed mitochondrial inner membrane. Structural and functional studies of respiratory SCs have relied heavily on detergent-extracted complexes. While these studies have improved our understanding of the electron transport chain, the lack of a sealed membrane bilayer limits their ability to probe the functional benefits of supercomplex assembly. Recent advances, however, have shown that membrane proteins can be structurally characterized in reconstituted, native-like membrane environments, offering a more physiological context for these investigations. Here, we present a simple, quick, and reproducible protocol for reconstituting respiratory SCs into liposomes. This method allows for testing the effects of varying lipid compositions, protein concentration, and membrane potential on the function of respiratory SCs, providing a valuable tool for future mechanistic studies.
Introduction
Mitochondria are central to eukaryotic respiration. The inner mitochondrial membrane (IMM) hosts the oxidative phosphorylation system, comprising the electron transport chain complexes (CI–CIV) and ATP synthase (CV)1. CI and CII transfer electrons from reduced substrates to ubiquinone (CoQ), generating ubiquinol (CoQH2), which passes electrons through CIII2 and via cytochrome c to CIV, where oxygen is reduced to water. Proton pumping by CI, CIII2, and CIV establishes the proton motive force (PMF), which is utilized by CV to synthesize ATP from ADP and inorganic phosphate (P)1.
In addition to functioning independently, CI, CIII2, and CIV can assemble into higher-order supercomplex (SC) structures with defined stoichiometries, such as SC I+III2+IV (also known as the respirasome), SC I+III2, and SC III2+IV2,3,4,5. The functional advantages of these assemblies remain unclear6. Hypotheses on their function range from roles in assembly and substrate channeling to being a byproduct of the high protein density in the inner mitochondrial membrane (IMM)3,7,8,9,10,11,12,13,14,15. Recent studies suggest that membrane properties, including hydrophobic mismatch-induced membrane strain, protein–protein interactions, and protein-lipid interactions, contribute to SC formation and stability16.
Structural and functional studies of membrane proteins have traditionally relied on detergent-solubilized complexes, which disrupt native membrane environments and limit investigation of processes dependent on membrane potential and ion gradients. In contrast, recent advances demonstrate that membrane proteins can be structurally characterized in reconstituted17,18,19 or native membranes20,21,22,23, significantly enhancing our ability to examine functional mechanisms of membrane proteins reliant on membrane potential and ion gradients.
This protocol describes a simple and reproducible method for reconstituting mitochondrial respiratory supercomplexes (SCs) into defined proteoliposomes. The resulting system provides a powerful platform for investigating fundamental questions related to respiratory SC formation, stability, and function in a controlled, native-like membrane environment. By incorporating CoQ10 and cytochrome c during reconstitution, we demonstrate that the proteoliposome-reconstituted SCs support NADH-driven oxygen consumption, indicating that the complexes remain functionally competent within the lipid bilayer. We further show that SCs can be readily visualized in proteoliposomes using cryogenic electron microscopy (cryo-EM), thereby enabling a direct correlation between structural organization and biochemical activity.
While the method is robust and readily reproducible, successful reconstitution depends on careful optimization of lipid composition, detergent concentration, protein-to-lipid ratio, and efficient membrane sealing to preserve supercomplex stability and activity.
The overall goal of this method is to enable integrated structural and functional analysis of respiratory SCs under defined membrane conditions. This approach addresses key limitations of detergent-based systems by restoring SCs to a sealed lipid bilayer that can support the formation of a membrane potential and physiologically relevant protein–lipid interactions. In addition, the system allows precise control over lipid composition, cofactors, and protein content, making it well-suited for systematic testing of how membrane properties influence SC stability and activity. Compared with detergent-solubilized preparations or in situ approaches, this method offers the distinct advantage of combining functional assays, such as NADH-driven oxygen consumption, with cryo-EM-based structural analysis, thereby enabling structure–function correlations that are difficult to achieve using other systems.
Protocol
Porcine heart mitochondrial membranes were isolated from commercially purchased heart tissue harvested from animals that were slaughtered for human consumption. No live animals were used specifically for this protocol. The use of this material was determined to be exempt from animal ethics approval because the tissue was obtained as a byproduct from animals slaughtered for human consumption.
1. Purification of mitochondrial supercomplex SC I+III2/SC I+III2+IV from washed membranes of porcine heart mitochondria
- Thaw 40 mg (4 mL) of washed mitochondrial membranes as 10 mg/mL aliquots (the washed membranes are prepared as previously reported24,25).
- Dilute the membranes in 4 mL of Buffer MX (30 mM HEPES, pH 7.7, 150 mM potassium acetate, 10% glycerol, 1 mM EDTA, 0.002% (w/v) phenylmethylsulfonyl fluoride, 0.1% (w/v) CHAPS (3-[(3-cholamidopropyl)dimethylammonio]-1-propanesulfonate), 1 mM potassium ferricyanide). Add 8 mL of 2% (w/v) digitonin in Buffer MX (160 mg digitonin in 8 mL; final ratio 4:1, (mg digitonin: mg total membrane protein). The final volume is 16 mL.
- Homogenize manually in a Dounce homogenizer (50 strokes), being careful not to introduce bubbles. Incubate (tumble) for 1 h at 4 °C.
- Spin down the homogenate at 16,000 × g, 4 °C for 30 min. Collect the supernatant.
- Concentrate the supernatant to 1 mL using a centrifugal filter concentrator with a 100 kDa cut-off at 3000 × g, 4 °C. Concentrate in 10 min cycles, mixing well in between spins, until the desired volume is reached (samples tend to aggregate if not resuspended between spin cycles due to increased local concentration of the detergent near the filter).
- Separate the concentrated sample into four 250 µL aliquots.
- Equilibrate the size-exclusion chromatography column (column volume: 24 mL) with size exclusion chromatography buffer (SEC buffer; 30 mM HEPES pH 7.8, 150 mM potassium acetate, 1 mM EDTA, 0.005% glycocide detergent) for 48 mL (2 column volumes).
- Set up the chromatography program to collect 1 mL fractions starting at an elution volume of 6 mL and continuing until an elution volume of 24 mL. Inject a 250 µL aliquot (from step 1.6) onto a 24 mL size-exclusion chromatography resin. Use the column pre-equilibrated with size-exclusion chromatography buffer (from step 1.7). Collect the fractions from the fractionator before starting the next run.
- Repeat steps 1.7 and 1.8 for the rest of the concentrated aliquots from step 1.6.
- Run 10 µL of each fraction from the SEC runs mixed with 5 µL of blue-native polyacrylamide gel electrophoresis (BN-PAGE) loading dye on a 3%–12% acrylamide gradient and carry out a NADH/Nitro tetrazolium blue chloride CI in-gel activity assay26 to check the fractions for CI activity.
NOTE: Respiratory SCs elute from the 24 mL cross-linked agarose gel filtration medium at an elution volume of approximately 11.5 mL. - Pool the fractions that show the maximum high MW CI activity in the CI in-gel activity assay. Concentrate the sample as described in 1.5 above.
NOTE: The concentrated SCs in a glycoside detergent glyco-diosgenin GDN can be stored with 30% (v/v) glycerol at a final concentration of approximately 10 mg/mL in Liquid N2. 40 mg of washed mitochondrial complex yielded 3.4 mg of total protein based on a BCA assay.
2. Preparation of lipid mix
NOTE: Modified from previously reported protocols27,28. Chloroform is toxic, volatile, and a suspected carcinogen. Handle only in a certified chemical fume hood with appropriate PPE. Pentane is highly flammable. Keep away from ignition sources. Handle only in a certified chemical fume hood with appropriate PPE. Dispose of organic solvent waste in approved halogenated/non-halogenated solvent waste containers according to institutional EH&S policies.
- Working in a fume hood, prepare 25 mg/mL stock solutions of POPC (1-palmitoyl-2-oleoyl-sn-glycero-3-phosphocholine), POPE (1-palmitoyl-2-oleoyl-sn-glycero-3-phosphoethanolamine), and CL (cardiolipin: 1,3-bis(sn-3’-phosphatidyl)-sn-glycerol; from bovine heart tissue) in chloroform separately.
- Prepare 10 mM CoQ10 in chloroform. For 25 mg of total lipid mix, add 0.4 mL (10 mg) of POPC, 0.4 mL (10 mg) of POPE, 0.2 mL (5 mg) of CL, and 50 µL of 10 mM CoQ10 (final 500 nmol CoQ10 (20 nmol CoQ10/mg lipid) from stock solutions into a 13 mL glass test tube. The final ratio by weight of POPC:POPE:CL is 2:2:1.
- Dry the mixture under an inert gas stream (argon or nitrogen) to remove chloroform while gently rotating the tube to form a thin layer of the lipid mixture along the walls of the tube. Dry with a constant stream of inert gas for 10 min.
- Re-dissolve the dried lipid layer with 1 mL of pentane and repeat step 2.3, facilitating the removal of residual chloroform.
- Incubate the dried lipid tube in a vacuum desiccator at room temperature overnight to fully remove solvents.
- Add 5 mL of Proteoliposome Buffer (PLB; 10 mM MOPS pH 7.4, 150 mM KCl) to rehydrate the lipid mix, seal the tube tightly to avoid any spillage, and vortex it gently until the lipids are fully solubilized (dried lipids are no longer visible on the surface of the tube).
- Remove the seal, fill the tube with inert gas (argon or nitrogen), reseal the tube, and incubate at room temperature for 1 h. After 1 h incubation, make 300 µL aliquots of the lipid mix and store at −20 °C.
NOTE: The POPC:POPE:cardiolipin (2:2:1) mixture was selected based on empirical optimization and because PE and cardiolipin are major constituents of the mitochondrial inner membrane; however, the protocol can be readily adapted to test alternative lipid compositions.
3. Reconstitution of mitochondrial SCs into liposomes
- Thaw SC aliquots stored in Liquid N 2 (step 1.12) on ice. Perform a buffer exchange to remove glycerol from the sample by resuspending the sample in SEC buffer. Concentrate the sample using centrifugal filters with a 100 kDa cut-off at 3000 × g at 4 °C. Between concentration spins (~every 5 min) continue to perform a buffer exchange by resuspending the sample in SEC buffer.
- Check the final concentration of the SC using a BCA assay (a bicinchoninic acid protein assay kit).
- Thaw a 300 µL aliquot of the lipid mix prepared in step 2.7 and extrude it through an extruder assembled with a 100 nm polycarbonate membrane for six cycles at room temperature (one cycle consists of passing the lipid mixture from the left syringe to the right and back). After completion of the extrusion cycles, collect the resulting 100 nm liposomes from the syringe opposite to the starting side. Alternatively, liposomes can be generated by sonication.
- Add 9 µL of 20% (w/v) detergent (final concentration 0.6% w/v) to 250 µL of the extruded lipid mix in a separate tube.
NOTE: One can try different detergents. Sodium cholate an anionic bile salt detergent worked best for these experiments. - Mix by inversion and incubate at 4 °C for 30 min.
- Add 120 µg (or greater) of mitochondrial SC and 3 µL of 10 mM cytochrome c (final concentration of 100 µM) to the mixture. Make up the volume to 300 µL with PLB. The final lipid: protein ratio is approximately 10:1 (w:w). As an additional control, generate empty liposomes in parallel by adding SEC buffer (30 mM HEPES, pH 7.8, 150 mM potassium acetate, 1 mM EDTA, 0.005% of a glycoside detergent) to the lipid-detergent mixture instead of mitochondrial SCs and cytochrome c.
- Mix by inversion and incubate at 4 °C for 30 min.
- Wash a prepacked desalting spin column containing G-25 resin with PLB buffer four times using gravity flow. Then, spin-wash the column at 1,000 × g for 2 min.
- Add the proteoliposome sample to the washed pre-packed G-25 resin desalting spin column and spin the column at 1,000 × g at 4 °C for 2 min to remove the detergent. Collect the eluent.
NOTE: Liposomes prepared by extrusion exhibited a more uniform size distribution than those generated by sonication. Do not spin the pre-packed desalting spin column for longer than the manufacturer recommends, to avoid detergent contamination of the sample. Proteoliposomes were stored at 4 °C and typically used within 36 h to minimize potential loss of activity and preserve supercomplex integrity.
4. Lipid flotation assay29
- Make solutions of 27% and 7% (w/v) sucrose in PLB. Prepare a step gradient by layering 1.5 mL of 27% sucrose and 0.9 mL of 7% sucrose in a 3.5 mL centrifuge tube.
- Layer 300 µL of proteoliposomes (from step 3.9) containing SC gently on the sucrose gradient. Centrifuge the gradients at 100,000 × g in a fixed-angle rotor for 2 h at 4 °C.
- Carefully collect (try to avoid mixing) nine fractions of 300 µL (or 10 fractions of 270 µL) from top to bottom. Resuspend the pellet, if present, in the last fraction and collect it as fraction 9 or 10. Any unreconstituted SC should accumulate in fraction 9 or 10.
NOTE: The flotation assay helps separate reconstituted proteoliposomes from empty liposomes and unreconstituted protein complexes. It is used to optimize reconstitution.
5. CI spectroscopic ferricyanide activity assay and CI in-gel activity assay
- Prepare the necessary amount of ferricyanide reaction buffer (FRB; 20 mM Tris HCl, pH 7.4, 50 mM NaCl, 0.1% w/v 3-[(3-cholamidopropyl)dimethylammonio]-1-propanesulfonate (CHAPS), 1 mM potassium ferricyanide).
- Aliquot 990 µL of reaction buffer into a 1 mL cuvette. Add 5 µL of the sample (from each gradient fraction) to the cuvette, then add 5 µL of 20 mM NADH (final concentration 100 µM) to the reaction. Seal the cuvette with transparent film and mix by inversion.
- Monitor the rate of absorbance decay at 340 nm at 25 °C in a spectrometer. The decay in absorbance at 340 nm indicates NADH oxidation. Repeat for all fractions in triplicate. Use 5 µL of PLB instead of the sample to record the blank.
- Calculate the rate of NADH oxidation after subtracting the blank and plot the total activity of each of the fractions.
NOTE: Alternatively, the experiment can be performed in a 96-well plate. - Pool the fractions with maximum total activity (avoid fractions at the bottom of the tube that contain activity, as these correspond to unreconstituted protein). Make up the pooled fractions to a total volume of 20 mL with PLB to dilute sucrose.
- Spin the samples at 150,000 × g, 4 °C for 1 h in a fixed-angle rotor. Discard the supernatant and resuspend the pellet in 200 µL of PLB.
- Mix 25 µL of the resuspended pellet from the above step with 25 µL of 2% w/v digitonin in PLB and incubate (tumble) at 4 °C for 1 h.
- Spin down the unextracted proteins at 16,000 × g for 20 min. Collect the supernatant.
- Add 10 µL of BN-PAGE loading dye to 30 µL of the supernatant and load onto a 3%–12% gradient BN-PAGE. Run two gels to carry out CI and CIV in-gel activity assays26.
- Run the gel at 150 V for 30 min with dark BN-PAGE buffer (25 mM Tris, 0.192 g Glycine, 200 mg Coomassie blue). Change the dark blue buffer to a light blue buffer (25 mM Tris, pH 8.3, 0.192 g Glycine, 20 mg Coomassie blue) and run for another 2 h at 200 V.
- After the run, transfer the gels to a suitable container and carry out CI and CIV in-gel activity assays26.
NOTE: For structural and functional studies of complexes reconstituted in liposomes, use the remaining resuspended proteoliposomes from step 5.6. Once the reconstitution has been fully optimized, one can skip steps 4 and 5 and use reconstituted proteoliposomes directly from step 3.
6. ACMA fluorescence quenching assay to measure membrane integrity of the reconstituted proteoliposomes29
- Prepare the necessary amount of ACMA (9-amino-6-chloro-2-methoxyacridine) reaction buffer (10 mM MOPS pH 7.4, 15 mM KCl, 4 µM ACMA, 0.5 mg/mL bovine serum albumin (BSA), 2 mM 2-Mercaptoethanol).
- Aliquot 930 µL of reaction buffer into a 1 mL cuvette. Add 50 µL of the reconstituted proteoliposomes to the cuvette, seal the cuvette, and mix by inversion. Incubate away from light for 8 min.
- Set the parameters of the spectrometer to: Excitation wavelength 410 nm, Emission wavelength 490 nm.
- After the incubation, mix the cuvette again by inversion and read the fluorescence with the spectrometer at room temperature for 8 min.
- Add 4 µL of 20 µM valinomycin (final concentration of 80 nM) to the cuvette, mix by inversion, and measure for 8 min.
- Add 6 µL of 1 mM CCCP (carbonyl cyanide m-chlorophenyl hydrazone) (final concentration of 6 µM) to the cuvette, mix by inversion, and measure for 8 min.
- To establish an empty vesicle control, repeat steps 6.2–6.6 but replace the reconstituted proteoliposomes with “empty liposomes”. Empty liposomes are generated through the same steps as the reconstituted proteoliposomes but have SEC buffer replacing the addition of SCs during reconstitution (step 3.6).
- Repeat the measurement in triplicate for both the reconstituted proteoliposomes and the empty liposomes and plot their relative fluorescence over time.
NOTE: Data from either reconstituted proteoliposomes or empty liposomes are scaled by (Fi − Fmin)/(Fmax−Fmin), where Fmax is the starting baseline fluorescence value of that sample and Fmin is the lowest baseline value of that sample after adding CCCP.
WARNING: CCCP is a toxic mitochondrial uncoupler and should be handled with gloves in a fume hood.
7. Respirometry measurements of oxygen consumption to assess the function of reconstituted SCs30.
NOTE: The oxygen consumption rate is measured using a Clark-type oxygen electrode system. The functional assays of the reconstituted SCs are performed directly on the eluate from the desalting column (step 3.9).
- Set up the oxygen electrode system instrument according to the manufacturer’s instructions and open the instrument control software. Add 2 mL of ultrapure water to the measurement chamber.
- Set the stir speed until the graph of oxygen concentration remains unchanged as the stir speed is increased (start at 10, increase by increments of 10). Remove the MQ water and add oxygenated water (MQ water in a bottle shaken vigorously).
- Click Calibrate > Liquid-phase calibration > Air-saturated water and wait for calibration to stabilize (rate 0 nmol per min). Using a small spatula, add a few (4–6) crystals of sodium dithionite to the reaction vessel to establish zero oxygen in the chamber.
- Wait for the signal to plateau before continuing. Save the calibration and clean the reaction chamber with 5 × 1 mL of 70% ethanol, with 5 x 1 mL of 0.1 mM EDTA, with 5 × 1 mL of MQ water, and with 5 × 1 mL of oxygraph reaction buffer (ORB; 150 mM KCl, 50 mM MOPS pH 7.4, 5 mM MgCl2, 5 mM KH2PO4, 0.02 mM EGTA, 0.5 mg/mL BSA).
- Add 2 mL ORB, click the “start read” button in the software, and wait for the graph to stabilize. While adding proteoliposomes (sample) into the reaction chamber, label the graph in the software to show the addition of the sample.
NOTE: The protein concentration in the proteoliposome sample is estimated from the total protein added to the liposomes. A protein: lipid ratio of 1:12 and a final concentration of 50 µg/mL protein in the oxygen electrode system chamber (2 mL) worked best. The precise proteoliposome yield was not measured. - After the oxygen electrode system reading stabilizes, add NADH to the reaction chamber and simultaneously label the graph in the software to indicate the addition of NADH. Continue reading for 5 min.
- Add CCCP and label the addition in the software, and continue reading for 5 min.
- Add an inhibitor (e.g., CI inhibitor (Piericidin A) or CIII2 inhibitor (Myxothiazol) or CIV inhibitor (NaN3)) and label the graph in the software, read for 2 min, then stop the reading.
- Save the graph and clean the reaction chamber with 5 x 1 mL 70% ethanol, 5 × 1 mL 0.1 mM EDTA, 7 × 1 mL MQ water, and 5 × 1 mL with ORB prior to making another measurement.
- To correct the data for the background rate, calculate the background rate, i.e., the slope of the reading prior to the addition of NADH, and linearly extrapolate this rate across the time course of the measurement calculating an expected background [O2] for each time point. Then subtracting the extrapolated background [O2] from the measured [O2] value for each time point.
- Calculate the oxygen consumption rates (OCRs) as the slope of the background-corrected [O2] concentration measurements after the addition of each reagent.
- To calculate the rates relative to the OCR after addition of NADH, for each individual trace, divide each OCR measured (e.g., OCR after addition of NADH, CCCP, and inhibitor, respectively) by the OCR measured after addition of NADH.
NOTE: CAUTION: Sodium dithionite is a strong reducing agent and may react violently with oxidants or moisture. Handle with gloves. Dispose of inhibitor-containing waste as hazardous chemical waste per institutional guidelines.
8. Estimation of the size of the reconstituted liposomes using dynamic light scattering
- Power on the dynamic light scattering (DLS) instrument and allow ~30 min for laser stabilization.
- Launch the instrument acquisition software and close any previous files.
- Filter the proteoliposomes (0.2 μm) to remove any particulates.
- Transfer 70 µL of the proteoliposomes into a clean cuvette, avoiding fingerprints or smudges.
- Load the cuvette into the instrument and close the lid securely.
- Create a new file and select Manual Measurement > Size.
- Set the temperature to 25 °C and keep the attenuation index on auto.
- Define dispersant properties (viscosity and refractive index; e.g., RI = 1.330 for water/buffer).
- Set acquisition parameters (automatic duration, ~3 measurements, General Purpose processing).
- Start the measurement and monitor size, polydispersity index (PDI), and count rate (target ~100–500 kcps).
- Analyze results: check size distribution (intensity/volume), PDI (<0.3 acceptable), and autocorrelation quality (smooth decay, stable baseline); save data.
9. Cryogenic electron microscopy grid preparation and screening
- Use the proteoliposome sample from step 5.11 (or step 3.9 if steps 4 and 5 are skipped) to set up EM grids. Concentrate the proteoliposomes if needed by repeating step 5.6 and resuspending in a smaller volume of PLB.
- Glow-discharge holey carbon-coated 300-mesh copper grids for 90 s at 20 mA using air in a glow-discharge cleaning system.
- Set up an automated plunge freezer system for plunge freezing at 95% humidity and at 15 °C with the following parameters: blot time 10 s, blot force −8, wait time 10 s, and drain time 0.
- Attach the tweezers with the glow-discharged grid to the plunge freezer system.
- Add 4.0 µL of the proteoliposome sample to the glow-discharged grid on an automatic plunger.
- Incubate the grids for 10 s before blotting for 10 s and plunge freezing in liquid ethane. Carefully transfer the grids to the grid box in the liquid N2 chamber, then later to the liquid N2 storage dewar.
- Load the frozen grids and screen on a transmission electron microscope with a cryogenic sample loader. A transmission electron microscope with a direct electron detector was used.
- Set up the microscope according to the manufacturer’s instructions and screen the grids for reconstituted proteoliposomes. Save the images.
NOTE: CAUTION: Liquid ethane is highly flammable and cryogenic; handle with appropriate PPE and away from ignition sources to avoid fire and cold-burn injury. Liquid nitrogen is cryogenic and may cause severe cold burns and oxygen displacement. Handle with appropriate cryogenic PPE and use only in well-ventilated areas.
Results
Using this protocol, we identified the optimal reconstitution conditions for mitochondrial supercomplexes (SCs) isolated from porcine heart mitochondria (Figure 1A,B). The sucrose step-gradient protocol effectively separates reconstituted proteoliposomes from empty vesicles and unincorporated proteins, enabling rapid testing and condition optimization. The representative results in Figure 2 show a gradient with the applied sample before and after centrifugation. In addition, we optimized the detergent used to reconstitute respiratory SC into liposomes. Four different detergents—anionic bile salt detergent, CHAPS, digitonin, and glycoside detergent—were used separately for reconstitution with the SCs. The total CI activity in the fractions was measured by the NADH-ferricyanide oxidoreduction assay for each detergent tested (Figure 3A–D). For successful reconstitutions, maximal activity for CI was observed in fractions at the interface of the two sucrose concentrations (27% w/v sucrose and 7% w/v sucrose). Notably, minimal activity is detected in Fraction #10 for anionic bile salt detergent and CHAPS, while Fraction #10 for both digitonin and glycoside detergent shows substantial activity, indicating that digitonin and a glycocide detergent do not effectively reconstitute the supercomplexes into the liposomes. An anionic bile salt detergent was used for all subsequent reconstitutions.
CI and CIV in-gel activity assay performed on blue-native polyacrylamide electrophoresis gel of digitonin-extracted POPC:POPE:CL (2:2:1) proteoliposomes demonstrates the relative quantities of SC and individual ETC complexes after reconstitution (Figure 4). Results indicate that the interaction between CI and CIII2 is largely maintained in the proteoliposomes after re-extraction with digitonin and BN-PAGE. Although some CIV activity is present in the supercomplex band, a strong signal is also observed at a lower molecular weight consistent with CIV alone, indicating dissociation. The membrane leakiness of the reconstituted liposomes was measured using the ACMA fluorescence quenching assay, indicating that the proteoliposomes were not significantly leaky to protons (Figure 5A,B). The size of the reconstituted liposomes was estimated using DLS, showing that extrusion prior to reconstitution leads to a final proteoliposome size distribution of 82.9 ± 0.8 nm diameter for empty vesicles and 110.6 ± 0.4 nm for reconstituted supercomplex proteoliposome RSPs (Figure 6). Oxygen consumption by the proteoliposomes was used to assess SC function, revealing clear inhibitor-sensitive NADH-driven oxygen consumption (Figure 7A). Plotting the OCRs relative to the OCR after the addition of NADH directly reports on the degree of coupling within the RSPs, i.e., the OCR increases by a factor of ~1.5 after addition of CCCP relative to addition of NADH alone (Figure 7B). The screened Cryo-EM grids enabled visualization of the SCs in the proteoliposome membrane, confirming successful reconstitution (Figure 8A–I).
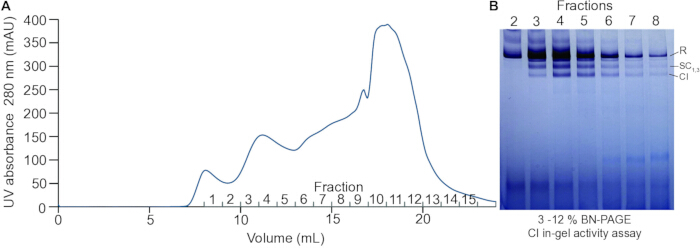
Figure 1: Isolation and characterization of detergent-solubilized supercomplexes from porcine heart mitochondria. (A) Representative chromatogram of size-exclusion chromatography (SEC) purification of digitonin extracted porcine mitochondrial membrane complexes. (B) Blue-native PAGE (BN-PAGE) of fractions from A visualized by CI in-gel activity staining. Please click here to view a larger version of this figure.
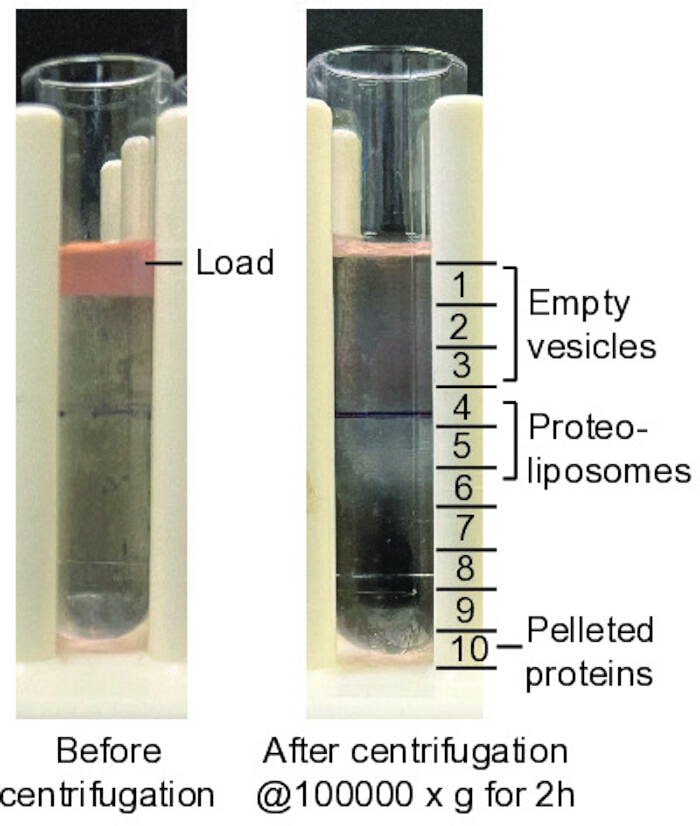
Figure 2: Sucrose step gradients with proteoliposomes. Before centrifugation (left), after centrifugation (right) at 100,000 × g for 2 h in an ultracentrifuge. The proteoliposome sample loaded onto the gradient is separated into empty vesicles, proteoliposomes, and aggregated protein at the bottom. This gradient is then fractionated for further characterization as described. The approximate extent of each fraction is indicated and labeled. Please click here to view a larger version of this figure.
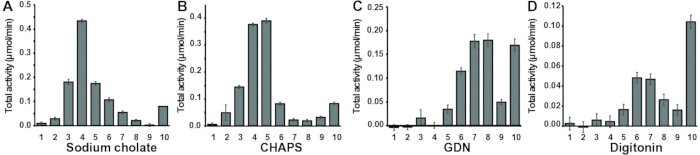
Figure 3: Flotation assay to assess reconstitution efficiency in different detergents. CI NADH-ferricyanide activity on the fractions from the sucrose step gradient after reconstituting with (A) anionic bile salt detergent, (B) 3-[(3-cholamidopropyl)dimethylammonio]-1-propanesulfonate (CHAPS) (0.6% (w/v)), (C) digitonin (0.6% w/v), (D) glycoside detergent (GDN) (0.6% (w/v)). Fraction #10 is obtained by resuspending any pellet in the last fraction. Activity in fraction #10 indicates that the proteins have not reconstituted. n = 3 and the error bars show SD = standard deviation. Please click here to view a larger version of this figure.
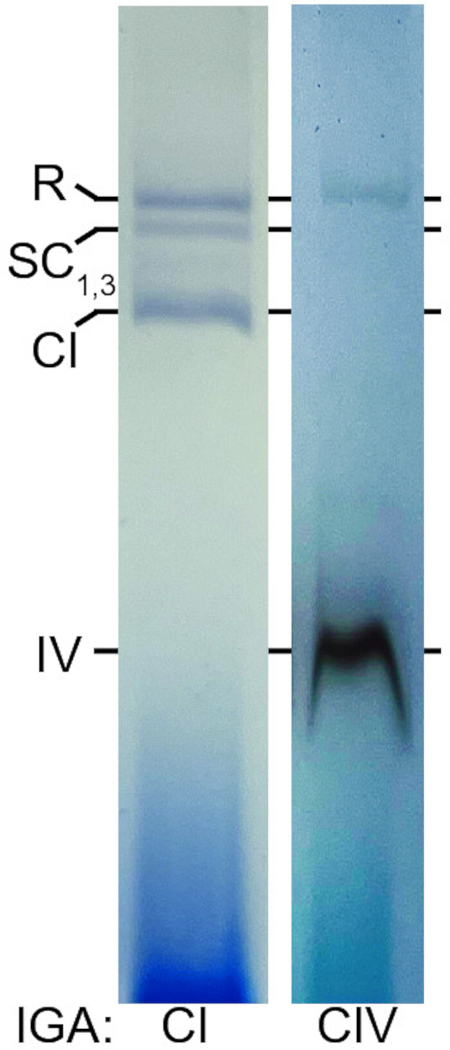
Figure 4: In-gel activity assay on digitonin-extracted proteoliposomes run on 3%–12% BN-PAGE. CI (left) and CIV (right) in-gel activity assay. R = respirasome (SC I+III2+IV), SC1,3 (SC I+III2), IGA CI = (CI in-gel activity assay); IGA = ingel activity assay CIV = (CIV in-gel activity assay). Please click here to view a larger version of this figure.
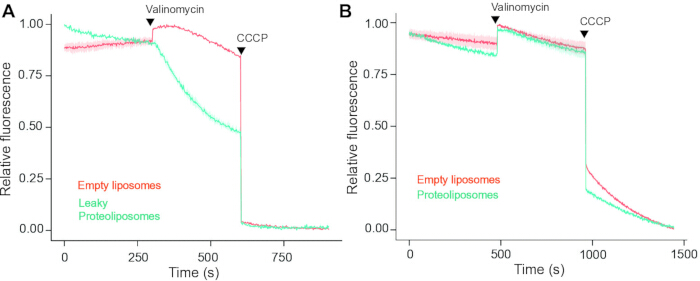
Figure 5: ACMA fluorescence quenching assay to detect proton leakiness in reconstituted proteoliposomes. With a pH-sensitive dye (ACMA), the internal pH of reconstituted proteoliposomes (cyan) was compared to empty liposomes (orange) after sequential addition of Valinomycin and CCCP. Shown are representative ACMA fluorescence traces obtained from different proteoliposome preparations for comparison. (A) Reconstituted liposomes with compromised membrane (leaky). (B) Reconstituted liposomes with intact membrane. Please click here to view a larger version of this figure.
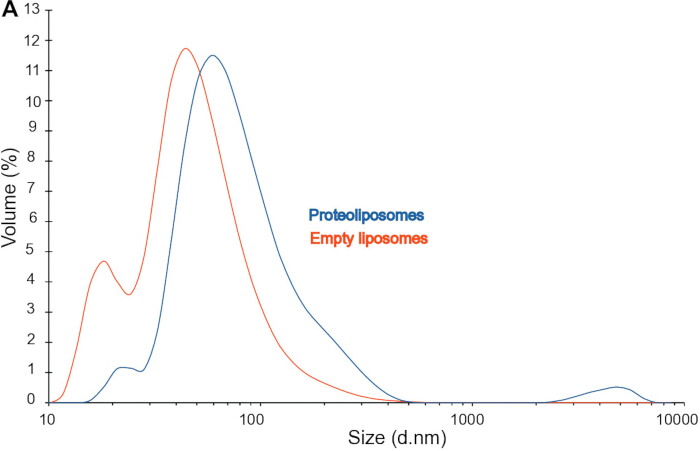
Figure 6: Dynamic light scattering measurements of empty liposomes and reconstituted SC proteoliposomes. The average volume-weighted size distributions of extruded empty liposomes (orange) and SC-reconstituted proteoliposomes (cyan) are shown. The measurements were carried out as three technical repeats. Empty liposomes have an average hydrodynamic diameter of 82.9 ± 0.8 nm, while RSPs have an average hydrodynamic diameter of 110.6 ± 0.4 nm. Please click here to view a larger version of this figure.
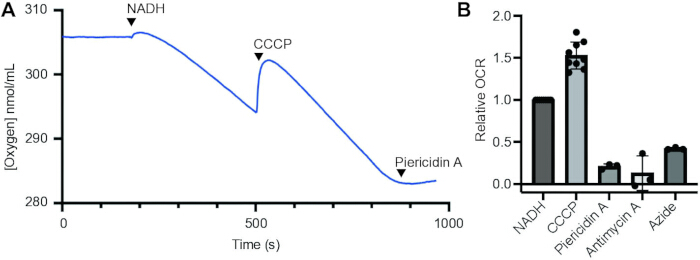
Figure 7: Oxygen consumption assays to assess coupling of reconstituted SCs in liposomes. Oxygen consumption was measured to evaluate respiratory activity and coupling of ETC complexes after reconstitution into liposomes generated by extrusion. (A) Representative background-corrected oxygen electrode trace showing changes in oxygen concentration following sequential addition of NADH to initiate CI-driven respiration, CCCP to dissipate the proton gradient and measure maximal uncoupled oxygen consumption rate (OCR), piericidin A to inhibit CI, Antimycin A to inhibit CIII2, or NaN3 (Azide) to inhibit CIV. (B) Quantification of the OCR under the indicated conditions and corrected according to step 7.10. Data points relative to the OCR after addition of NADH are shown for each trace along with the mean ± SD (error bars). Please click here to view a larger version of this figure.
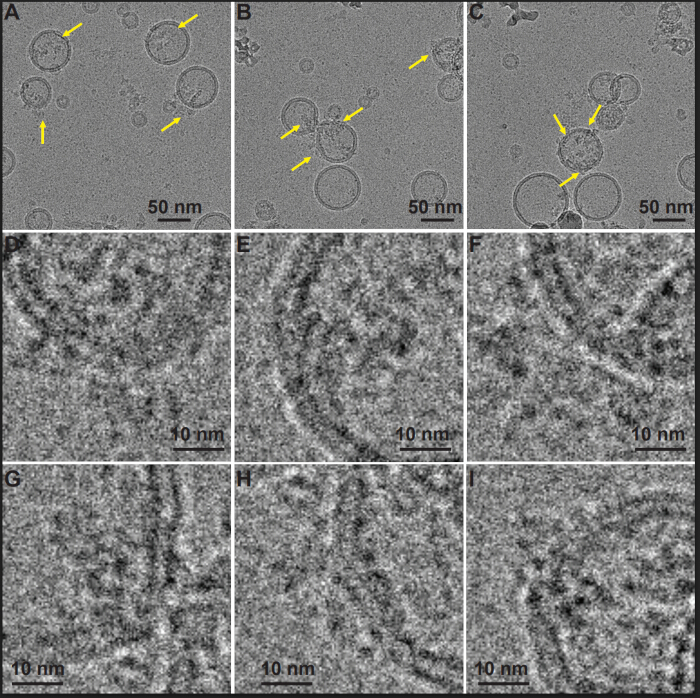
Figure 8: Cryo-EM visualization of reconstituted SCs in proteoliposome membranes. (A–C) Representative electron micrographs of screened grids showing reconstituted SCs associated with proteoliposome membranes. Reconstituted SCs are indicated with yellow arrows. Scale bars = 50 nm. (D–I) Representative SC particles viewed at higher zoom on the proteoliposome membranes. Scale bars = 10 nm. Please click here to view a larger version of this figure.
Discussion
A simple and reproducible method is presented for reconstituting mitochondrial respiratory SCs into defined proteoliposomes, enabling controlled investigation of their structure and function. Several steps in this protocol are critical for successful reconstitution. In our hands, liposomes generated by extrusion have a more uniform size distribution (assessed by dynamic light scattering) than those produced by sonication. Efficient removal of detergent using a pre-packed desalting spin column is essential to promote membrane sealing and proper incorporation of SCs into a lipid bilayer; incomplete removal can result in leaky or unstable proteoliposomes. Optimization of lipid composition, protein-to-lipid ratios, and detergent choice is equally important, as these parameters strongly influence reconstitution efficiency and SC stability. The sucrose gradient flotation assay is useful for initial optimization; however, once conditions are established, it is preferable to use proteoliposomes directly after the pre-packed desalting spin column for downstream structural and functional analyses, thereby avoiding sample loss and disruption during gradient fractionation. The volume of the fraction required to observe activity varies across preparations. Adjust the volume to add to the reaction mix for different preparations. The orientation of the respiratory SC within the proteoliposome membrane can significantly influence respiratory measurements. The reconstitution procedure was not optimized to enforce a single topology; therefore, although a mixed population of orientations is expected, CI ferricyanide accessibility assays indicate a strong bias toward outward-facing CI peripheral arms.
The orientation of the reconstituted supercomplexes was experimentally assessed, and the CI ferricyanide activity was measured in the presence and absence of the detergent. In intact RSPs, externally added NADH can only access CI molecules whose peripheral arm is exposed to the external medium, whereas detergent permeabilization allows NADH access to all complexes. Thus, this assay estimates the fraction of functionally accessible CI peripheral arms that face the external medium, rather than providing a complete structural determination of the proteoliposome topology. Comparison of activities measured under these conditions indicated that 83.1% ± 0.04% of respirasomes (the SC) were oriented with the CI peripheral arm facing outward, revealing a significant orientation bias during reconstitution.
Several modifications and troubleshooting strategies can improve reproducibility and stability. In-gel activity assays for CI and CIV, performed on digitonin-extracted pooled fractions from sucrose gradients, show bands for SC, indicating that SC does not fully dissociate during reconstitution. However, the SC band is stronger on the CI activity gel compared to the CIV activity gel, indicating that CIV may partially dissociate from CI and CIII2 after reconstitution (Figure 4). Adjusting lipid composition may enhance SC stability. Partial dissociation of CIV may also arise from detergent choice or rapid detergent removal during reconstitution, which could destabilize weaker protein–protein interactions within the supercomplex. Further optimization of detergent exchange conditions may improve CIV retention. In addition, minimizing mechanical stress, avoiding unnecessary purification steps, and carefully handling samples can help preserve the integrity of proteoliposomes. For functional assays, ensuring complete sealing of proteoliposomes is critical, as membrane leakiness prevents coupling to the transmembrane proton gradient. For cryo-EM grid preparation, the use of continuous carbon-coated grids is important because this has been shown to improve particle distribution within grid holes19.
Despite its advantages, this approach has limitations. Proteoliposomes do not fully recapitulate the compositional and dynamic complexity of the native inner mitochondrial membrane, and partial dissociation of SC components, particularly CIV, remains a challenge. Functional readouts may also be influenced by incomplete coupling or heterogeneity in reconstitution efficiency. Nevertheless, compared to detergent-solubilized systems, this method preserves lipid–protein interactions and supports a native-like membrane environment, while offering greater experimental control than in situ approaches. As such, it provides a valuable platform for systematic investigation of how lipid composition and membrane properties regulate SC stability and activity.
Understanding these relationships is particularly important because disruption of respiratory supercomplex organization has been implicated in a broad range of mitochondrial and metabolic disorders31,32,33,34,35,36,37,38,39,40. Defects in ETC complex assembly, cardiolipin synthesis, or lipid remodeling, as observed in disorders such as Leigh syndrome41,42,43,44,45,46,47, Barth syndrome48,49,50,51,52,53,54, and Sengers syndrome48, can destabilize supercomplexes, impair electron transfer, reduce ATP production, and increase reactive oxygen species generation. These bioenergetic defects disproportionately affect high-energy-demand tissues such as the heart, skeletal muscle, and brain, leading to phenotypes including cardiomyopathy, exercise intolerance, and neurodegeneration36,37,38. Conversely, emerging evidence suggests that supercomplex formation can serve compensatory and protective roles under stress by stabilizing ETC complexes and limiting pathological ROS production55,56. The reconstituted proteoliposome platform described here provides a controlled system to directly test how disease-associated lipid remodeling, mutations, or pharmacological interventions alter supercomplex assembly and function, thereby enabling mechanistic studies of mitochondrial dysfunction and informing future therapeutic strategies.
Low oxygen consumption rates may result from poor supercomplex incorporation, partial CIV dissociation, residual detergent, insufficient CoQ10 or cytochrome c, degraded NADH, or low protein concentration in the oxygraph chamber. Confirm reconstitution by flotation assay or BN-PAGE, verify membrane integrity by ACMA quenching, prepare fresh NADH, and optimize protein-to-lipid ratio, cofactor concentration, detergent removal, and sample concentration. Leaky proteoliposomes may result from incomplete detergent removal, excessive detergent concentration, harsh handling, repeated freeze–thaw cycles, or damaged lipids. If proton leakage is observed in the ACMA assay, repeat detergent removal using a freshly equilibrated desalting column, avoid over-spinning the column, prepare fresh liposomes, minimize mechanical stress, and use proteoliposomes immediately after reconstitution. Aggregation during the concentration steps can occur due to high local protein or detergent concentrations at the concentrator membrane. Concentrate samples in short (10 min) centrifugation cycles, gently resuspend the sample between spins, avoid over-concentration, maintain samples at 4 °C, and remove visible aggregates by low-speed clarification before downstream use. Inconsistent flotation behavior may reflect variable liposome size, incomplete detergent removal, aggregation, incorrect sucrose layering, or disruption of the gradient during sample loading or fraction collection. Prepare fresh sucrose solutions, layer gradients slowly without mixing interfaces, use uniformly extruded liposomes, keep centrifugation conditions constant, and collect fractions gently from top to bottom. Poor cryo-EM particle distribution may arise from low proteoliposome concentration, aggregation, preferred adsorption to carbon, poor grid wetting, thick ice, or excessive blotting. Optimize proteoliposome concentration, remove aggregates before grid preparation, adjust glow-discharge conditions, test blot time and blot force, screen different grid types or carbon supports, and use freshly prepared samples whenever possible.
Disclosures
The authors declare no conflicts of interest.
Acknowledgements
The grids were screened at the UC Davis BioEM Core facility. We thank Dr. Fei Guo for assistance with screening. The work was funded by the NIGMS of the NIH under award R35GM137929 (JAL).
Materials
| Name | Company | Catalog Number | Comments |
|---|---|---|---|
| 1-palmitoyl-2-oleoyl-sn-glycero-3-phosphocholine (POPC) | Avanti Research | 860320 | |
| 1-palmitoyl-2-oleoyl-sn-glycero-3-phosphoethanolamine (POPE) | Avanti Research | 850757 | |
| 1,3-bis(sn-3’-phosphatidyl)-sn-glycerol (cardiolipin,from bovine heart tissue) | Avanti Research | 840012 | |
| 2-[4-(2-hydroxyethyl)piperazin-1-yl]ethanesulfonic acid --- HEPES | Sigma-Aldrich | H23830 | |
| 3-(N-morpholino)propanesulfonic acid (MOPS) | Sigma-Aldrich | M12545 | |
| 3,3′-Diaminobenzidine ---- DABB | Sigma-Aldrich | D4293 | |
| Carbonyl Cyanide m-Chlorophenylhydrazone ---- CCCP | Sigma-Aldrich | C2759 | |
| CHAPS | Sigma-Aldrich | 220201 | |
| Chloroform | Sigma-Aldrich | 650948 | |
| Coenzyme Q10 | Sigma-Aldrich | C9538 | |
| Cytochrome c from equine heart | Sigma-Aldrich | C2506 | |
| Digitonin | Sigma-Aldrich | 300410 | |
| Ethylene glycol-bis(2-aminoethylether)-N,N,N′,N′-tetraacetic acid --- EGTA | Sigma-Aldrich | E3889 | |
| Ethylenediaminetetraacetic acid -- EDTA | Sigma-Aldrich | E6758 | |
| Glycerol | Sigma-Aldrich | G7893 | |
| Glyco-diosgenin | Anatrace | GDN101 | detergent |
| Lauryl Maltose Neopentyl Glycol ---- LMNG | Sigma-Aldrich | NG310 | |
| Magnesium chloride | Sigma-Aldrich | M8266 | |
| Myxothiazol | Sigma-Aldrich | T5580 | |
| NADH, Disodium Salt | Sigma-Aldrich | 481913 | |
| Nitrotetrazolium blue chloride | Sigma-Aldrich | N6876 | |
| Piericidin A | Sigma-Aldrich | 96861 | |
| Potassium acetate | Sigma-Aldrich | P5708 | |
| Potassium chloride | Sigma-Aldrich | P3911 | |
| Potassium Ferricyanide | Sigma-Aldrich | 702587 | |
| Potassium phosphate monobasic ---- KH2PO4 | Sigma-Aldrich | P0662 | |
| Sodium azide | Sigma-Aldrich | S2002 | |
| Sodium cholate hydrate | Sigma-Aldrich | C1254 | |
| Sodium chloride | Sigma-Aldrich | S9888 | |
| Sodium dithionite | Sigma-Aldrich | 71699 | |
| Sucrose | Sigma-Aldrich | S9378 | |
| TRIS | Sigma-Aldrich | T1503 | |
| ACMA (9-amino-6chloro-2-methoxyacridine) | Sigma-Aldrich | SML4162 | |
| Equipment and Kits | |||
| Amicon® Ultra Centrifugal Filter, 100 kDa MWCO 0.5 mL | Millipore | UFC5100 | |
| Amicon® Ultra Centrifugal Filter, 100 kDa MWCO 15 mL | Millipore | UFC9100 | |
| Beckman Optima TLX Ultracentrifuge | Beckman Coulter | ||
| BN-PAGE gel | blue-native polyacrylamide gel electrophoresis gel | ||
| Beckman Optima XE Ultracentrifuge | Beckman Coulter | ||
| Glow Discharge Cleaning System | glow discharge cleaning system | ||
| Glacios 2 Cryo-TEM with Gatan K3 detector | Thermo Fisher Scientific | the transmission electron microscope | |
| KIMBLE Dounce tissue grinder set | Sigma-Aldrich | D9188 | |
| Leica Automatic GP2 Plunger | Leica | ||
| Microfuge 16 | Beckman Coulter | A46474 | |
| NGC Discover 10 Chromatography System | Bio-Rad | 7880009 | |
| Oxygraph+ | the oxygen electrode system | ||
| PD-10 Desalting Column | Cytiva | 28918007 | size exclusion spin column |
| Pierce BCA Protein assay kit | Thermo Fisher Scientific | 23225 | bicinchoninic acid protein assay kit |
| Q-125 Sonicator | Q-sonica | Q125-110 | |
| Sephadex G-25 M column | prepacked G-25 resin desalting spin column | ||
| SpectraMax M2 microplate reader | Molecular Devices | ||
| Superose 6 increase 10/300 GL | Cytiva | 29091596 | cross-linked agarose gel filtration medium |
| TLA-100.3 Fixed-Angle Rotor Package | Beckman Coulter | 349490 | |
| Type 50.2 Ti Fixed-Angle Rotor | Beckman Coulter | 337901 | |
| Milli-Q (MQ) water | ultrapure water | ||
| Malvern Zetasizer ZS Dynamic Light Scattering (DLS) | Malvern Paranytical | ||
| Hansatech Oxygraph+ System | Hansatech Instruments | ||
| PELCO easiGlow Glow Discharge Cleaning System | TED PELLA, INC | ||
| Vitrobot Mark IV System | Thermo Fisher Scientific | the plunge freezer | |
| Quantifoil R 1.2/1.3 300 mesh copper grids with 2 nm carbon | TED PELLA, INC | 668-300-Cu-100 | holey carbon-coated |
| Avanti mini-extruder | Avanti Lipids | 610000 |
References
- Mitchell P. Coupling of phosphorylation to electron and hydrogen transfer by a chemi-osmotic type of mechanism. Nature. 1961;191:144-8.
- Dudkina NV, Kudryashev M, Stahlberg H, Boekema EJ. Interaction of complexes I, III, and IV within the bovine respirasome by single particle cryoelectron tomography. Proc Natl Acad Sci U S A. 2011;108:15196-200.
- Althoff T, Mills DJ, Popot JL, Kühlbrandt W. Arrangement of electron transport chain components in bovine mitochondrial supercomplex I1III2IV1. EMBO J. 2011;30:4652-64.
- Schäfer E, Dencher NA, Vonck J, Parcej DN. Three-dimensional structure of the respiratory chain supercomplex I1III2IV1 from bovine heart mitochondria. Biochemistry. 2007;46:12579-85.
- Schägger H, Pfeiffer K. Supercomplexes in the respiratory chains of yeast and mammalian mitochondria. EMBO J. 2000;19:1777-83.
- Milenkovic D, Blaza JN, Larsson NG, Hirst J. The enigma of the respiratory chain supercomplex. Cell Metab. 2017;25:765-76.
- Berndtsson J, et al. Respiratory supercomplexes enhance electron transport by decreasing cytochrome c diffusion distance. EMBO Rep. 2020;21. doi:10.15252/embr.202051015.
- Moe A, Di Trani J, Rubinstein JL, Brzezinski P. Cryo-EM structure and kinetics reveal electron transfer by 2D diffusion of cytochrome c in the yeast III-IV respiratory supercomplex. Proc Natl Acad Sci U S A. 2021;118. doi:10.1073/pnas.2021157118.
- Blaza JN, et al. Kinetic evidence against partitioning of the ubiquinone pool and the catalytic relevance of respiratory-chain supercomplexes. Proc Natl Acad Sci U S A. 2014;111:15735-40.
- Diaz F, Enríquez JA, Moraes CT. Cells lacking Rieske iron-sulfur protein have a reactive oxygen species-associated decrease in respiratory complexes I and IV. Mol Cell Biol. 2012;32:415-29.
- Maranzana E, et al. Mitochondrial respiratory supercomplex association limits production of reactive oxygen species from complex I. Antioxid Redox Signal. 2013;19:1469-80.
- Schägger H, et al. Significance of respirasomes for the assembly/stability of human respiratory chain complex I. J Biol Chem. 2004;279:36349-53.
- Acín-Pérez R, et al. Respiratory complex III is required to maintain complex I in mammalian mitochondria. Mol Cell. 2004;13:805-15.
- Letts JA, Sazanov LA. Clarifying the supercomplex: the higher-order organization of the mitochondrial electron transport chain. Nat Struct Mol Biol. 2017;24:800-8.
- Protasoni M, et al. Respiratory supercomplexes act as a platform for complex III-mediated maturation of human mitochondrial complexes I and IV. EMBO J. 2020;39. doi:10.15252/embj.2019102817.
- Pöverlein MC, Jussupow A, Kim H, Kaila VRI. Protein-induced membrane strain drives supercomplex formation. eLife. 2024;13. doi:10.7554/eLife.102104.1.
- Mandala VS, MacKinnon R. Voltage-sensor movements in the Eag Kv channel under an applied electric field. Proc Natl Acad Sci U S A. 2022;119. doi:10.1073/pnas.2214151119.
- Falzone ME, MacKinnon R. Gβγ activates PIP2 hydrolysis by recruiting and orienting PLCβ on the membrane surface. Proc Natl Acad Sci U S A. 2023;120. doi:10.1073/pnas.2301121120.
- Grba DN, et al. Molecular mechanism of the ischemia-induced regulatory switch in mammalian complex I. Science. 2024;384:1247-53.
- Tao X, Zhao C, MacKinnon R. Membrane protein isolation and structure determination in cell-derived membrane vesicles. Proc Natl Acad Sci U S A. 2023;120. doi:10.1073/pnas.2302325120.
- Zheng W, Chai P, Zhu J, Zhang K. High-resolution in situ structures of mammalian respiratory supercomplexes. Nature. 2024;631:232-9.
- Nakano A, et al. Structures of respiratory supercomplexes and ATP synthase oligomers in mammalian mitochondrial inner membrane. Nat Commun. 2026;17:4075. doi:10.1038/s41467-026-70578-x.
- Coupland CE, et al. High-resolution electron cryomicroscopy of V-ATPase in native synaptic vesicles. Science. 2024;385:168-74.
- Letts JA, Fiedorczuk K, Sazanov LA. The architecture of respiratory supercomplexes. Nature. 2016;537:644-8.
- Letts JA, et al. Structures of respiratory supercomplex I+III2 reveal functional and conformational crosstalk. Mol Cell. 2019;75:1131-46.e6.
- Jha P, Wang X, Auwerx J. Analysis of mitochondrial respiratory chain supercomplexes using blue native polyacrylamide gel electrophoresis (BN-PAGE). Curr Protoc Mouse Biol. 2016;6:1-14.
- Biner O, Fedor JG, Yin Z, Hirst J. Bottom-up construction of a minimal system for cellular respiration and energy regeneration. ACS Synth Biol. 2020;9:1450-9.
- Wright JJ, et al. Reverse electron transfer by respiratory complex I catalyzed in a modular proteoliposome system. J Am Chem Soc. 2022;144:6791-801.
- Lee SY, Letts JA, MacKinnon R. Functional reconstitution of purified human Hv1 H+ channels. J Mol Biol. 2009;387:1055-60.
- Caldeira D de AF, Oliveira DF de, Cavalcanti-de-Albuquerque JP, Nascimento JHM, Zin WA, et al. Isolation of mitochondria from fresh mice lung tissue. Front Physiol. 2021;12:748261. doi:10.3389/fphys.2021.748261.
- Shi H, et al. Global burden of ischaemic heart disease from 2022 to 2050: projections of incidence, prevalence, deaths, and disability-adjusted life years. Eur Heart J Qual Care Clin Outcomes. 2025;11:355-66.
- Rahman S. Mitochondrial disease in children. J Intern Med. 2020;287:609-33.
- Pérez-Albert P, et al. Mitochondrial disease in children: the nephrologist’s perspective. JIMD Rep. 2018;42:61-70.
- Gorman GS, et al. Prevalence of nuclear and mitochondrial DNA mutations related to adult mitochondrial disease. Ann Neurol. 2015;77:753-9.
- Pitceathly RDS, Rahman S. Mitochondrial DNA-related diseases associated with single large-scale deletions and point mutations. In: Gasparre G, Porcelli AM, editors. The Human Mitochondrial Genome: From Basic Biology to Disease. London: Academic Press; 2020. p. 353-74.
- Morán M, et al. Mitochondrial respiratory chain dysfunction: implications in neurodegeneration. Free Radic Biol Med. 2012;53:595-609.
- Chinnery PF. Primary mitochondrial disorders overview. In: Adam MP, Feldman J, Mirzaa GM, Pagon RA, Wallace SE, Bean LJH, et al., editors. GeneReviews®. Seattle: University of Washington, Seattle; 1993–2026. Available from: https://www.ncbi.nlm.nih.gov/books/NBK1224/
- Ellis CE, et al. Mitochondrial lipid abnormality and electron transport chain impairment in mice lacking α-synuclein. Mol Cell Biol. 2005;25:10190-201.
- Hekimi S, Wang Y, Noë A. Mitochondrial ROS and the effectors of the intrinsic apoptotic pathway in aging cells: the discerning killers. Front Genet. 2016;7:161. doi:10.3389/fgene.2016.00161.
- Chouchani ET, et al. Ischaemic accumulation of succinate controls reperfusion injury through mitochondrial ROS. Nature. 2014;515:431-5.
- Van de Wal MAE, et al. Ndufs4 knockout mouse models of Leigh syndrome: pathophysiology and intervention. Brain. 2022;145:45-63.
- Hoefs SJG, et al. NDUFA10 mutations cause complex I deficiency in a patient with Leigh disease. Eur J Hum Genet. 2011;19:270-4.
- Ostergaard E, et al. Respiratory chain complex I deficiency due to NDUFA12 mutations as a new cause of Leigh syndrome. J Med Genet. 2011;48:737-40.
- Marin SE, et al. Leigh syndrome associated with mitochondrial complex I deficiency due to novel mutations in NDUFV1 and NDUFS2. Gene. 2013;516:162-7.
- Adjobo-Hermans MJW, et al. NDUFS4 deletion triggers loss of NDUFA12 in Ndufs4−/− mice and Leigh syndrome patients: a stabilizing role for NDUFAF2. Biochim Biophys Acta Bioenerg. 2020;1861:148213. doi:10.1016/j.bbabio.2020.148213.
- Leshinsky-Silver E, et al. NDUFS4 mutations cause Leigh syndrome with predominant brainstem involvement. Mol Genet Metab. 2009;97:185-9.
- Piekutowska-Abramczuk D, et al. NDUFB8 mutations cause mitochondrial complex I deficiency in individuals with Leigh-like encephalomyopathy. Am J Hum Genet. 2018;102:460-7.
- Bertero E, Kutschka I, Maack C, Dudek J. Cardiolipin remodeling in Barth syndrome and other hereditary cardiomyopathies. Biochim Biophys Acta Mol Basis Dis. 2020;1866:165803. doi:10.1016/j.bbadis.2020.165803.
- Xu Y, et al. Loss of protein association causes cardiolipin degradation in Barth syndrome. Nat Chem Biol. 2016;12:641-7.
- McKenzie M, Lazarou M, Thorburn DR, Ryan MT. Mitochondrial respiratory chain supercomplexes are destabilized in Barth syndrome patients. J Mol Biol. 2006;361:462-9.
- Acehan D, Xu Y, Stokes DL, Schlame M. Comparison of lymphoblast mitochondria from normal subjects and patients with Barth syndrome using electron microscopic tomography. Lab Invest. 2007;87:40-8.
- Dudek J, et al. Cardiolipin deficiency affects respiratory chain function and organization in an induced pluripotent stem cell model of Barth syndrome. Stem Cell Res. 2013;11:806-19.
- Hagen TM, et al. Acetyl-L-carnitine fed to old rats partially restores mitochondrial function and ambulatory activity. Proc Natl Acad Sci U S A. 1998;95:9562-6.
- Schlame M, et al. Phospholipid abnormalities in children with Barth syndrome. J Am Coll Cardiol. 2003;42:1994-9.
- Ayala-Hernandez MG, et al. Respiratory complex III2 assembles complex I via toxic intermediate in mitochondrial disease. bioRxiv. 2025:doi:10.1101/2025.06.17.660237.
- Liang C, et al. Formation of I2+III2 supercomplex rescues respiratory chain defects. Cell Metab. 2025;37:441-59.e11.
Reprints and Permissions
This article has been published
Video Coming Soon