We identified VPA-related cryptorchidism reporting signals in male FAERS patients aged ≤18 years and used CTD, transcriptomic, and MR evidence to prioritize candidate genes rather than validate a mechanism. Of 108 broadly screened reports, 93 with transplacental/in utero exposure formed the exposure-focused subset for developmental interpretation.
Research Article
In Utero Valproic Acid Exposure in Cryptorchidism Reports: Integrating FAERS, Toxicogenomics, Transcriptomics, and Mendelian Randomization
In This Article
Summary
Abstract
To screen the FDA Adverse Event Reporting System (FAERS) for valproic acid (VPA)-associated cryptorchidism reports, restrict developmental interpretation to documented transplacental/in utero exposure, and prioritize candidate genes without claiming mechanistic validation, we analyzed 7,232 deduplicated primary-suspect VPA reports in males aged ≤18 years from 2004Q1–2025Q4. Cryptorchidism screening identified 108 reports; exposure-route review defined the prenatal subset. Disproportionality analyses used pediatric male FAERS reports with primary-suspect drugs as the background. Curated human VPA-associated genes from the Comparative Toxicogenomics Database (CTD) were intersected with differentially expressed genes from cryptorchidism testicular tissue (GSE16191). The 21 shared genes underwent two-sample Mendelian randomization (MR) using GTEx v8 testis eQTL instruments and FinnGen cryptorchidism data (261 cases and 374,410 controls). Exposure route was available for 104 reports; 93 (89.42%) documented transplacental/in utero exposure, whereas 11 other/non-in utero reports and four reports with missing route information were excluded from developmental interpretation. GPX7 and PLCL1 showed nominal inverse-variance-weighted associations, but neither survived Benjamini–Hochberg correction (both q = 0.399) or Bonferroni correction (adjusted p = 0.693 and 0.798, respectively). ACYP2 showed a borderline inverse association. Sensitivity estimators did not consistently support these signals. FAERS identified a VPA–cryptorchidism reporting signal, but cannot estimate incidence or establish causality. Prenatal interpretation was limited to 93 in utero reports. The integrated CTD, transcriptomic, and MR findings support exploratory candidate prioritization rather than a validated causal or mechanistic chain.
Introduction
Valproic acid (VPA) is a commonly prescribed broad-spectrum antiepileptic medication used extensively in treating pediatric epilepsy and various neuropsychiatric conditions. Despite its proven effectiveness, there are ongoing concerns about its developmental toxicity and reproductive safety, especially regarding birth defects and negative effects on the male reproductive system. For rare or delayed adverse effects, postmarketing pharmacovigilance databases are essential for identifying risks1,2.
Cryptorchidism is among the most prevalent congenital urogenital anomalies observed in the pediatric male population, with its etiology intricately linked to disrupted testicular descent, dysregulated hormonal signaling, genetic predispositions, and environmental exposures3. This condition not only impairs normal testicular development and subsequent fertility but also elevates the risk of testicular malignancies. Consequently, identifying risk factors for cryptorchidism, particularly those related to potential drug safety signals, is of significant clinical importance.
To date, the body of research examining the relationship between VPA exposure and cryptorchidism is limited, with a notable deficiency in systematic studies that integrate real-world pharmacovigilance data with multi-omics evidence. The FDA Adverse Event Reporting System (FAERS) is one of the most frequently used resources for postmarketing signal detection, and disproportionality metrics such as the reporting odds ratio (ROR), proportional reporting ratio (PRR), information component (IC), and empirical Bayes geometric mean (EBGM) are well-established tools for signal screening4,5,6,7,8. The Comparative Toxicogenomics Database (CTD) facilitates the exploration of chemical-associated targets and toxicological interaction networks9. Furthermore, public transcriptomic resources such as Gene Expression Omnibus (GEO) allow identification of disease-related differentially expressed genes (DEGs)10,11, while GTEx-based tissue-specific eQTL instruments and two-sample MR provide a genetics-informed framework for prioritizing candidate genes and testing potential causal relevance12,13,14.
In this study, we first screened FAERS for VPA-associated cryptorchidism reports and then restricted congenital-developmental interpretation to reports explicitly documenting transplacental/in utero exposure. We further integrated CTD-based toxicogenomic records, cryptorchidism transcriptomic profiling, and two-sample MR to prioritize candidate genes and generate experimentally testable hypotheses. This integration was not designed to prove that VPA causes cryptorchidism through the prioritized genes.
Protocol
Ethics statement
This study used only publicly available, de-identified, secondary human datasets (FAERS, CTD, GEO GSE16191, GTEx v8, and FinnGen Release 9). The investigators had no access to direct identifiers and did not contact participants. Accordingly, the study did not constitute human-subject research requiring institutional review board approval or additional informed consent under the applicable institutional policies. The original data-contributing studies obtained their own ethics approvals and participant consent where required, as documented by the respective data providers. All data were used in accordance with the terms of access and data-use requirements of the source databases.
Study design and analytical workflow
The current study utilized a multi-level analytical framework encompassing pharmacovigilance signal detection, toxicogenomic target mining, disease transcriptome integration, and genetics-informed candidate-gene prioritization. The FAERS component first established an overall cohort of 7,232 deduplicated VPA primary-suspect reports restricted to male patients aged ≤18 years. All baseline summaries, System Organ Class (SOC)- and preferred term (PT)-level signal analyses, and year-specific analyses of the VPA cohort used this same sex and age restriction. The nested cryptorchidism screening set comprised 108 reports within this cohort and was evaluated using exposure-route assessment and calendar-year signal-stability analysis. Subsequently, valproic acid-associated genes were obtained from CTD and intersected with cryptorchidism DEGs. Two-sample MR was then used as an additional prioritization layer for the shared genes. No step was considered experimental, mechanistic validation, or proof of a VPA-gene-cryptorchidism causal chain.
Data source and case selection process from FAERS
The adverse event data utilized in this study were sourced from the FAERS database, encompassing the timeframe from the first quarter of 2004 to the fourth quarter of 2025 (2004Q1–2025Q4; 88 quarterly releases). All 88 quarterly ASCII archives were downloaded from the official FDA FAERS quarterly-data archive on March 25, 2026. For every quarter, the DEMO, DRUG, REAC, THER, OUTC, INDI, and RPSR tables were imported. The FAERS data source, quarterly file structure, and downloadable archives were checked against the official FDA FAERS/AEMS documentation on the same date.
To mitigate the effects of duplicate reports, deduplication was conducted in accordance with the FDA-documented case version and quarterly extract conventions. Records were organized by CASEID, retaining the most recent entry based on FDA_DT; when records shared an identical FDA_DT, the record with the highest PRIMARYID was retained. The report-level VPA cohort was restricted a priori to male FAERS patients aged ≤18 years and to reports in which valproic acid or one of its formulations, standardized to the term “valproic acid,” was coded as a primary-suspect (PS) drug in ROLE_COD. After deduplication and application of these sex, age, and drug-role criteria, 7,232 unique case reports formed the report-level VPA cohort used for baseline characteristics and identification of the nested cryptorchidism subset. Cryptorchidism reports were identified by additionally requiring the MedDRA PT “Cryptorchidism” in REAC; 108 reports met this event criterion. For SOC- and PT-level disproportionality analyses, the deduplicated reports were expanded to unique PS drug–adverse-event pairs. Because one report can contain multiple PTs, the 7,232 VPA reports contributed 37,132 VPA–PT pairs. Thus, 7,232 and 37,132 represent different analytical units and are not competing cohort totals. The same pediatric male restriction and deduplication rules were applied to both units of analysis. Throughout the manuscript, “report” denotes a unique deduplicated FAERS case, whereas “drug–event pair” denotes one PS drug linked to one reported PT; SOC analyses were obtained by mapping PT-level pairs to their corresponding SOCs. “Pediatric population,” “pediatric patients,” and “pediatric male cohort” refer to male FAERS patients aged ≤18 years. “In utero exposure” refers specifically to reports coded as transplacental exposure in FAERS; “neonatal” is not used to describe the overall study population. The 108 reports constituted the broad pharmacovigilance screening set. For the exposure-focused developmental assessment, eligibility additionally required explicit FAERS coding of transplacental/in utero exposure. Of the 104 reports with exposure-route information, 93 met this criterion. Eleven reports with other/non-in utero exposure and four reports with missing route information were excluded from developmental etiologic interpretation, although retained in the screening audit trail. For descriptive summaries of the 7,232 eligible VPA-associated ADE reports, available-case denominators were defined separately for each variable. Sex, age, calendar year, and reporter type had complete information and, therefore, used N = 7,232. Reporting country was available for 4,752 reports and missing for 2,480 reports; consequently, all country percentages used N = 4,752 rather than the total analytic cohort. Route of administration was available for 7,213 reports and missing for 19 reports; route percentages used N = 7,213. Because a single report could contain more than one serious outcome, the outcome categories comprised 8,497 recorded outcome entries, and outcome percentages used the number of recorded outcome entries (N = 8,497), rather than the number of unique reports. Continuous variables were summarized using the available non-missing records and were not used as denominators for categorical percentages. For the cryptorchidism subset, serious-outcome codes were summarized on an outcome-record basis because FAERS permits multiple OUTC records for a single report. The six listed serious-outcome categories comprised 257 outcome records in total (congenital anomaly, 102; other serious outcome, 89; hospitalization, 39; disability, 20; death, 4; and life-threatening, 3). Percentages for these categories were calculated using N = 257 outcome records, not N = 108 eligible reports or N = 104 reports in the complete-case descriptive table; therefore, they describe the distribution of recorded serious-outcome codes rather than the proportion of reports or patients experiencing each outcome.
Disproportionality signal detection and definition of the reference background
For disproportionality analyses, the reference background was defined as all unique PS drug–PT pairs derived from deduplicated FAERS reports in males aged 18 years or younger during 2004Q1–2025Q4. Pairs involving valproic acid or its formulations coded as PS constituted the exposure group; pairs involving all other PS-coded drugs constituted the comparator group. The comparator was therefore neither a VPA-only non-event denominator nor an antiepileptic-drug-only background.
For each SOC or PT, the 2 × 2 contingency table was constructed from PS drug–event pairs as follows: a represented VPA–target-event pairs; b represented VPA–non-target-event pairs; c represented non-VPA PS drug–target-event pairs; and d represented non-VPA PS drug–non-target-event pairs. The cell definitions, populated cryptorchidism contingency table, marginal totals, and cryptorchidism-specific signal estimates are provided in Supplementary Table 1. ROR, PRR, IC, and EBGM were calculated from these four cell counts using the formulas and signal-detection thresholds provided in Supplementary Table 2. For the cryptorchidism PT, the observed pair counts were a = 108, b = 37,024, c = 743, and d = 6,565,089. Accordingly, the analysis included 37,132 VPA-associated PS drug–PT pairs and 6,565,832 non-VPA PS drug–PT pairs, for a total background of 6,602,964 pairs; 851 pairs contained the cryptorchidism PT. These pair counts should not be interpreted as numbers of unique patients or unique case reports.
This same FAERS-wide pediatric male comparator framework was applied to both SOC-level and PT-level signal detection. The resulting estimates should be interpreted as disproportionality signals based on spontaneous reporting data rather than incidence rates or class-comparative risks. Because FAERS lacks a defined exposed population denominator and systematic outcome ascertainment, neither the 108 reports nor the resulting disproportionality metrics can be used to estimate incidence, prevalence, absolute or relative risk, or to establish a causal relationship between valproic acid exposure and cryptorchidism.
Primary in utero exposure subset and geographic stratification
Following broad case screening, exposure-route information was reviewed to define the exposure-focused subset relevant to congenital cryptorchidism. Exposure route was recorded for 104 of 108 reports. Ninety-three reports (89.42% of reports with non-missing route data) were explicitly coded as transplacental exposure and were therefore classified as in utero exposure; these reports formed the primary subset for developmental interpretation. Eleven reports (10.58%) coded with other/non-in utero exposure and four reports with missing exposure-route information were excluded from prenatal etiologic interpretation and retained only for descriptive transparency and auditability. A postnatal VPA record was not considered biologically explanatory for congenital cryptorchidism. Importantly, transplacental coding indicates a reported exposure scenario but does not provide the gestational week, maternal dose, treatment duration, or a verified mother-child linkage; therefore, even the exposure-focused subset cannot establish the precise temporal sequence between VPA exposure and impaired testicular descent. The reporting country was summarized descriptively. Because country-specific exposure denominators were unavailable and stratified counts were sparse, no country-adjusted disproportionality regression was performed.
Assessment of potential confounders and unmeasured covariates
Because FAERS is a spontaneous reporting database, individual-level parental and in utero exposure-related covariates were not systematically available and could not be incorporated into a multivariable adjustment model. Potential confounders considered during interpretation included parental epilepsy or other underlying indications for VPA, epilepsy type and severity, seizure control during pregnancy, family history or genetic susceptibility to congenital reproductive anomalies, concomitant antiseizure medications or other pregnancy medications, folate use, maternal smoking, alcohol intake, diabetes, obesity, assisted reproduction, prematurity or low birth weight, and environmental or endocrine-disrupting exposures1,3. Because these variables were not consistently captured in FAERS, they were not used as exclusion criteria unless they directly affected the case definition; instead, they were treated as unmeasured confounders and addressed explicitly in the limitations.
Stability analysis of the signal
To describe calendar-year variation in the VPA-cryptorchidism reporting signal, separate year-specific 2 × 2 contingency tables were constructed using reports from each calendar year and the same FAERS-wide pediatric male comparator framework described above. Annual RORs were calculated only for years containing at least one report with valproic acid as the primary-suspect drug and cryptorchidism as the target PT (cell a > 0). For years in which cell a was zero, an annual ROR was considered non-estimable, and no point estimate was generated; these years are identified explicitly in Figure 1. For estimable years, the standard error of ln(ROR) was calculated as sqrt(1/a + 1/b + 1/c + 1/d), and the 95% confidence interval was calculated as ln(ROR) +/- 1.96 × SE before conversion to the log2 scale. Because each point represents a separate calendar-year estimate and several intervening years were non-estimable, the figure displays unconnected point estimates rather than a continuous line. Error bars denote 95% confidence intervals. The plot was generated in R using ggplot2. This analysis describes variation and persistence in spontaneous-reporting disproportionality and does not estimate incidence, represent a continuous biological trajectory, or establish causality.
Acquiring targets from CTD
The search term “valproic acid” was used to retrieve chemical-gene interaction records from the Comparative Toxicogenomics Database. The CTD database release available on March 25, 2026, was accessed and downloaded on March 25, 2026; this access-date-specific release is referred to throughout the manuscript as the CTD March 25, 2026 version. The CTD publication by Davis et al. was cited for the database methodology and curation framework rather than as the version identifier for the present extraction9. Species was restricted to Homo sapiens, and records supported only by non-human species were excluded. Eligible evidence comprised CTD-curated chemical-gene interactions, including direct molecular interaction/binding records and curated expression, activity, metabolic, transport, localization, stability, or post-translational regulatory records. CTD inferred disease-gene associations, pathway-only annotations, prediction-only entries, non-human-only records, and records without valid official human gene symbols were excluded. Multiple records mapping to the same official gene symbol were deduplicated. Because the primary extraction pooled heterogeneous action annotations and did not preserve a gene-level directional evidence table, increases and decreases in expression or activity, direct interactions, and non-directional “affects” records were not treated as equivalent evidence of a unidirectional VPA effect. Accordingly, the CTD-derived set was used only for broad toxicogenomic candidate screening, and VPA-to-gene regulatory direction could not be assigned reliably for the prioritized genes.
Analysis of cryptorchidism through transcriptomics
Raw CEL files and sample metadata for GSE16191 (GPL570) were obtained from GEO. The preprocessing workflow comprised robust multi-array average (RMA) background correction, quantile normalization, and log2 probe-set summarization using the affy package. Quality control included inspection of array-level intensity distributions and sample clustering before model fitting. Probe sets were annotated to official human gene symbols using hgu133plus2.db and AnnotationDbi. Affymetrix control probes, probe sets without a valid gene symbol, and probes mapping ambiguously to more than one gene symbol were removed. When several eligible probe sets mapped to the same gene, the probe set with the largest interquartile range across all 20 samples was retained; this outcome-independent variability rule was applied before differential-expression testing. A design matrix comparing the 16 cryptorchidism samples with the 4 controls was fitted using limma, empirical-Bayes moderated statistics were calculated, and p-values were adjusted using the Benjamini-Hochberg method. The primary DEG criterion was adjusted p < 0.05. Heatmap values were gene-wise z scores derived from the normalized log2 expression matrix. GSE16191 was selected because it provides human whole-testis transcriptomic data relevant to cryptorchidism rather than epididymal or animal tissue. According to the GEO series annotation, RNA was isolated from whole testicular tissue/testicular biopsies of cryptorchid boys aged 10 months to 4.5 years and age-matched controls. The dataset was generated on the GPL570 platform (Affymetrix Human Genome U133 Plus 2.0 Array) and contained 20 samples: 16 cryptorchidism samples, including 14 unilateral and 2 bilateral cryptorchidism samples, and 4 control samples labeled in GEO as controls by contralateral testicular aplasia. The differential-expression design matrix compared the cryptorchidism group with the control group. Because individual-level age and other clinical covariates were not fully available from the GEO record, no age-adjusted or covariate-adjusted differential-expression model was performed. The primary DEG criterion was adjusted p < 0.05; |log2FC|> = 1 with adjusted p < 0.05 was used as a more stringent visualization threshold for the volcano plot. For the heatmap, 10 representative, well-annotated DEGs meeting this stringent threshold were selected to provide a concise and legible illustration of between-group expression separation. The displayed genes were SRPX, COQ2, TKT, UNC5B, MAG, HIC1, ST6GALNAC4, DOK5, PCSK6, and HCP5. This 10-gene subset was used only for visualization and did not define the DEG set used in the CTD-overlap or downstream candidate-gene analyses, which used the complete set meeting the stated analytic criteria.
Identification of common candidate genes
By overlapping the CTD-derived valproic acid-associated genes with the DEGs obtained from the cryptorchidism transcriptomic dataset, 21 common genes were retained for subsequent MR-based prioritization. These shared genes were FUCA1, ACYP2, SLC35D1, ANKRD35, GPX7, PLCL1, ST7L, KANSL1-AS1, PLOD1, CCZ1B, UBXN2A, B4GALT7, MUC20, PMS2P5, SMIM8, POU5F1, SDK1, RAP1GAP, NAPRT, CSGALNACT1, and C4BPA. Of these, 12 genes were upregulated in cryptorchidism samples (FUCA1, ACYP2, ANKRD35, GPX7, PLCL1, ST7L, KANSL1-AS1, PLOD1, B4GALT7, SDK1, NAPRT, and CSGALNACT1), whereas 9 genes were downregulated (SLC35D1, CCZ1B, UBXN2A, MUC20, PMS2P5, SMIM8, POU5F1, RAP1GAP, and C4BPA). This overlap identified candidates for follow-up but did not establish that VPA regulated these genes in the same direction or that they mediated VPA-associated cryptorchidism.
Mendelian randomization analysis
To improve transparent reporting, the MR component was structured according to STROBE-MR reporting recommendations15. The MR workflow specifies the MR design, exposure and outcome data sources, genetic instrument selection, allele harmonization, weak-instrument assessment, core instrumental-variable assumptions, primary and sensitivity estimators, MR-Egger intercept testing, MR-PRESSO global and outlier diagnostics, reverse-causality considerations, multiplicity-conscious interpretation, and data availability. The MR analysis was designed as a candidate-gene prioritization step rather than an independent proof of causality. The reporting framework additionally incorporated general MR investigation guidance and explicit documentation of the outcome GWAS source, tissue-specific eQTL source, FUSION platform, genetic instrument selection, harmonization, pleiotropy diagnostics, and interpretation limits16,17,18,19.
A two-sample MR analysis was conducted utilizing genetically regulated signals associated with shared candidate genes as exposures, and cryptorchidism Genome-Wide Association Study (GWAS) summary statistics as the outcome. The exposure data were sourced from eQTL data specific to testis tissue, as provided by the GTEx version 8 multi-tissue expression panel through the FUSION platform. Considering that cryptorchidism represents a developmental anomaly of the male reproductive system, employing testis-specific eQTLs as instrumental variables ensures adequate tissue specificity and enhances biological plausibility. GTEx v8 and FUSION methodological references were used to document the origin of the eQTL-based genetically predicted expression instruments12,19.
For each overlapping candidate gene, genetically predicted testis-specific gene expression was treated as the exposure. SNPs associated with testicular expression at p < 5 × 10⁻⁸ were eligible as instruments. Instruments were clumped using an LD threshold of r2 < 0.001 within a 10,000-kb window, with the European reference panel used for LD estimation. Outcome proxies were not substituted for missing index variants. Exposure and outcome alleles were harmonized using the TwoSampleMR action = 2 convention; incompatible alleles and palindromic variants with ambiguous intermediate allele frequencies were excluded. Instrument strength was calculated as F = beta_exposure^2/SE_exposure^2, and instruments with F ≤ 10 were excluded. The direction of each MR estimate, therefore, represented the association of genetically predicted higher testicular expression with cryptorchidism risk.
Outcome data were obtained from FinnGen Release 9 (R9/DF9) for phenocode Q17_UNDES_TESTICLE (Undescended testicle), categorized under congenital malformations of genital organs. The R9 endpoint comprised 261 cases and 374,410 controls. The endpoint and control definitions were registry-based, and the FinnGen study citation was included to document the Finnish biobank population, registry-linked phenotype construction, quality-control framework, and GWAS analysis16. The original FinnGen study publication documents the Finnish biobank population, registry-linked phenotyping, quality-control framework, and GWAS analysis underlying this endpoint.
Instrumental variables were chosen according to specific criteria: single-nucleotide polymorphisms (SNPs) demonstrating significant associations with the exposure; independent loci maintained following linkage disequilibrium pruning; and the exclusion of palindromic SNPs with ambiguous strand orientation. The robustness of the instrumental variables was assessed using the F-statistic, where an F-value greater than 10 suggests the absence of substantial weak instrument bias.
The three core MR assumptions were addressed and reported explicitly. Instrument relevance was assessed using SNP-exposure associations and F-statistics. The independence and exclusion-restriction assumptions were evaluated indirectly through linkage disequilibrium pruning, allele harmonization, sensitivity analyses using alternative MR estimators, MR-Egger intercept testing, and MR-PRESSO global testing and outlier diagnostics20. Because these assumptions cannot be fully verified using summary-level data, and because pleiotropy tests are underpowered when the number of valid instruments is small, the MR component was interpreted conservatively.
Based on the quantity of valid instrumental variables available, the inverse variance weighted (IVW) method was employed as the primary analytical approach for genes associated with multiple SNPs. This was complemented by sensitivity analyses using the weighted median, MR-Egger, weighted mode, and simple mode methods. For genes with only a single valid SNP, the Wald ratio analysis was conducted. Directional horizontal pleiotropy was assessed using the MR-Egger intercept test. MR-PRESSO global testing was used to evaluate overall horizontal pleiotropy when methodologically applicable, and MR-PRESSO outlier detection was used to determine whether outlier-corrected estimates should be generated. When the MR-PRESSO global or outlier test did not identify significant outlying instruments, no outlier-corrected estimate was generated. Allele harmonization, IVW estimation, and sensitivity analyses followed the established two-sample MR workflow described by MR-Base/TwoSampleMR17.
Analyses were conducted in R. The principal packages and versions were data.table and dplyr for data handling; affy, GEOquery, limma, AnnotationDbi, and hgu133plus2.db for GEO preprocessing, annotation, and differential-expression analysis; TwoSampleMR and ieugwasr for instrument processing, harmonization, and MR estimation; MRPRESSO for pleiotropy and outlier diagnostics; and ggplot2 for visualization. Package names and versions are now reported to define the computational environment used for reproduction. For the 21 candidate-gene primary IVW tests, multiplicity was controlled using the Benjamini–Hochberg procedure, with an FDR-adjusted q value <0.05 defining multiplicity-adjusted statistical significance. Bonferroni-adjusted p values (21 tests; family-wise α = 0.05, equivalent unadjusted threshold p < 0.00238) were additionally reported as a conservative sensitivity measure. Unadjusted p values <0.05 were labeled nominal and were used only for exploratory candidate-gene prioritization; they were not interpreted as multiplicity-adjusted evidence. Instrument strength, number of SNPs, agreement across sensitivity estimators, absence of detectable directional pleiotropy, MR-PRESSO diagnostics, and biological plausibility were considered jointly when prioritizing candidate genes. Even when mean F-statistics exceeded 10, sparse instrument sets were considered an important limitation for MR-Egger regression and MR-PRESSO-based pleiotropy assessment.
Results
Baseline characteristics of valproic acid-associated ADE reports
A total of 7,232 valid reports of valproic acid-associated adverse drug events (ADEs) in male FAERS patients aged ≤18 years were included in the analysis (Table 1). This sex and age restriction was applied consistently to all analyses of the overall VPA cohort. Sex, age, calendar year, and reporter type were available for all 7,232 reports. The median age was 9.00 years (interquartile range [IQR]: 4.00–15.00). Weight was summarized descriptively among reports with non-missing weight information and had a median of 58.00 kg (IQR: 17.00–83.99); weight was not used as the denominator for any percentage. The annual number of reports fluctuated, reaching its highest in 2021 (570/7,232, 7.88%) and 2022 (568/7,232, 7.85%), and its lowest in 2025 (126/7,232, 1.74%). Reporter-type percentages also used N = 7,232: consumers constituted the largest group (2,296/7,232, 31.75%), followed by other health professionals (1,583/7,232, 21.89%) and physicians (1,376/7,232, 19.03%), with registered nurses contributing the fewest reports (2/7,232, 0.03%). The reporting country was recorded for 4,752 reports (65.71% of 7,232) and was missing for 2,480 reports (34.29%). Country-specific percentages were therefore calculated using N = 4,752: the United States accounted for 1,376/4,752 reports (28.96%), France for 749/4,752 (15.76%), and China for 241/4,752 (5.07%). Route of administration was available for 7,213 reports (99.74%) and missing for 19 reports (0.26%); route percentages, therefore, used N = 7,213. Because reports could contain multiple serious outcomes, the seven outcome categories represented 8,497 recorded outcome entries in total; outcome percentages used N = 8,497 recorded outcome entries and should not be interpreted as percentages of unique patients.
Discovery of cryptorchidism reports within the pediatric male VPA cohort
Within the 7,232-report VPA cohort restricted to male FAERS patients aged ≤18 years, application of the additional MedDRA PT “Cryptorchidism” criterion identified 108 reports. The baseline characteristics of these reports are summarized in Table 2. Although 108 reports met the inclusion criteria, Table 2 summarizes characteristics available for 104 reports (100% within the table denominator). The difference reflects missing characteristic information in four included reports and does not represent exclusion from the primary FAERS case analysis. These 108 reports represented the broad screening set rather than a uniformly verified prenatal-exposure cohort. Exposure-focused eligibility was evaluated separately using the FAERS route field. Serious outcomes were not mutually exclusive: one FAERS report could contain more than one OUTC code. The six outcome categories, therefore, summed to 257 outcome records, exceeding the 108 eligible reports. Using N = 257 outcome records as the denominator, congenital anomaly accounted for 102/257 (39.69%), other serious outcome for 89/257 (34.63%), hospitalization for 39/257 (15.18%), disability for 20/257 (7.78%), death for 4/257 (1.56%), and life-threatening for 3/257 (1.17%). These percentages should not be interpreted as report-level risks or patient-level outcome frequencies.
Primary in utero exposure subset and geographic distribution of VPA-associated cryptorchidism reports
Among the 108 broadly screened reports, the exposure route was available for 104. Ninety-three reports (89.42%) were explicitly coded as transplacental/in utero exposure and constituted the exposure-focused subset relevant to fetal testicular development. Eleven reports (10.58%) described other/non-in utero exposure, and four lacked exposure-route information; these 15 reports were excluded from developmental etiologic interpretation. Thus, no inference was made that postnatal VPA use could cause congenital cryptorchidism. The FAERS records did not consistently provide gestational week, maternal dose, or linked maternal-infant identifiers, so precise fetal exposure timing remained unavailable even within the 93-report subset. The reporting country was available for 82 reports and was concentrated in France (55/82, 67.07%), while the remaining reports were sparse across other countries. This geographic concentration and the absence of population exposure denominators require interpretation as a reporting pattern rather than a country-adjusted risk estimate.
Signal detection results of valproic acid-associated ADEs at the SOC level using the FAERS-wide comparator
A total of 25 System Organ Classes (SOCs) were represented among VPA-associated adverse-event pairs. Nine SOCs met the predefined positive-signal criteria (Table 3): congenital, familial, and genetic disorders; nervous system disorders; pregnancy, puerperium, and perinatal conditions; ear and labyrinth disorders; hepatobiliary disorders; psychiatric disorders; blood and lymphatic system disorders; eye disorders; and metabolism and nutrition disorders. Congenital, familial, and genetic disorders showed the strongest signal (ROR: 19.77, 95% CI: 19.13–20.44; PRR: 17.62, 95% CI: 16.94–18.32; IC025: 3.96; EBGM05: 15.68). Nervous system disorders and psychiatric disorders contributed the largest numbers of VPA-associated event pairs (7,081 and 5,417, respectively). The remaining 16 SOCs did not meet the complete positive-signal criteria. These estimates compared VPA-associated PS drug–event pairs with pairs involving all other PS-coded drugs in the pediatric male FAERS background.
Signal detection results of valproic acid-associated ADEs at PT level using the FAERS-wide comparator
A total of 242 Preferred Terms (PTs) met the predefined positive-signal criteria (Table 4). The strongest signals were predominantly congenital or neurodevelopmental. Foetal anticonvulsant syndrome had the highest ROR (941.10, 95% CI: 749.92–1181.02; EBGM05: 124.61), while ear, nose and throat disorder (ROR: 730.45, 95% CI: 388.49–1373.38; EBGM05: 85.09) and neural tube defect (ROR: 487.10, 95% CI: 347.34–683.08; EBGM05: 98.96) also showed strong disproportionality. Other high-intensity PTs included visuospatial deficit, congenital nose malformation, and dyspraxia. By reporting volume, foetal exposure during pregnancy was the most frequent PT (1,283 VPA–PT pairs), followed by seizure (503) and foetal anticonvulsant syndrome (463). Dysmorphism, epilepsy, developmental delay, and autism spectrum disorder also contributed substantial numbers of pairs. These PT-level signals used the same FAERS-wide pediatric male PS drug–PT comparator and should be interpreted as reporting disproportionality rather than incidence or risk.
Results from the analysis of signal stability
The year-specific analysis showed positive log2(ROR) estimates in all estimable years, with the highest point estimates observed in 2022 and 2023. No annual ROR was estimated for 2004, 2006, 2007, 2009, 2010, 2013, 2014, 2024, or 2025 because no VPA-associated cryptorchidism report was present in those calendar years. Figure 1, therefore, shows unconnected annual point estimates with 95% confidence intervals and explicitly marks non-estimable years, avoiding the implication of a continuous time trajectory. Although elevated reporting disproportionality was observed in the most recent estimable years, between-year differences may reflect sparse counts, reporting practices, or stimulated reporting. FAERS lacks exposure denominators; consequently, these values cannot be interpreted as annual incidence rates or evidence of causality. This analysis used the broad pharmacovigilance screening framework and does not verify maternal exposure during pregnancy for every report or resolve fetal exposure timing.
Analysis results of cryptorchidism transcriptomics and CTD target mining
Transcriptomic profiling of the cryptorchidism dataset GSE16191 identified a total of 1,628 DEGs between cryptorchidism and control samples after background correction, normalization, and limma-based differential expression analysis (Figure 2). Among these DEGs, 869 genes were upregulated, and 759 were downregulated. Using the more stringent visualization threshold of |log2FC|> = 1 and adjusted p < 0.05, 310 robust DEGs were retained, including 78 upregulated and 232 downregulated genes. Figure 2A displays normalized expression for 10 representative, well-annotated DEGs selected from this robust set for legible visualization of group separation: SRPX, COQ2, TKT, UNC5B, MAG, HIC1, ST6GALNAC4, DOK5, PCSK6, and HCP5. Figure 2B presents the volcano plot for the complete transcriptomic comparison. The 10-gene heatmap was illustrative only; all eligible DEGs, rather than these 10 genes alone, were carried forward to the CTD-overlap analysis. Among the most markedly upregulated genes in the full analysis were HINT3 (logFC = 2.270), ODF3B (logFC = 2.227), and SRPX (logFC = 2.129), whereas LOC100131541 (logFC = -2.113), DKFZP434L187 (logFC = -2.107), MALAT1 (logFC = -2.067), and PCSK6 (logFC = -2.011) were among the most prominently downregulated transcripts. These findings demonstrated broad transcriptional alterations in cryptorchidism and provided a disease-associated molecular background for subsequent integrative analysis with CTD-derived valproic acid targets. By intersecting the CTD-derived valproic acid-associated targets with the complete eligible cryptorchidism-related DEG set, a subset of overlapping genes potentially involved in valproic acid-associated cryptorchidism was identified for downstream prioritization. The transcriptomic analysis was based on human whole-testis samples from GSE16191, including 16 cryptorchidism samples and 4 controls from boys aged 10 months to 4.5 years, thereby providing a tissue-relevant but small-sample transcriptomic background for candidate-gene prioritization.
The CTD-derived set was based on curated human chemical-gene interaction records rather than inferred disease associations or prediction-only entries. However, because heterogeneous evidence types and action annotations were pooled and a gene-level VPA direction table was not retained, the overlap cannot distinguish direct targets from indirect regulatory responses or determine whether VPA increases or decreases each candidate gene. The overlapping genes should therefore be interpreted only as candidate toxicogenomic signals for prioritization.
Directionality was examined across the evidence layers where it was interpretable. GPX7 and PLCL1 were upregulated in cryptorchidism tissue, while genetically predicted higher testicular expression was nominally associated with higher cryptorchidism risk; thus, the disease-expression and primary MR directions were concordant for these two genes. In contrast, ACYP2 was upregulated in cryptorchidism tissue but showed a borderline inverse MR estimate, indicating discordance between the disease-expression and MR directions. For all three genes, the direction of VPA regulation could not be established from the pooled CTD extraction. Therefore, no candidate demonstrated a complete and reliable VPA-regulation/disease-expression/MR-effect chain.
Insights from the analysis of shared candidate genes and Mendelian randomization
In the primary MR analysis, IVW estimates were available for 21 shared candidate genes (Table 5). At the exploratory nominal threshold (unadjusted p < 0.05), genetically predicted higher GPX7 expression was associated with an increased risk of cryptorchidism (OR = 1.279, 95% CI: 1.020–1.603, nominal p = 0.033), and a similar positive association was observed for PLCL1 (OR = 1.303, 95% CI: 1.015-1.673, nominal p = 0.038). After correction across the 21 primary IVW tests, neither association remained significant: the Benjamini–Hochberg FDR q value was 0.399 for both genes, and the Bonferroni-adjusted p values were 0.693 for GPX7 and 0.798 for PLCL1. No candidate gene met FDR q < 0.05 or the Bonferroni-equivalent unadjusted threshold of p < 0.00238. ACYP2 showed a borderline inverse association in the IVW analysis (OR = 0.760, 95% CI: 0.569–1.015, nominal p = 0.063; FDR q = 0.441; Bonferroni-adjusted p = 1.000). All other genes had nominal p > 0.05 and were also non-significant after multiplicity correction. Accordingly, GPX7 and PLCL1 were retained only as exploratory prioritization signals rather than multiplicity-adjusted findings.
Sensitivity analyses did not consistently support the nominal IVW signals. The weighted median estimates for GPX7 and PLCL1 were directionally consistent but not statistically significant (GPX7: OR = 1.265, 95% CI: 0.981-1.632, p = 0.070; PLCL1: OR = 1.272, 95% CI: 0.952-1.698, p = 0.103). ACYP2 retained an inverse direction in the weighted median analysis but remained non-significant (OR = 0.756, 95% CI: 0.547-1.045, p = 0.091). MR-Egger estimates were also non-significant and imprecise for GPX7 (OR = 1.171, 95% CI: 0.514-2.664, p = 0.743), PLCL1 (OR = 0.635, 95% CI: 0.070-5.717, p = 0.725), and ACYP2 (OR = 0.709, 95% CI: 0.006-78.946, p = 0.899). Although Egger intercept tests were non-significant for these genes (GPX7: p = 0.179; PLCL1: p = 0.398; ACYP2: p = 0.727), these results were interpreted cautiously because the corresponding instrument numbers were small (GPX7: 4 SNPs; PLCL1: 7 SNPs; ACYP2: 4 SNPs).
MR-PRESSO global tests were non-significant for the primary candidate genes (GPX7: p = 0.991; PLCL1: p = 0.917; ACYP2: p = 0.985). Additional genes for which MR-PRESSO global p values were available also showed non-significant results, including SDK1 (p = 0.575), MUC20 (p = 0.967), PMS2P5 (p = 0.721), and UBXN2A (p = 0.970). Therefore, no MR-PRESSO outlier-corrected estimates were generated. However, the absence of statistically detectable pleiotropy should not be interpreted as definitive exclusion of horizontal pleiotropy, because the analyses were constrained by sparse instruments and by the limited number of cryptorchidism cases in the GWAS outcome dataset. In accordance with the STROBE-MR-oriented reporting strategy, the nominal IVW associations for GPX7 and PLCL1 were interpreted as exploratory gene-prioritization signals rather than robust genetic causal evidence; neither association survived correction for the 21 candidate-gene tests.
Overall, FAERS identified a VPA-associated cryptorchidism reporting signal, with developmental interpretation restricted to reports documenting transplacental/in utero exposure. Integration of CTD, transcriptomic, and MR evidence prioritized GPX7 and PLCL1 as exploratory candidates; however, the MR associations did not remain significant after multiple-testing correction and did not establish a validated causal or mechanistic relationship.
DATA AVAILABILITY:
All primary datasets used in this study are publicly accessible from their original sources. The FAERS quarterly ASCII files covering 2004Q1–2025Q4 are available from the U.S. Food and Drug Administration. Valproic acid-associated human chemical–gene interaction records are available from the Comparative Toxicogenomics Database. The cryptorchidism transcriptomic dataset is available from the Gene Expression Omnibus under accession GSE16191. Testis-specific eQTL data are available through GTEx, and cryptorchidism outcome summary statistics are available from FinnGen Release 9 under endpoint Q17_UNDES_TESTICLE. Derived numerical data supporting the principal findings are included in the manuscript and supplementary files. The analysis code and additional derived data supporting the tables, figures, CTD–DEG overlap, and Mendelian randomization analyses have not been deposited in a public repository and therefore do not have an accession number or DOI. These materials are available from the corresponding author upon reasonable request.
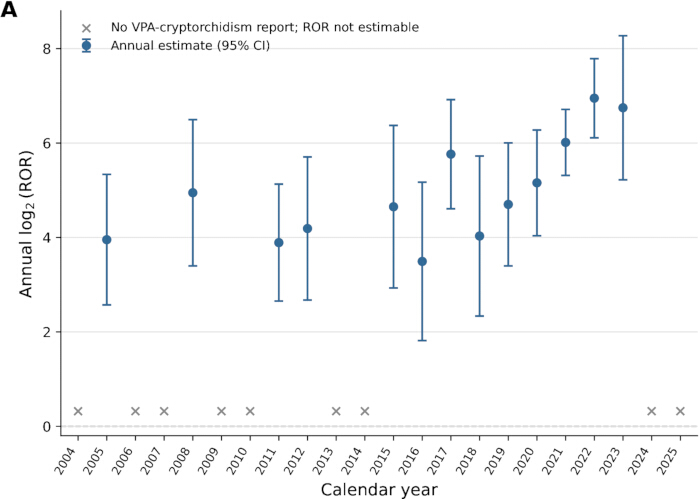
Figure 1: Annual pattern of ROR for cryptorchidism associated with valproic acid in the FAERS database from 2004Q1 to 2025Q4. Points represent annual log₂(ROR) estimates, and error bars indicate 95% confidence intervals. Years without VPA-associated cryptorchidism reports are indicated as non-estimable. Please click here to view a larger version of this figure.
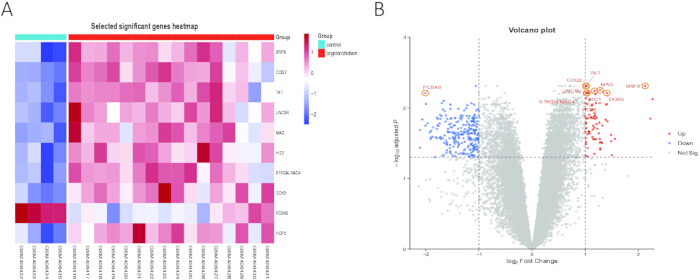
Figure 2: Transcriptomic alterations in cryptorchidism testicular tissue. (A) Heatmap of 10 representative, well-annotated DEGs meeting |log2FC|> = 1 and adjusted p < 0.05: SRPX, COQ2, TKT, UNC5B, MAG, HIC1, ST6GALNAC4, DOK5, PCSK6, and HCP5. The heatmap displays row-scaled normalized expression across 4 control and 16 cryptorchidism samples and was limited to 10 genes to maintain visual clarity; this subset was not used to restrict the downstream CTD-overlap analysis. Red and blue indicate relatively higher and lower row-scaled expression, respectively. (B) Volcano plot of the complete differential-expression analysis. Red indicates upregulated genes, blue indicates downregulated genes, and gray indicates genes not meeting the stringent visualization threshold (|log2FC|> = 1 and adjusted p < 0.05). Please click here to view a larger version of this figure.
Table 1: Basic Characteristics of Valproic Acid-associated ADE Reports in Males Aged ≤18 Years (FAERS, 2004Q1–2025Q4). Please click here to download this Table.
Table 2: Characteristics of the 108 broadly screened valproic acid-associated cryptorchidism reports, including the exposure-focused transplacental/in utero subset, reporting-country distribution, and serious-outcome records. The overall analysis included 108 reports. Percentages in the table were calculated using non-missing denominators for each characteristic; the maximum available denominator for the presented characteristics was 104. *The overall eligible case set comprised 108 reports. Four reports with incomplete core case-characteristic fields were retained in overall case identification and pharmacovigilance analyses but excluded only from the complete-case descriptive table. Therefore, the default denominator for Year, Sex, Reporter, and Route in Table 2 is n=104 unless otherwise specified. †Reporting country was available for 82 reports; therefore, country-specific percentages were calculated using n=82 as the denominator. The concentration of reports from France (55/82, 67.07%) indicates regional reporting concentration and possible stimulated reporting, which limits geographic generalizability. ‡Route information was available for 104 reports. Transplacental exposure accounted for 93/104 reports (89.42%), whereas 11/104 reports (10.58%) were coded as other/non-transplacental or unclear. These reports were retained for descriptive completeness because FAERS exposure-route coding may be incomplete or inconsistently recorded, but they should not be interpreted as evidence that postnatal valproic acid exposure causes cryptorchidism. §Outcome categories are not mutually exclusive because one FAERS report may contain more than one serious-outcome code. The six listed categories comprise 257 outcome records in total (102 + 89 + 39 + 20 + 4 + 3 = 257). Percentages were calculated using N=257 outcome records, not N=108 eligible reports or N=104 complete-case reports; they describe the distribution of recorded outcome codes and are not report-level or patient-level outcome frequencies. Please click here to download this Table.
Table 3: Disproportionality signal-detection results for 25 System Organ Classes (SOCs) represented among valproic acid-associated PS drug–event pairs. Nine SOCs met all predefined positive-signal criteria. Please click here to download this Table.
Table 4: Disproportionality signal-detection results for the 242 MedDRA Preferred Terms (PTs) that met the predefined positive-signal criteria among valproic acid-associated PS drug–PT pairs. Please click here to download this Table.
Table 5: Summary of Mendelian randomization results for shared candidate genes. Nominal IVW p values, Benjamini–Hochberg FDR q values, and Bonferroni-adjusted p values are reported; FDR q < 0.05 defines multiplicity-adjusted significance, whereas nominal p < 0.05 is exploratory. Please click here to download this Table.
Supplementary Table 1: Fully populated 2 × 2 contingency table based on PS drug–PT pairs, with cell definitions, marginal totals, reference background, and cryptorchidism-specific signal estimates. The 37,132 VPA-associated pairs were derived from 7,232 unique deduplicated VPA case reports because each report could contain multiple PTs.Please click here to download this file.
Supplementary Table 2: Formulas and signal-detection thresholds for ROR, PRR, IC, and EBGM using the FAERS-wide pediatric male comparator framework.Please click here to download this file.
Discussion
The broad FAERS screen identified disproportionate reporting of cryptorchidism with VPA, but the congenital-developmental interpretation was restricted to the 93 reports explicitly coded as transplacental/in utero exposure. The 11 other/non-in utero reports and 4 reports with missing exposure route were not used to support prenatal causation. Within this restricted framework, CTD, disease transcriptomics, and MR were integrated to prioritize genes and formulate hypotheses, not to establish that VPA causes cryptorchidism through GPX7, PLCL1, ACYP2, or any other gene. The MR component showed only exploratory nominal IVW associations for GPX7 and PLCL1; both had FDR q = 0.399, and neither survived Bonferroni correction across 21 tests. Together with the non-significant sensitivity estimators, these multiplicity-adjusted results do not support robust causal links. The integrated findings should therefore be interpreted as pharmacovigilance signal detection and exploratory candidate-gene prioritization rather than mechanistic or causal validation. The candidate-gene results can be discussed in the context of testicular descent and developmental stress responses, but such biological plausibility should not be confused with a demonstrated mechanism. Normal testicular descent requires coordinated Leydig-cell hormone signaling, including INSL3 and testosterone, gubernacular development, and survival of developing testicular and supporting tissues21. VPA is a histone deacetylase inhibitor with recognized teratogenic potential22, and experimental studies in other developmental or cellular contexts have linked VPA to oxidative stress, apoptosis, endoplasmic-reticulum stress, calcium release, and impaired antioxidant protection23,24. These observations provide a hypothesis-generating context for GPX7, PLCL1, and ACYP2 but do not show that these genes mediate VPA-associated cryptorchidism25.
GPX7 is an ER-associated glutathione peroxidase involved in controlling H2O2 generated during ERO1-mediated oxidative protein folding26. GPX7 was upregulated in the cryptorchidism transcriptomic dataset, and genetically predicted higher expression showed a nominal positive IVW association with cryptorchidism risk. These two layers are directionally concordant. However, the pooled CTD extraction does not establish whether VPA increases or decreases GPX7 in fetal testicular or gubernacular tissue. GPX7 should therefore be regarded as an ER-redox candidate for experimental follow-up, not as a demonstrated mediator of VPA-induced cryptorchidism.
PLCL1 encodes phospholipase C-like 1, a catalytically inactive phospholipase C-related protein. PRIP proteins, including PLCL1/PLCL2, have been implicated in phosphoinositide-related signaling, calcium regulation, and reproductive endocrine regulation in experimental models27. PLCL1 was upregulated in cryptorchidism tissue, and genetically predicted higher expression showed a nominal positive IVW association, making the disease-expression and primary MR directions concordant. Nevertheless, the direction of VPA regulation was unresolved, and the sensitivity estimators did not provide consistent significant support. PLCL1, therefore, remains a candidate for follow-up rather than a validated mechanistic link. ACYP2 requires still greater caution. ACYP2 encodes an acylphosphatase, and acylphosphatase activity has been reported to modulate Ca2+ transport and Ca2+-ATPase activity in sarcoplasmic/endoplasmic-reticulum calcium-pump systems28. ACYP2 was upregulated in cryptorchidism tissue, whereas genetically predicted higher expression showed a borderline inverse IVW estimate. The disease-expression and MR directions were therefore discordant, and the direction of VPA regulation was unresolved. ACYP2 cannot be interpreted as a protective gene, a direct VPA target, or a mediator of VPA-associated cryptorchidism; it is only an exploratory candidate that may reflect compensatory remodeling or disease consequences. These mechanisms require experimental validation. Future cell-based studies could expose Leydig-like cells, Sertoli-like cells, germ-cell models, gubernacular fibroblast-like cells, primary testicular cells, or human testicular organoids to clinically relevant VPA concentrations and then measure GPX7, PLCL1, and ACYP2 expression by qPCR and western blotting. Mechanistic readouts should include ROS production, glutathione peroxidase activity, GSH/GSSG balance, lipid peroxidation, ER-stress markers such as GRP78/BiP, PERK-eIF2α-ATF4, ATF6, IRE1α, and CHOP, calcium imaging, mitochondrial dysfunction, and apoptosis markers including BAX/BCL2 ratio, cleaved caspase-3, and TUNEL staining. Rescue experiments using antioxidants, ER-stress inhibitors, calcium-signaling modulators, or siRNA/overexpression of GPX7, PLCL1, and ACYP2 would help determine whether these genes are mechanistic mediators rather than statistical overlap signals. By integrating FAERS signal detection, CTD records, transcriptomic profiling, and MR, this work provides a structured approach for prioritizing candidate genes in developmental pharmacovigilance29. The evidence layers are complementary but not independent proof of mechanism, and their overlap does not demonstrate pathway dependence or direct target engagement. The principal contribution is hypothesis generation and prioritization for future experimental testing rather than mechanistic validation30.
All FAERS analyses of the overall VPA cohort were restricted to male patients aged ≤18 years, and the 108 cryptorchidism reports were nested within this 7,232-report cohort. Several important limitations must be acknowledged. As a spontaneous reporting system, FAERS is subject to underreporting, reporting bias, duplicate entries, and missing exposure denominators, preventing direct estimation of absolute risk or definitive causal inference31,32. Transcriptomic results may be influenced by sample source, platform variability, and differential expression thresholds33. For MR, the limited number of cryptorchidism cases in the GWAS and restricted tissue-specific eQTL instruments reduced statistical power34. In addition, we could not adjust for confounding factors such as comorbidities, concurrent medications, or precise periconceptional exposure windows. Because the primary disproportionality analysis used all other PS-coded drugs in FAERS as the comparator rather than an antiepileptic-drug-only comparator, residual confounding by indication, disease severity, co-medication patterns, and drug-class effects cannot be excluded. Exposure-route review identified 93 explicitly transplacental/in utero reports; these formed the sole basis for developmental interpretation. The 11 other/non-in utero reports and 4 reports with missing route information were excluded from prenatal etiologic interpretation and retained only in the broad screening audit trail. Postnatal VPA use cannot biologically explain the fetal origin of congenital cryptorchidism. Nevertheless, the transplacental route code alone does not verify gestational week, maternal dose, adherence, or mother-child linkage, so residual exposure misclassification and temporal uncertainty remain. The case distribution was also geographically imbalanced, with most reports with available country information originating from France and only one report from the United States. Because of sparse counts outside France and the absence of country-specific exposure denominators in FAERS, statistical adjustment for reporting country was not reliable; this regional concentration may reflect stimulated reporting, country-specific pharmacovigilance practices, regulatory history, or reporting awareness. The CTD target-mining step was also dependent on database annotation and target-selection criteria. Although we restricted extraction to human curated chemical-gene interaction records and excluded inferred disease associations or prediction-only entries, the retained records included heterogeneous curated evidence types, including direct actions and expression/regulatory changes. Therefore, the CTD-derived gene set should be viewed as a hypothesis-generating toxicogenomic set rather than a definitive list of direct valproic acid targets. The GSE16191 dataset itself also has important constraints. Although it provides human whole-testis transcriptomic data from pediatric patients with cryptorchidism and age-matched controls, the sample size was small, particularly for the control group, and the GEO record did not provide complete individual-level age or clinical covariates for covariate-adjusted modeling. In addition, the control samples were labeled as controls by contralateral testicular aplasia rather than population-based healthy testes. Therefore, the DEGs should be interpreted as disease-associated transcriptomic signals for exploratory prioritization rather than definitive causal or universally generalizable biomarkers. The discrepancy between the total analytic cohort (108 reports) and the Table 2 characteristic denominator (104 reports) reflects incomplete reporting of selected variables, a common feature of spontaneous reporting databases. More specifically, the FAERS signal quantifies relative reporting disproportionality within the selected database background; it does not measure the frequency of cryptorchidism among all VPA-exposed pregnancies or children. Accordingly, it cannot be converted into an incidence proportion and cannot establish that VPA caused the reported events. The integrated analysis also lacks a complete directionally resolved mechanistic chain. The CTD extraction pooled heterogeneous evidence types without a retained gene-level action-direction table; cryptorchidism DEGs may be causes, compensatory responses, or consequences of disease; and the MR findings were nominal, based on sparse instruments, and not consistently supported across sensitivity estimators. Consequently, overlap among CTD records, DEGs, and MR results cannot establish mediation of a VPA effect.
Although the MR workflow followed STROBE-MR reporting recommendations15, the analysis remains constrained by the available summary-level data. The primary candidate genes had mean F-statistics above the conventional threshold of 10 in Table 5 (GPX7: 152.89; PLCL1: 107.69; ACYP2: 56.84), suggesting no obvious weak-instrument problem by this criterion. However, the number of instruments was small (4, 7, and 4 SNPs, respectively), and the cryptorchidism GWAS outcome dataset included only 261 cases. Under these sparse-instrument and low-event conditions, MR-Egger regression and MR-PRESSO have limited power to detect horizontal pleiotropy. Therefore, non-significant Egger intercept tests and MR-PRESSO global tests should be interpreted as no detectable evidence of horizontal pleiotropy rather than definitive evidence that pleiotropy was absent. Individual-level covariate adjustment, detailed ancestry-stratified analyses, non-linear MR, and formal assessment of all potential confounding pathways were not possible. Because the outcome GWAS was derived from the FinnGen registry-based undescended-testicle endpoint, its population source and phenotype definition are explicitly documented16. The endpoint should be interpreted as a registry-coded congenital-malformation phenotype rather than a uniformly re-examined clinical cohort, and generalizability beyond the FinnGen population may be limited. Reverse causality was also considered. Within the MR framework, reverse causation from cryptorchidism status to germline genetic variants is unlikely because germline variants are fixed before disease development. Nevertheless, the candidate-gene selection step incorporated disease transcriptomic data from GSE16191, and some expression differences may reflect downstream consequences of cryptorchidism rather than upstream causal mechanisms. Bidirectional MR could not be performed because robust genetic instruments for cryptorchidism as an exposure were not available. These limitations reinforce the interpretation of the MR component as exploratory gene prioritization rather than causal validation.
Unmeasured confounding by parental disease and in utero environmental factors is another important limitation. Although the reviewer appropriately raises whether parental epilepsy itself could be an independent risk factor for cryptorchidism, FAERS does not provide sufficient structured information to evaluate this possibility. The database also lacks reliable individual-level data on epilepsy subtype, seizure frequency and severity, maternal comorbidities, family history of cryptorchidism or congenital anomalies, concomitant antiseizure medication polytherapy, other pregnancy medications, folic acid supplementation, smoking, alcohol intake, diabetes, obesity, assisted reproduction, gestational age, birth weight, and environmental or endocrine-disrupting exposures1,3. Consequently, the observed VPA-cryptorchidism disproportionality signal may reflect in utero VPA exposure, confounded by indication or disease severity, co-medication patterns, concomitant teratogenic exposures, or differential reporting behavior. These factors could not be adjusted for in the spontaneous-reporting framework and should be systematically considered when interpreting the association. Prospective pregnancy registries or birth-cohort studies with detailed maternal disease characteristics, medication dose and timing, lifestyle factors, and environmental exposure measurements are required to separate drug-specific effects from these competing explanations. Alternative strategies to test the VPA-cryptorchidism hypothesis include prospective birth cohort studies with detailed exposure timing and dose data, in vitro testicular organoid models, and in vivo animal experiments to directly assess VPA’s effects on testicular descent and gene expression. Targeted pathway analyses, epigenomic profiling, and single-cell transcriptomics could also clarify VPA-induced regulatory disruptions beyond bulk gene expression changes. These methods complement observational signal detection and can provide more direct mechanistic evidence. At the experimental level, a practical first-step validation would be to test whether VPA induces GPX7 upregulation, PLCL1/ACYP2 perturbation, oxidative injury, ER-stress activation, calcium-homeostasis disruption, and apoptosis in testicular or gubernacular cell models. Demonstrating attenuation of these changes after antioxidant treatment, ER-stress inhibition, or gene-specific modulation would provide stronger evidence for pathway involvement than database overlap, MR prioritization, or docking-like computational convergence alone.
The integrated method used here may support early signal assessment and candidate prioritization in pediatric clinical pharmacology, reproductive toxicology, and developmental pharmacovigilance. By combining spontaneous-reporting data with toxicogenomic, transcriptomic, and genetics-informed evidence, the framework identifies hypotheses for subsequent cell, organoid, animal, and prospective epidemiologic testing. It should not be presented as a mechanistic validation or as proof of a drug-gene-outcome causal pathway.
Future research should expand the GWAS sample size for cryptorchidism to improve MR power, incorporate single-cell transcriptomic data of developing testicular tissue, and conduct long-term prospective epidemiologic studies with precise VPA exposure quantification. Further experimental validation of candidate pathways and VPA dose-response relationships will help clarify causality. Ultimately, such work will support evidence-based risk stratification and help clinicians balance seizure control with reproductive safety when considering VPA use during pregnancy or in pediatric patients.
Disclosures
The authors declare that they have no competing financial interests, personal relationships, or other conflicts of interest that could have influenced the work reported in this manuscript.
The authors declare that no artificial intelligence (AI) or AI-assisted technologies were used at any stage of this work, including the study design, data collection, analysis, interpretation, literature search, or writing of the manuscript. All content was solely generated and reviewed by the authors.
Acknowledgements
This work was supported by the Medical Science Research Project of Hebei (No. 20241600).
Materials
| Name | Company | Catalog Number | Comments |
|---|---|---|---|
| AnnotationDbi | R package | version 1.66.0 | |
| Comparative Toxicogenomics Database (CTD) | Mount Desert Island Biological Laboratory | https://ctdbase.org/ | Public toxicogenomics resource used to retrieve valproic acid-associated gene targets |
| Cryptorchidism GWAS summary statistics | Public GWAS resource | Q17_UNDES_TESTICLE | Outcome dataset for undescended testicle used in two-sample Mendelian randomization; 261 cases and 374,410 controls |
| data.table | R package | version 1.16.0 | |
| dplyr | R package | version 1.1.4 | Used for data handling |
| FDA Adverse Event Reporting System (FAERS) quarterly data files | U.S. Food and Drug Administration | https://fis.fda.gov/extensions/FPD-QDE-FAERS/FPD-QDE-FAERS.html | Public spontaneous-reporting database used for pediatric valproic acid safety-signal detection |
| FUSION TWAS / eQTL platform | FUSION | N/A | Resource used to access testis-tissue eQTL summary statistics for Mendelian randomization |
| GEOquery | R package | version 2.72.0 | |
| ggplot2 | R package | version 3.5.1 | Used for visualization |
| GTEx v8 eQTL resource | GTEx Consortium | version 8 | Testis-tissue expression quantitative trait locus data used as exposure instruments |
| hgu133plus2.db | R package | version 3.13.0 | Used for GEO preprocessing, annotation, and differential-expression analysis |
| ieugwasr | R package | version 1.0.0 | Used for instrument processing, harmonization, and MR estimation |
| limma | Bioconductor | version 3.60.6 | R package used for background correction, normalization, and differential-expression analysis |
| MRPRESSO | R package | version 1.0 | Package used to test for global pleiotropy and outlier effects in Mendelian randomization |
| R statistical software | R Foundation for Statistical Computing | version 4.4.2 | Statistical environment used for FAERS processing, transcriptomic analysis, and Mendelian randomization |
| TwoSampleMR | MRC IEU / OpenGWAS | version 0.6.8 | R package used for primary two-sample Mendelian randomization analyses |
References
- Tomson T, et al. Comparative risk of major congenital malformations with eight different antiepileptic drugs: a prospective cohort study of the EURAP registry. Lancet Neurol. 2018;17(6):530–538.
- Tallon E, O'Donovan L, Delanty N. Reversible male infertility with valproate use: a review of the literature. Epilepsy Behav Rep. 2021;16:100446.
- Gurney JK, et al. Risk factors for cryptorchidism. Nat Rev Urol. 2017;14(9):534–548.
- Jin Y, Fan M, Zheng X, Zhu S. Post-marketing safety of finerenone: a disproportionality analysis of the FDA adverse event reporting system. Expert Opin Drug Saf. 2025;24(9):1047–1052.
- Evans SJ, Waller PC, Davis S. Use of proportional reporting ratios (PRRs) for signal generation from spontaneous adverse drug reaction reports. Pharmacoepidemiol Drug Saf. 2001;10(6):483–486.
- Rothman KJ, Lanes S, Sacks ST. The reporting odds ratio and its advantages over the proportional reporting ratio. Pharmacoepidemiol Drug Saf. 2004;13(8):519–523.
- Bate A, et al. A Bayesian neural network method for adverse drug reaction signal generation. Eur J Clin Pharmacol. 1998;54(4):315–321.
- DuMouchel W. Bayesian data mining in large frequency tables, with an application to the FDA Spontaneous Reporting System. Am Stat. 1999;53(3):177–190.
- Davis AP, et al. Comparative Toxicogenomics Database (CTD): update 2023. Nucleic Acids Res. 2023;51(D1):D1257–D1262.
- Barrett T, et al. NCBI GEO: archive for functional genomics data sets—update. Nucleic Acids Res. 2013;41(Database issue):D991–D995.
- Ritchie ME, et al. limma powers differential expression analyses for RNA-sequencing and microarray studies. Nucleic Acids Res. 2015;43(7):e47.
- GTEx Consortium. The GTEx Consortium atlas of genetic regulatory effects across human tissues. Science. 2020;369(6509):1318–1330.
- Bowden J, Davey Smith G, Haycock PC, Burgess S. Consistent estimation in Mendelian randomization with some invalid instruments using a weighted median estimator. Genet Epidemiol. 2016;40(4):304–314.
- Bowden J, Davey Smith G, Burgess S. Mendelian randomization with invalid instruments: effect estimation and bias detection through Egger regression. Int J Epidemiol. 2015;44(2):512–525.
- Skrivankova VW, et al. Strengthening the reporting of observational studies in epidemiology using Mendelian randomisation (STROBE-MR): explanation and elaboration. BMJ. 2021;375:n2233.
- Kurki MI, et al. FinnGen provides genetic insights from a well-phenotyped isolated population. Nature. 2023;613(7944):508–518.
- Hemani G, et al. The MR-Base platform supports systematic causal inference across the human phenome. eLife. 2018;7:e34408.
- Burgess S, et al. Guidelines for performing Mendelian randomization investigations: update for summer 2023. Wellcome Open Res. 2019;4:186.
- Gusev A, et al. Integrative approaches for large-scale transcriptome-wide association studies. Nat Genet. 2016;48(3):245–252.
- Verbanck M, Chen CY, Neale B, Do R. Detection of widespread horizontal pleiotropy in causal relationships inferred from Mendelian randomization between complex traits and diseases. Nat Genet. 2018;50(5):693–698.
- Hutson JM, et al. Regulation of testicular descent. Pediatr Surg Int. 2015;31(4):317–325.
- Phiel CJ, et al. Histone deacetylase is a direct target of valproic acid, a potent anticonvulsant, mood stabilizer, and teratogen. J Biol Chem. 2001;276(39):36734–36741.
- Tung EW, Winn LM. Valproic acid increases formation of reactive oxygen species and induces apoptosis in postimplantation embryos: a role for oxidative stress in valproic acid-induced neural tube defects. Mol Pharmacol. 2011;80(6):979–987.
- Palsamy P, Bidasee KR, Shinohara T. Valproic acid suppresses Nrf2/Keap1-dependent antioxidant protection through induction of endoplasmic reticulum stress and Keap1 promoter DNA demethylation in human lens epithelial cells. Exp Eye Res. 2014;121:26–34.
- Cao SS, Kaufman RJ. Endoplasmic reticulum stress and oxidative stress in cell fate decision and human disease. Antioxid Redox Signal. 2014;21(3):396–413.
- Wang L, et al. Glutathione peroxidase 7 utilizes hydrogen peroxide generated by Ero1α to promote oxidative protein folding. Antioxid Redox Signal. 2014;20(4):545–556.
- Matsuda M, et al. Involvement of phospholipase C-related inactive protein in the mouse reproductive system through the regulation of gonadotropin levels. Biol Reprod. 2009;81(4):681–689.
- Nediani C, et al. Stimulation of cardiac sarcoplasmic reticulum calcium pump by acylphosphatase. Relationship to phospholamban phosphorylation. J Biol Chem. 1996;271(32):19066–19073.
- Zheng J, Zhang Z, Ma L, Su L. Real-world pharmacovigilance study on neonatal congenital anomalies associated with maternal drug exposure using the FDA Adverse Event Reporting System. Ther Adv Drug Saf. 2025;16:20420986251383765.
- Zhu G, Tan C, Li Y. Integrative computational dissection of monobenzyl phthalate spermatotoxicity: high-affinity binding disrupts ACE2-CYP17A1 coregulation in non-obstructive azoospermia. Reprod Toxicol. 2025;138:109063.
- Irizarry M, Surick I, Michael A, Kramer LD. Response to Xing et al.: post-marketing safety concerns with lecanemab: a pharmacovigilance study based on the FDA Adverse Event Reporting System database. Alzheimers Res Ther. 2025;17(1):92.
- Janiczak S, et al. An evaluation of duplicate adverse event report characteristics in the Food and Drug Administration Adverse Event Reporting System. Drug Saf. 2025;48(10):1119–1126.
- Jothi D. GTEx pro enables accurate multi-tissue gene expression analysis using robust normalization and batch correction. Sci Rep. 2025;15(1):32684.
- Lu Y, et al. An integrative multi-context Mendelian randomization method for identifying risk genes across human tissues. Am J Hum Genet. 2024;111(8):1736–1749.