MiR-93-5p directly targets Toll-like receptor 4 (TLR4) in pediatric Mycoplasma pneumoniae pneumonia (MPP). Its downregulation may contribute to disease progression and associated digestive system injury. These findings suggest that miR-93-5p may serve as a potential diagnostic biomarker for MPP and MPP with digestive system injury.
Research Article
Evaluating the Role of miR-93-5p in Children Infected by Mycoplasma pneumoniae with Digestive System Injury
In This Article
Summary
Abstract
MiR-93-5p has been implicated in modulating acute lung injury, but its role and diagnostic value in pediatric Mycoplasma pneumoniae pneumonia (MPP) with digestive system injury remain unclear. This study evaluated the role of miR-93-5p as a potential diagnostic biomarker for MPP and associated digestive complications in children. Clinical samples were collected from pediatric patients with MPP and healthy controls. MiR-93-5p expression was quantified by reverse transcription quantitative PCR. Mycoplasma pneumoniae (MP)-infected A549 cells were used to establish a cellular MPP model to evaluate changes in cell viability and pro-inflammatory cytokines. Toll-like receptor 4 (TLR4) targeting by miR-93-5p was assessed using a luciferase reporter assay. Diagnostic performance was evaluated using receiver operating characteristic (ROC) curve analysis. MiR-93-5p levels were significantly decreased in patients with MPP compared with healthy controls (P < 0.001) and were further decreased in patients with MPP with digestive system injury compared with those with MPP alone. MP infection reduced cell viability and increased IL-6 and TNF-α levels, whereas miR-93-5p overexpression attenuated these effects. TLR4 expression was increased following MP infection and negatively regulated by miR-93-5p. Clinically, digestive system injury in patients with MPP was associated with lower miR-93-5p levels. ROC curve analyses showed favorable diagnostic performance for distinguishing patients with MPP from healthy controls and patients with MPP with digestive system injury from those with MPP alone. MiR-93-5p directly targets TLR4 in pediatric MPP, and its downregulation may contribute to disease progression and associated digestive system injury. These findings suggest that miR-93-5p may serve as a potential diagnostic biomarker for MPP and MPP with digestive system injury.
Introduction
Mycoplasma pneumoniae (MP) is a predominant pathogen responsible for pneumonia in children1, often leading to significant respiratory morbidity worldwide. Although MP primarily causes pulmonary infection, it can also cause extrapulmonary complications involving multiple organ systems2. During M. pneumoniae infection, the most frequently reported gastrointestinal symptoms include nausea, vomiting, diarrhea, and abdominal pain3. A range of gastrointestinal conditions and manifestations has also been identified as part of M. pneumoniae-related extrapulmonary diseases (MPEPDs)2. Pediatric patients with M. pneumoniae pneumonia (MPP) complicated by digestive system injury present clinical challenges that may exacerbate disease severity and complicate management4. Emerging evidence indicates an interaction between pulmonary infection and intestinal dysfunction, which may underlie this association5,6. Dysregulation of immune responses during MP infection may also be associated with digestive system injury7.
Despite advances in diagnostic modalities8, early and accurate identification of MPP remains challenging because of overlapping clinical manifestations with other respiratory infections and variable extrapulmonary involvement9. The lung and gut are key components of the common mucosal immune system, and these organs can influence each other’s function, as reflected by intestinal disturbances during lung disease and reciprocal effects, a phenomenon known as lung-gut crosstalk10. Moreover, pediatric nursing care primarily focuses on respiratory symptom management11, whereas gastrointestinal manifestations may be under-recognized or attributed to treatment side effects. This gap underscores the need for comprehensive assessment integrating both pulmonary and gastrointestinal evaluation to optimize supportive nursing interventions12. Recent molecular studies have highlighted regulators of inflammatory signaling pathways involved in both lung pathology and intestinal inflammation in MPP12,13.
MiR-93-5p has been implicated in the pathogenesis of acute lung injury, where its downregulation correlates with impaired pulmonary function and exacerbated inflammatory responses14,15. Based on these findings, miR-93-5p was hypothesized to be similarly downregulated in the serum of children with MPP. Bioinformatic analysis using the TargetScan database identified Toll-like receptor 4 (TLR4) as a potential direct target of miR-93-5p. TLR4 has been reported to play an important role in modulating the lung-gut axis16,17 and was therefore considered potentially associated with gastrointestinal complications in MPP. Accordingly, this study investigated the involvement of miR-93-5p in pediatric patients with MPP complicated by digestive system injury.
Protocol
This study was reviewed and approved by the Ethics Committee of the Affiliated Hospital of Yangzhou University (Approval No. 2023-YKL01-(16); January 17, 2023). Peripheral venous blood samples were collected from each participant for relevant laboratory assays. Before participation, informed consent was obtained from the legal guardians of all participants. The reagents, equipment, and tools used in this protocol are listed in the Table of Materials.
1. Clinical sample collection
A total of 108 children aged 2–14 years were enrolled at the Affiliated Hospital of Yangzhou University between February 2023 and December 2024. All 108 children were diagnosed with MPP, confirmed by chest imaging and polymerase chain reaction (PCR) testing for MP DNA in nasopharyngeal samples. MP DNA in nasopharyngeal swabs was detected by quantitative real-time PCR targeting the MP-specific P1 adhesin gene.
The patients were classified according to disease status into two groups: MPP without DSI (n = 60) and MPP with DSI (n = 48). DSI was defined by the presence of at least one gastrointestinal symptom, including diarrhea (≥3 loose or watery stools per day lasting for >24 h), nausea, vomiting, or persistent abdominal pain with or without rebound tenderness, accompanied by at least one abnormal laboratory parameter and/or confirmatory abdominal imaging finding. Abnormal laboratory parameters included elevated serum transaminases, amylase, or lipase and/or increased intestinal permeability markers, such as D-lactate and endotoxin. Confirmatory abdominal imaging findings included intestinal wall thickening, enlarged mesenteric lymph nodes, or peritoneal effusion detected by ultrasonography or computed tomography. Additionally, 60 healthy children undergoing routine examinations served as controls.
- Inclusion criteria
Patients exhibiting gastrointestinal symptoms together with laboratory or imaging abnormalities were classified into the DSI group. - Exclusion criteria
Exclusion criteria included viral or bacterial pneumonia, tuberculosis, history of drug allergy to study medications, immune disorders, malnutrition, kidney dysfunction, gastrointestinal malformations, and prior antibiotic treatment before admission.
2. Cell culture and MPP model
Mycoplasma pneumoniae standard strain ATCC 15531 was cultured in PPLO broth. Human alveolar epithelial A549 cells were cultured in RPMI-1640 medium containing 10% fetal bovine serum under humidified conditions at 37 °C with 5% CO₂.
To establish an in vitro model of MPP, A549 cells were infected with M. pneumoniae suspensions at a multiplicity of infection (MOI) of 1:10018. Following infection, unbound bacteria were removed by replacing the culture medium. Infection efficiency was confirmed by qPCR detection of MP DNA in culture supernatants after infection.
3. Plasmid construction and transfection
MiR-93-5p mimics, TLR4 overexpression (oe-TLR4) plasmids, and their corresponding negative controls were synthesized commercially. MP-infected A549 cells were transfected using a lipid-based transfection reagent. Transfection efficiency was assessed 48 h after transfection by reverse transcription quantitative PCR (RT-qPCR).
4. RT-qPCR analysis
Total RNA was extracted from A549 cells harvested at the end of the experiments. Cells were lysed and homogenized using phosphate-buffered saline (PBS). Total RNA was purified using a phenol-based RNA extraction reagent. A reverse transcription kit was used for reverse transcription of miR-93-5p, whereas complementary DNA for mRNA analysis was synthesized using a commercially available reverse transcription reagent. RT-qPCR analysis was conducted using SYBR Green chemistry.
5. MTT assay
Transfected A549 cells from each experimental group were harvested and seeded into 96-well plates at a density of 2 × 10³ cells per well. Subsequently, 20 µL of methylthiazolyldiphenyl-tetrazolium bromide (MTT) reagent was added to each well. Following incubation for an additional 2 h at 37 °C, the supernatants were carefully removed. The resulting formazan crystals formed by metabolically active cells were solubilized according to the assay instructions. Cell viability was indirectly quantified by measuring optical density (OD) at 490 nm using a microplate reader.
6. Enzyme-linked immunosorbent assay
Commercial enzyme-linked immunosorbent assay (ELISA) kits were used to measure the levels of interleukin-6 (IL-6) and tumor necrosis factor-α (TNF-α). Assays were performed according to the manufacturer’s instructions. Measurements were performed in triplicate across two independent experimental replicates to ensure accuracy and reproducibility.
7. Dual-luciferase reporter assay
MiR-93-5p binding sites within the 3′ untranslated region (UTR) of TLR4 were predicted using the TargetScan database. Fragments containing the wild-type (WT) or mutated (MUT) sequences were cloned into a luciferase reporter vector. A549 cells were co-transfected with 500 ng of either the WT or MUT construct together with miR-93-5p mimics or controls using a lipid-based transfection reagent. After 48 h, luciferase activity was measured using a dual-luciferase reporter assay. Firefly luciferase activity was normalized to Renilla luciferase activity to account for transfection efficiency.
8. Western blotting assay
For Western blotting, cell lysates were mixed with loading buffer and centrifuged at 10,000 × g for 3 min. Supernatants were subjected to sodium dodecyl sulfate-polyacrylamide gel electrophoresis, and proteins were transferred onto polyvinylidene fluoride membranes. Membranes were blocked with 5% bovine serum albumin (BSA) for 1 h at room temperature and then incubated overnight at 4 °C with primary antibodies against glyceraldehyde-3-phosphate dehydrogenase (GAPDH) and inhibitor kappa B alpha (IκBα) at a 1:1000 dilution in Tris-buffered saline containing Tween 20 and 5% BSA. After three washes, the membranes were incubated with HRP-conjugated goat anti-rabbit IgG (1:500) for 1 h at room temperature. Following additional washes, protein bands were visualized using an enhanced chemiluminescence substrate and imaged with a chemiluminescence imaging system. Band intensities of the target proteins and GAPDH were quantified from three independent experiments using image-analysis software.
9. Statistical analysis
Statistical analyses were performed using statistical analysis software. Normality of measurement data was assessed using the Shapiro-Wilk test. Normally distributed data are presented as the mean ± standard deviation and were compared using independent-samples t-tests for two groups or one-way analysis of variance (ANOVA) for multiple groups. When ANOVA indicated a significant overall difference, Tukey’s post hoc test was used for pairwise comparisons. Non-normally distributed data were analyzed using the Mann-Whitney U test. Categorical variables were expressed as counts and percentages and compared using chi-square tests. Receiver operating characteristic (ROC) curve analysis was used to evaluate the diagnostic potential of miR-93-5p for predicting MPP or MPP with DSI. To identify predictive factors associated with MPP with DSI, multivariable logistic regression was performed. Variables entered into the model included age, gender, duration of fever, antibiotic-use duration, and miR-93-5p expression dichotomized at the median. A two-sided P value <0.05 was considered statistically significant.
Results
MiR-93-5p is decreased in pediatric MPP
The diagnostic performance of miR-93-5p was evaluated to explore its potential as a biomarker in pediatric MPP. As shown in Figure 1A, miR-93-5p expression was significantly decreased in pediatric patients with MPP compared with healthy controls. Demographic and hematological characteristics of the two groups are summarized in Table 1. No statistically significant differences were observed in age or sex distribution between the groups (P > 0.05). However, peripheral white blood cell count (WBC), neutrophil percentage (Net%), and C-reactive protein (CRP) levels were significantly elevated in the MPP group compared with healthy controls (P < 0.001).
Receiver operating characteristic (ROC) curve analysis was performed to further assess the diagnostic performance of miR-93-5p in distinguishing patients with MPP from healthy children (Figure 1B). The area under the curve (AUC) was 0.9009 [95% confidence interval (CI): 0.8537–0.9482], with a sensitivity of 80.56% and specificity of 88.33%. These findings indicate that decreased serum miR-93-5p levels were associated with pediatric MPP.
Effect of miR-93-5p on MPP cell models
A series of in vitro experiments was conducted to evaluate the effect of miR-93-5p in the MPP cell model. Compared with control cells, miR-93-5p expression was downregulated in the MPP cell model (Figure 2A). MP infection was also associated with decreased viability of A549 cells (Figure 2B). In addition, the levels of the pro-inflammatory cytokines IL-6 and TNF-α were elevated in the MPP model compared with controls (Figure 2C).
To further evaluate the functional effect of miR-93-5p, a miR-93-5p overexpression model was established in MP-infected A549 cells (Figure 2D). MiR-93-5p overexpression significantly increased cell viability compared with the MPP model without miR-93-5p overexpression (Figure 2E). Consistent with these findings, increased miR-93-5p expression was accompanied by decreased production of IL-6 and TNF-α (Figure 2F). These results indicate that reduced miR-93-5p expression was associated with decreased cell viability and increased inflammatory responses during MP infection, whereas miR-93-5p overexpression attenuated these changes.
MiR-93-5p targets TLR4
To elucidate the regulatory relationship between miR-93-5p and TLR4, bioinformatic analysis identified a predicted miR-93-5p binding site within the 3′ untranslated region (UTR) of TLR4 mRNA (Figure 3A). TLR4 expression was increased in the MP cell model compared with controls (Figure 3B). The predicted interaction was subsequently evaluated using a luciferase reporter assay. Co-transfection with miR-93-5p mimics decreased luciferase activity of the wild-type construct, indicating specific binding to the predicted site (Figure 3C).
Overexpression of miR-93-5p in MP-infected cells decreased TLR4 expression compared with infected controls without mimic treatment (Figure 3D). To further investigate downstream effects associated with TLR4 modulation, A549 cell models with TLR4 overexpression were established (Figure 3E). Western blot analysis showed increased IκBα levels following TLR4 overexpression (Figure 3F).
TLR4 overexpression markedly decreased cell viability after MP infection relative to control cells, whereas simultaneous overexpression of miR-93-5p reversed this reduction (Figure 3G). Measurement of inflammatory cytokines further showed that TLR4 overexpression increased pro-inflammatory mediator levels, whereas miR-93-5p overexpression attenuated these changes even in the presence of TLR4 overexpression (Figure 3H). These findings indicate that miR-93-5p negatively regulates TLR4 expression and attenuates cellular changes associated with MP infection.
Diagnostic value of miR-93-5p in MPP and MPP with DSI
Previous reports have described the involvement of TLR4 in pulmonary and colonic tissues16. The potential association between miR-93-5p and digestive system injury in MPP was therefore evaluated clinically. As shown in Figure 4A, miR-93-5p expression was decreased in the MPP+DSI group compared with the MPP group.
Demographic and hematological characteristics are summarized in Table 2. No significant differences in age or sex were observed between the groups. However, the duration of fever and antibiotic use were significantly longer in patients with concurrent DSI (P < 0.05).
The diagnostic value of miR-93-5p for distinguishing MPP cases with DSI from those without DSI was evaluated using ROC curve analysis. The AUC was 0.7866 (95% CI: 0.6889–0.8843) (Figure 4B), with a sensitivity of 85.71% and specificity of 57.45%.
Multivariable logistic regression analysis identified low miR-93-5p expression, prolonged fever duration, and extended antibiotic use as factors associated with digestive system injury during MP infection (Table 3; P < 0.05).
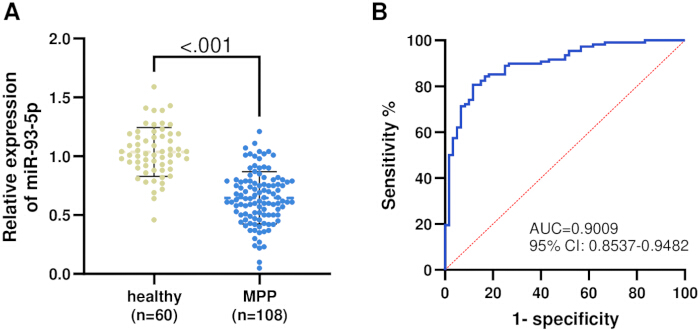
Figure 1: Expression and diagnostic value of miR-93-5p in healthy controls (n = 60) and patients with MPP (n = 108). (A) MiR-93-5p expression was decreased in patients with MPP. (B) ROC curve analysis of miR-93-5p. Please click here to view a larger version of this figure.
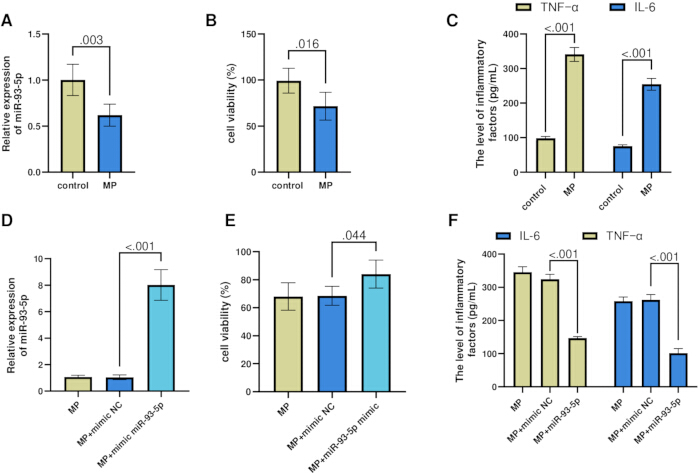
Figure 2: Functional effects of miR-93-5p in the MP-infected cell model. (A) MiR-93-5p expression was decreased in the MP-infected model. (B) Cell viability was decreased in the MP-infected model. (C) TNF-α and IL-6 levels were increased in the MP-infected model. (D) Transfection efficiency of the miR-93-5p mimic. (E) Cell viability was increased following miR-93-5p overexpression. (F) TNF-α and IL-6 levels were decreased following miR-93-5p overexpression. n = 3. P < 0.05, P < 0.01, P < 0.001. Please click here to view a larger version of this figure.
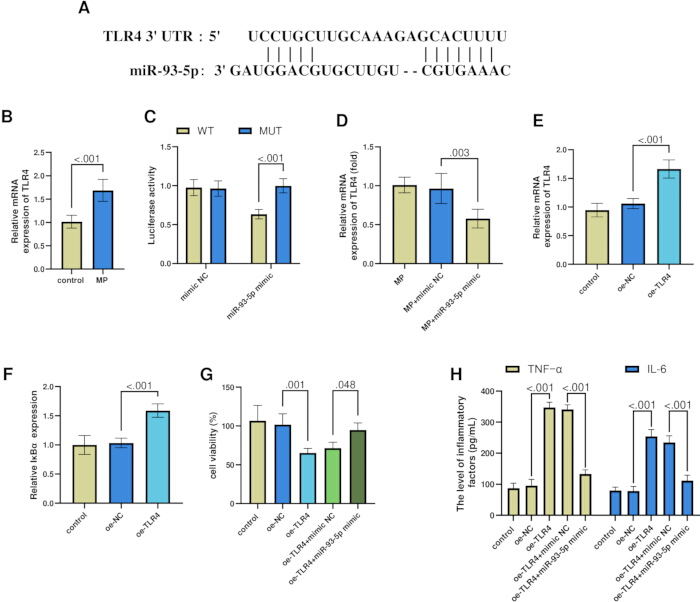
Figure 3: MiR-93-5p directly targets TLR4. (A) Predicted binding site between miR-93-5p and TLR4. (B) TLR4 expression in the MP-infected model. (C) Dual-luciferase reporter assay. (D) Negative regulation of TLR4 by miR-93-5p. (E) Efficiency of TLR4 overexpression. (F) Western blot analysis of IκBα. (G) Cell viability. (H) TNF-α and IL-6 levels. n = 3. P < 0.05, P < 0.01, P < 0.001. Please click here to view a larger version of this figure.
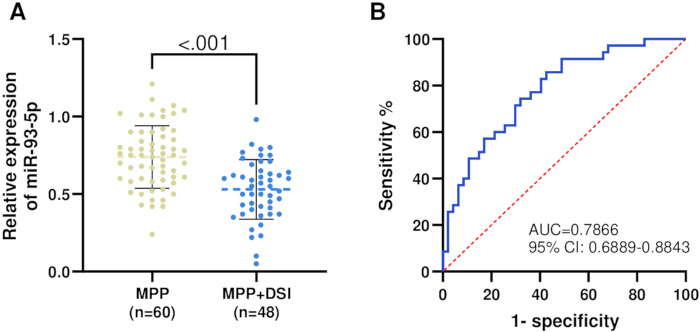
Figure 4: Expression and diagnostic value of miR-93-5p in patients with MPP (n = 60) and patients with MPP with DSI (n = 48). (A) MiR-93-5p expression in the MPP+DSI group. (B) ROC curve analysis of miR-93-5p. Please click here to view a larger version of this figure.
| Variable | Healthy (n = 60) | MPP (n = 108) | P |
| age (years) | 6.81± 3.14 | 7.12 ± 3.55 | 0.559 |
| gender (male/female) | 28/32 | 49/59 | 0.872 |
| WBC ( × 109/L) | 7.27 ± 0.89 | 9.86 ± 1.36 | <0.001 |
| CRP (mg/L) | 2.35 ± 0.17 | 11.53 ± 2.01 | <0.001 |
| Net % | 42.55 ± 5.62 | 56.51 ± 15.40 | <0.001 |
Table 1: Comparison of demographic characteristics and routine blood parameters between healthy controls and patients with MPP. This table summarizes the demographic characteristics and routine hematological parameters of healthy controls and patients with MPP, including age, sex, WBC, neutrophil percentage, eosinophil percentage, basophil percentage, and CRP. Between-group comparisons and corresponding P values are presented.
| Variable | MPP (n = 60) | MPP+DSI (n = 48) | P |
| age (years) | 6.88 ± 3.87 | 7.42 ± 3.11 | 0.441 |
| gender (male/female) | 31/29 | 28/20 | 0.494 |
| WBC ( × 109/L) | 8.9 ± 0.89 | 11.05 ± 0.76 | <0.001 |
| CRP (mg/L) | 10.94 ± 1.62 | 12.27 ± 2.22 | <0.001 |
| Net % | 55.87 ± 14.75 | 57.32 ± 16.29 | 0.629 |
| Duration of fever (day) | 4.60 ± 1.83 | 7.26 ± 1.04 | <0.001 |
| Antibiotic use time (day) | 4.65 ± 1.147 | 6.29 ± 0.771 | <0.001 |
Table 2: Comparison of demographic characteristics and routine blood parameters between patients with MPP and patients with MPP+DSI. This table compares demographic characteristics, routine hematological parameters, and relevant clinical characteristics between patients with MPP alone and those with MPP complicated by DSI. Between-group comparisons and corresponding P values are presented.
| Variable | OR | 95% CI | P value | |
| lower | upper | |||
| miR-93-5p (Low vs High) | 6.702 | 1.487 | 30.211 | 0.013 |
| age | 1.126 | 0.286 | 4.437 | 0.866 |
| gender | 1.071 | 0.27 | 4.248 | 0.923 |
| Duration of fever | 73.416 | 15.018 | 358.895 | <0.001 |
| Antibiotic use time | 7.921 | 1.877 | 33.421 | 0.005 |
Table 3: Logistic regression analysis of children with MP infection complicated by digestive system injury. This table presents the results of logistic regression analysis evaluating factors associated with digestive system injury among children with MP infection. The analysis includes the OR, 95% CI, and P value for each variable.
Abbreviations: Baso%, basophil percentage; CI, confidence interval; CRP, C-reactive protein; DSI, digestive system injury; Eos%, eosinophil percentage; IκBα, inhibitor kappa B alpha; IL-6, interleukin-6; MP, Mycoplasma pneumoniae; MPP, Mycoplasma pneumoniae pneumonia; NC, negative control; Net%, neutrophil percentage; oe-TLR4, TLR4 overexpression; OR, odds ratio; ROC, receiver operating characteristic; TLR4, Toll-like receptor 4; TNF-α, tumor necrosis factor-α; WBC, white blood cell count.
DATA AVAILABILITY:
The raw numerical data underlying the figures and tables are provided as Supplementary Table 1.
Supplementary Table 1: Raw numerical data for the figures and tables. Please click here to download this File.
Discussion
Although primarily considered a pulmonary pathogen, MP infection can cause diverse extrapulmonary complications affecting multiple organ systems beyond the lungs19,20. Emerging evidence suggests an interaction along the lung-gut axis, in which inflammatory mediators released during pulmonary pathology disrupt intestinal flora balance21 and intestinal function22. This bidirectional interplay highlights the importance of comprehensive patient assessment addressing both respiratory symptoms and gastrointestinal health. Circulating serum biomarkers have therefore attracted increasing attention as minimally invasive tools with potential diagnostic or prognostic value23,24. MiRNAs have emerged as promising candidates because of their stability and their roles in regulating inflammation-related signaling pathways involved in MP pathogenesis25,26,27. This study systematically explored the role and clinical importance of miR-93-5p in pediatric MPP, particularly when complicated by digestive system injury. MiR-93-5p levels were decreased in children with MPP compared with healthy controls and were further reduced in those with digestive system injury. These findings indicate a potential role for miR-93-5p dysregulation in pulmonary pathology and as a possible biomarker for extrapulmonary manifestations.
MiRNAs have demonstrated diagnostic value in severe pneumonia, with promising sensitivity, specificity, and overall diagnostic accuracy28,29. Clinically, children with MPP complicated by DSI had prolonged fever duration and extended antibiotic treatment compared with those without digestive complications. Lower miR-93-5p levels were independently associated with digestive system involvement, alongside these clinical parameters, in multivariable logistic regression analysis. Furthermore, ROC curve analysis showed a favorable diagnostic performance of serum miR-93-5p for distinguishing patients with MPP with DSI from those without DSI. Thus, measurement of miR-93-5p may provide additional value for early identification and risk stratification in pediatric MP infection.
Regarding the diagnostic performance of circulating miR-93-5p relative to routine clinical inflammatory markers, the findings suggest that miR-93-5p may provide complementary value rather than replace conventional indicators. CRP and procalcitonin (PCT) remain commonly used biomarkers in clinical practice for assessing infection severity and guiding antibiotic therapy, with meta-analyses demonstrating that PCT exhibits slightly superior diagnostic accuracy compared with CRP in bacterial pneumonia30. However, these acute-phase reactants are largely nonspecific because they respond to diverse inflammatory stimuli and cannot reliably distinguish MP infection from other respiratory pathogens or specifically reflect the risk of extrapulmonary complications. In contrast, miR-93-5p, as a regulatory molecule associated with TLR4/nuclear factor kappa B (NF-κB) signaling, may provide distinct pathophysiological information that complements conventional markers. The correlation between miR-93-5p and CRP has been reported to be relatively weak (Pearson r = 0.2698), suggesting that miR-93-5p may reflect a different aspect of the inflammatory response than the systemic acute-phase response.
Emerging evidence from animal models has demonstrated that Mycoplasma pneumoniae infection can induce not only respiratory pathology but also digestive system injury through the lung-gut axis mediated by intestinal flora31. In mice infected with MP, pathological injury in both the lungs and colon has been observed, together with alterations in gut microbiota composition, including decreased abundance of beneficial bacteria such as Corynebacterium glutamicum and increased abundance of potential pathogens such as Lachnospiraceae NK4A136 group and Escherichia-Shigella, accompanied by elevated lipopolysaccharide (LPS) levels in colonic contents and blood32. Baicalin has also been reported to ameliorate pulmonary inflammation and regulate intestinal flora in MPP mice through the TLR4/NF-κB pathway, supporting the involvement of this signaling cascade in lung-gut crosstalk33. These findings are consistent with a possible involvement of NF-κB signaling in the miR-93-5p/TLR4 axis examined in the present study.
At the mechanistic level, TLR4, a key mediator of innate immunity associated with pro-inflammatory responses34,35,36,37, was upregulated during MP infection. Elevated TLR4 expression was accompanied by increased levels of the inflammatory cytokines IL-6 and TNF-α and reduced epithelial cell viability. Overexpression of miR-93-5p suppressed TLR4 expression, attenuated inflammatory cytokine release, and improved cell survival under infectious conditions. Therefore, downregulation of miR-93-5p in patients with MPP, particularly those with digestive system injury, may be associated with increased TLR4-mediated inflammatory signaling and broader systemic inflammatory responses. The present findings do not establish activation of the downstream NF-κB pathway, because phosphorylated IκBα and p65 were not assessed.
Several limitations of this study should be acknowledged. First, this was a single-center study with a relatively small sample size, particularly for the DSI subgroup, which may limit statistical power and generalizability. External validation in larger, multicenter cohorts is required to confirm these findings and establish reliable clinical cutoff values. Second, although IκBα was detected by Western blotting, comprehensive validation of other downstream components of the TLR4/NF-κB pathway, including MyD88, p-IκBα, and p65, was not performed. Protein-level validation of these signaling components would strengthen the mechanistic interpretation. Third, the observational design precludes causal inference; loss- and gain-of-function experiments, including miRNA mimics or inhibitors in vitro or in vivo, are needed to determine whether miR-93-5p directly contributes to MPP-associated digestive injury. Fourth, the in vitro experiments were performed in A549 lung epithelial cells. Although this model is suitable for evaluating the anti-inflammatory effects of miR-93-5p in a pulmonary context, it cannot directly model gastrointestinal pathology. The proposed association between pulmonary miR-93-5p/TLR4 signaling and digestive manifestations, potentially mediated through the lung-gut axis, requires direct validation in intestinal epithelial cell models, such as Caco-2 cells, and in vivo animal models of MP infection. Finally, technical challenges associated with miRNA detection, including RNA stability and normalization strategies, remain barriers to routine clinical implementation. Despite these limitations, the findings provide a foundation for future mechanistic studies and large-scale validation efforts.
In conclusion, upregulation of miR-93-5p attenuated MP-induced inflammation in lung epithelial cells through suppression of TLR4. Clinically, decreased circulating miR-93-5p levels were associated with digestive system injury in children with MPP, suggesting potential utility as an adjunctive biomarker for identifying patients at risk for gastrointestinal complications.
Disclosures
The authors declare no conflicts of interest.
Materials
| Name | Company | Catalog Number | Comments |
|---|---|---|---|
| A549 human alveolar epithelial cells | ATCC, USA | Cat# CCL-185; RRID: CVCL_0023 | Human alveolar epithelial cell line used for the in vitro MPP model |
| Anti-GAPDH antibody | Hangzhou XianZhi Biological Technology, China | Cat# AB-P-R001; RRID: AB_3096355 | Primary antibody used for GAPDH detection as a loading control in Western blotting |
| Anti-IκBα antibody | Beyotime, China | Cat# AG2741; RRID: AB_3731391 | Primary antibody used for IκBα detection by Western blotting |
| Bovine serum albumin (BSA) | Solarbio, China | Cat# A8012 | Blocking reagent used during Western blotting |
| Centrifuge | Thermo Fisher Scientific, USA | Multifuge X4 Pro; Cat# 75016066; RRID: SCR_020726 | Centrifuge used during cell culture and sample preparation |
| Chemiluminescence imaging system | Tanon, China | 5200Multi; RRID: SCR_027114 | Imaging system used to visualize chemiluminescent Western blot signals |
| Dual-Luciferase Reporter Assay System | Promega, USA | Cat# E1910 | Used to measure firefly and Renilla luciferase activities |
| Fetal bovine serum (FBS) | Gibco, USA | Cat# A5256701 | Serum supplement for cell culture medium |
| Goat anti-rabbit IgG, HRP-conjugated | Cell Signaling Technology, USA | Cat# 7074; RRID: AB_2099233 | HRP-conjugated secondary antibody used for Western blotting |
| GraphPad Prism | GraphPad Software | Version 10.1.2; URL: https://www.graphpad.com | Software used for statistical analysis and graphical presentation |
| Interleukin-6 (IL-6) ELISA Kit | Elabscience, China | Cat# E-EL-H6156; RRID: AB_3665145 | ELISA kit used to quantify IL-6 |
| Lipofectamine 3000 Transfection Reagent | Thermo Fisher Scientific | Cat# L3000015 | Lipid-based reagent used for transfection of A549 cells |
| Microplate reader | Tecan, Switzerland | Infinite M Plex; RRID: SCR_026522 | Microplate reader used to measure optical density at 490 nm |
| miR-93-5p mimics | Ribobio, China | Cat# miR10000093-1-5 | Synthetic miR-93-5p mimic used for miR-93-5p overexpression |
| miR-93-5p negative control | Ribobio, China | Cat# miR1N0000001-1-5 | Negative control for miR-93-5p mimic transfection |
| MTT Cell Proliferation and Cytotoxicity Assay Kit | Beyotime, China | Cat# C0009S | Used to assess cell viability |
| Mycoplasma pneumoniae standard strain ATCC 15531 | ATCC, USA | Cat# 15531 | Standard M. pneumoniae strain used to establish the infection model |
| pGL3-Basic Luciferase Reporter Vector | Promega, USA | Cat# E1751 | Reporter vector used for the dual-luciferase reporter assay |
| Phosphate-buffered saline (PBS) | Solarbio, China | Cat# IP9212 | Buffer used for cell washing and sample preparation |
| Pierce ECL Western substrate | Thermo Scientific, USA | Cat# 32209 | Chemiluminescent substrate used for Western blot detection |
| Pleuropneumonia-like organism (PPLO) medium | BD, USA | Cat# 255420 | Culture medium used for M. pneumoniae |
| Polyvinylidene fluoride (PVDF) membrane | Bio-Rad | Cat# 1620177 | Membrane used for protein transfer during Western blotting |
| PrimeScript RT Master Mix (Perfect Real Time) | Takara Bio Inc., Japan | Cat# RR036A | Reverse transcription master mix used for cDNA synthesis |
| PrimeScript RT Reagent Kit | Takara Bio Inc., Japan | Cat# RR037A | Reagent kit used for reverse transcription |
| Real-time PCR system | Applied Biosystems, USA | QuantStudio 3 Real-Time PCR System; RRID: SCR_020238 | Real-time PCR instrument used for qPCR analysis |
| RPMI-1640 medium | Gibco, USA | Cat# 11875135 | Cell culture medium used for A549 cells |
| SPSS | IBM | Version 27.0; RRID: SCR_016479 | Software used for statistical analysis |
| TLR4 overexpression negative control | Ribobio, China | NA | Negative control for TLR4 overexpression experiments |
| TLR4 overexpression plasmid (oe-TLR4) | Ribobio, China | NA | Plasmid used for TLR4 overexpression |
| TRIzol Reagent | Invitrogen, Thermo Fisher Scientific | Cat# 15596026 | Reagent used for total RNA extraction |
| Tumor Necrosis Factor-α (TNF-α) ELISA Kit | Elabscience, China | Cat# E-EL-H0109; RRID: AB_3665144 | ELISA kit used to quantify TNF-α |
| Universal SYBR qPCR Master Mix | Takara Bio Inc., Japan | Cat# BL697A | Master mix used for quantitative PCR |
| Western blot gel electrophoresis system | Bio-Rad, USA | Mini-PROTEAN Tetra Cell; Cat# 1658004 | Electrophoresis system used for protein separation |
References
- Yan C et al. Current status of Mycoplasma pneumoniae. infection in China. World Journal of Pediatrics. 2024;20(1):1-4.
- Poddighe D. Extra-pulmonary diseases related to Mycoplasma pneumoniae. in children: recent insights into the pathogenesis. Current Opinion in Rheumatology. 2018;30(4). doi:10.1097/BOR.0000000000000494.
- Schildgen O et al. Clinical manifestations in infants and children with Mycoplasma pneumoniae. infection. PLOS ONE. 2018;13(4). doi:10.1371/journal.pone.0195288.
- Li X et al. Intestinal necrosis due to nonocclusive mesenteric ischemia in a child with Mycoplasma pneumoniae. pneumonia: a case report. BMC Infectious Diseases. 2025;25(1):1049.
- Ran B, Yang Z, Li M. METTL3-mediated miR-4534 maturation promotes IVDD progression by targeting the Sirt6-mediated Nrf2/HO-1 pathway. 2024;21(6):2795-2813.
- Du B et al. The lung-gut crosstalk in respiratory and inflammatory bowel disease. Frontiers in Cellular and Infection Microbiology. 2023;13. doi:10.3389/fcimb.2023.1218565.
- Jiang Y et al. Intestinal bacteria flora changes in patients with Mycoplasma pneumoniae pneumonia. with or without wheezing. Scientific Reports. 2022;12(1):5683.
- Lin L-J et al. The diagnostic value of serological studies in pediatric patients with acute Mycoplasma pneumoniae. infection. Journal of Microbiology, Immunology and Infection. 2020;53(2):351-356.
- Cui J et al. Integrated microfluidic cartridge for rapid and colorimetric detection of Mycoplasma pneumoniae. Microchimica Acta. 2025;192(9):559.
- Wang X, Starodubtseva MN, Kapron CM, et al. Cadmium, von Willebrand factor and vascular aging. NPJ Aging. 2023;9(1):11.
- Chen J. Efficacy of the PDCA cyclic care model in improving lung function and speed of recovery in children with Mycoplasma pneumonia. American Journal of Translational Research. 2025;17(3):1792-1802.
- Li Y et al. Clinical significance of serum miR-98-5p in children with Mycoplasma pneumoniae. infection complicated with digestive system damage. Immunobiology. 2025;230(4):153101.
- Zhang Y, Wu ZM. LINC02605 involved in paediatric pneumonia complicated with diarrhoea via miR-539-5p/CXCL1 axis. European Journal of Clinical Investigation. 2024;54(9). doi:10.1111/eci.14234.
- Gao H et al. Knockdown of lncRNA MEG3 protects against sepsis-induced acute lung injury in mice through miR-93-5p-dependent inhibition of NF-κB signaling pathway. Pathology - Research and Practice. 2022;239:154142.
- Gao H et al. MicroRNA-93 contributes to the suppression of lung inflammatory responses in LPS-induced acute lung injury in mice via the TLR4/MyD88/NF-κB signaling pathway. Int J Mol Med. 2020;46(2):561-570.
- Wedgwood S et al. Intestinal dysbiosis and the developing lung: the role of Toll-like receptor 4 in the gut-lung axis. Frontiers in Immunology. 2020;11. doi:10.3389/fimmu.2020.00357.
- Zou N et al. Transcutaneous auricular vagus nerve stimulation as a novel therapy connecting the central and peripheral systems: a review. Int J Surg. 2024;110(8):4993-5006.
- Chen Y et al. Combination of azithromycin and methylprednisolone alleviates Mycoplasma pneumoniae.-induced pneumonia by regulating miR-499a-5p/STAT3 axis. Exp Ther Med. 2022;24(3):578.
- Poddighe D. Mycoplasma pneumoniae.-related extra-pulmonary diseases and antimicrobial therapy. Journal of Microbiology, Immunology and Infection. 2020;53(1):188-189.
- Meyer Sauteur PM, Ramien ML, Theiler M. Mycoplasma pneumoniae.: extrapulmonary manifestations in children with focus on mucocutaneous disease. The Pediatric Infectious Disease Journal. 9900. doi:10.1097/INF.0000000000004946.
- Liu C et al. Mast cells participate in regulation of lung-gut axis during Staphylococcus aureus pneumonia. Cell Proliferation. 2019;52(2).
- Guo J et al. People are an organic unity: gut-lung axis and pneumonia. Heliyon. 2024;10(6).
- Fan F et al. Clinical characteristics and serum inflammatory markers of community-acquired mycoplasma pneumonia in children. The Clinical Respiratory Journal. 2023;17(7):607-617.
- Ding L, Jiang Y. Biomarkers associated with the diagnosis and prognosis of Mycoplasma pneumoniae. pneumonia in children: a review. Frontiers in Cellular and Infection Microbiology. 2025;15. doi:10.3389/fcimb.2025.1552144.
- Peng W et al. Comparative analysis of the efficacy and safety of different methods for injecting polidocanol in the treatment of venous malformations. Phlebology. 2024;39(9):629-635.
- Wang J et al. Peripheral blood microR-146a and microR-29c expression in children with Mycoplasma pneumoniae. pneumonia and its clinical value. Italian Journal of Pediatrics. 2023;49(1):119.
- Chu C et al. High expression of miR-222-3p in children with Mycoplasma pneumoniae. pneumonia. Italian Journal of Pediatrics. 2019;45(1):163.
- Powell BH, Witwer KW, Meffert MK. Cellular miRNAs and viruses: trends in miRNA sequestering and target de-repression. J Virol. 2025;99(7).
- Gan T, Yu J, He J. miRNA, lncRNA and circRNA: targeted molecules with therapeutic promises in Mycoplasma pneumoniae. infection. Arch Microbiol. 2023;205(8):293.
- Im PK et al. Hyperuricemia, gout and the associated comorbidities in China: findings from a prospective study of 0.5 million adults. The Lancet Regional Health – Western Pacific. 2025;58. doi:10.1016/j.lanwpc.2025.101572.
- Hu J et al. Insight into the pathogenic mechanism of Mycoplasma pneumoniae. Curr Microbiol. 2022;80(1):14.
- Li B et al. Cecropin AD ameliorates pneumonia and intestinal injury in mice with Mycoplasma pneumoniae. by mediating gut microbiota. BMC Vet Res. 2025;21(1):39.
- Song D et al. The mechanism of baicalin in improving pulmonary inflammatory response and injury and regulating intestinal flora in Mycoplasma pneumoniae pneumoni.a mice. Cellular Signalling. 2025;126:111530.
- Coutinho-Wolino KS et al. Bioactive compounds modulating Toll-like 4 receptor (TLR4)-mediated inflammation: pathways involved and future perspectives. Nutrition Research. 2022;107:96-116.
- Thorburn AN et al. TLR2, TLR4 and MyD88 mediate allergic airway disease (AAD) and Streptococcus pneumoniae-induced suppression of AAD. PLOS ONE. 2016;11(6).
- Tang J et al. Effect of gut microbiota on LPS-induced acute lung injury by regulating the TLR4/NF-kB signaling pathway. International Immunopharmacology. 2021;91:107272.
- Jia H et al. Pulmonary epithelial TLR4 activation leads to lung injury in neonatal necrotizing enterocolitis. The Journal of Immunology. 2016;197(3):859-871.