This systematic review and meta-analysis evaluate the diagnostic performance of radiomics-based models for preoperative prediction of microvascular invasion in hepatocellular carcinoma.
Research Article
Intratumoral and Peritumoral Features for Predicting Microvascular Invasion in Hepatocellular Carcinoma: Systematic Review and Meta-Analysis
In This Article
Summary
Abstract
This systematic review and meta-analysis evaluated the diagnostic performance of radiomics-based models for predicting microvascular invasion (MVI) in hepatocellular carcinoma (HCC). MVI is a key determinant of prognosis in HCC, strongly associated with early recurrence and reduced survival following curative treatment. Accurate preoperative prediction of MVI remains challenging using conventional clinical and imaging features. Radiomics has emerged as a promising approach by enabling quantitative analysis of tumor heterogeneity from medical imaging. This study aimed to systematically evaluate the diagnostic performance of radiomics-based models for predicting MVI in HCC. A systematic review and meta-analysis were conducted, including 26 studies evaluating CT- and MRI-based radiomics models. Data on diagnostic performance were extracted, and pooled analyses were performed using random-effects models, with subgroup analyses by imaging modality and model type. Overall, radiomics models demonstrated good diagnostic performance, with a pooled AUC of 0.85 (95% CI 0.82–0.88). Clinicoradiomics models achieved higher and more consistent performance than radiomics-only models (MRI: 0.87 vs 0.85; CT: 0.87 vs 0.81). Among 3D-based models, the pooled AUC was 0.85 (95% CI 0.82–0.88). In conclusion, radiomics-based models show promising performance for preoperative prediction of MVI in HCC, particularly when combined with clinical variables. However, considerable heterogeneity and limited external validation highlight the need for methodological standardization and prospective multicenter validation before clinical implementation.
Introduction
Hepatocellular carcinoma (HCC) is among the most common malignancies worldwide and remains a leading cause of cancer-related mortality1. Microvascular invasion (MVI) is a key pathological feature associated with aggressive tumor behavior and is consistently linked to early recurrence and reduced overall survival following liver resection or transplantation2,3,4. However, preoperative identification of microvascular invasion remains challenging because it can only be definitively confirmed on histopathological examination of resected or explanted specimens. As a result, treatment decisions must often be made without direct knowledge of MVI status. In current practice, indirect indicators are widely and mainly used to estimate the likelihood of MVI, including tumor size, serum alpha-fetoprotein levels5, presence of satellite nodules, and qualitative imaging features such as irregular tumor margins, peritumoral enhancement, and absence of a capsule6.
These factors are associated with MVI at a population level and are incorporated into clinical decision-making; however, their predictive accuracy at the individual patient level remains modest7,8. For example, serum alpha-fetoprotein is elevated in only a subset of patients and lacks specificity, while imaging features are subject to interobserver variability and depend on acquisition protocols and reader expertise9,10. In addition, conventional imaging assessment is largely qualitative and does not capture the spatial heterogeneity of tumor architecture or the subtle microenvironmental changes at the tumor–liver interface that are associated with microscopic vascular invasion11. These limitations reduce the reliability of current preoperative risk assessment and highlight the need for more robust and quantitative approaches. Radiomics, which enables high-throughput extraction of image-derived features, provides a means of capturing intratumoral and peritumoral heterogeneity that might reflect underlying tumor biology12,13. Features such as peritumoral arterial enhancement, irregular margins, and hepatobiliary phase hypointensity are associated with MVI, supporting the potential role of imaging-based quantitative models14.
However, reported diagnostic performance has been inconsistent, partly because of variation in imaging modality, acquisition protocols, segmentation methods, and model development approaches. In addition, most studies are retrospective and conducted in single-center settings, and relatively few include independent external validation. Therefore, this systematic review aims to assess the diagnostic accuracy of radiomics-based models, including MRI- and CT-based models, for the preoperative prediction of microvascular invasion in hepatocellular carcinoma, presenting the data separately according to imaging modality, segmentation strategy, and model type to account for heterogeneity in imaging approaches and model development.
Protocol
Search strategy
Four data sources were searched, including PubMed (MEDLINE), Embase, Web of Science, and the Cochrane Library, from January 2015 to April 2026. The search strategy was developed by combining three conceptual blocks using Boolean operators: terms related to the disease (hepatocellular carcinoma, HCC, liver cancer, hepatic carcinoma), terms related to the methodology (radiomics, radiomic, texture analysis, quantitative imaging, imaging biomarker), and terms related to the outcome (microvascular invasion, MVI, vascular invasion, microscopic vascular invasion). The PubMed search string was as follows: (("hepatocellular carcinoma"[MeSH Terms] OR "liver cancer"[Title/Abstract] OR "HCC"[Title/Abstract] OR "hepatic carcinoma"[Title/Abstract]) AND ("radiomics"[Title/Abstract] OR "radiomic"[Title/Abstract] OR "texture analysis"[Title/Abstract] OR "quantitative imaging"[Title/Abstract] OR "imaging biomarker"[Title/Abstract]) AND ("microvascular invasion"[MeSH Terms] OR "MVI"[Title/Abstract] OR "vascular invasion"[Title/Abstract] OR "microscopic vascular invasion"[Title/Abstract])) AND (2015/01/01:2026/04/30[Date - Publication]).
Study selection
All retrieved records were imported into Rayyan (Qatar Computing Research Institute), a web-based systematic review platform, for duplicate removal and screening. Two independent reviewers screened all titles and abstracts against the predefined eligibility criteria. Full-text articles were then retrieved and assessed independently by the same two reviewers for final inclusion. Studies reporting sufficient diagnostic performance data to contribute to at least one prespecified quantitative synthesis were eligible. When available, true-positive, true-negative, false-positive, and false-negative data were extracted for secondary diagnostic-accuracy analyses. Disagreements at any stage of screening were resolved through discussion, with arbitration by a third senior reviewer when consensus could not be reached. The study selection process is summarised in a PRISMA flow diagram (Figure 1). All the tools and platforms used for this study are listed in the Table of Materials.
Data extraction
Two reviewers independently extracted data from all included studies using a standardized, piloted data extraction form. Extracted items included study characteristics (first author, year of publication, country, study design, recruitment period, and institution type), patient characteristics (sample size, mean or median age, sex distribution, MVI prevalence, aetiology of liver disease, and tumor characteristics), imaging characteristics (modality, scanner type, contrast agent, and imaging phase), radiomics methodology (segmentation region type; peritumoral margin width where applicable; ROI delineation method; segmentation dimensionality), model characteristics (classifier type and validation strategy), and diagnostic performance metrics (area under the receiver operating characteristic curve [AUC], sensitivity, specificity, positive likelihood ratio, negative likelihood ratio, and diagnostic odds ratio). Where studies reported multiple eligible models or cohorts, the corresponding model-level or cohort-level estimates used in the prespecified quantitative analyses were extracted. Suffixes (a-d) are used in Tables 1 and 2 to distinguish these estimates. Discrepancies between reviewers during data extraction were resolved by consensus.
Quality assessment
Methodological quality of included studies was evaluated using two complementary tools. Risk of bias and applicability concerns were assessed using the Quality Assessment of Diagnostic Accuracy Studies 2 (QUADAS-2) tool15. Radiomics-specific methodological quality was assessed using the Methodological Radiomics Score (METRICS)16. Quality assessment was performed independently by two reviewers, with disagreements resolved by consensus. Results are presented narratively and graphically using domain-level summary tables.
Statistical analysis
Discriminative performance was summarised using the C statistic (area under the receiver operating characteristic curve [AUC]). A random-effects meta-analysis of AUC values was performed using the restricted maximum likelihood method to account for between-study variability. When not directly reported, standard errors were derived from published 95% confidence intervals; for studies without variance estimates, standard errors were approximated using the method of Hanley and McNeil based on the number of positive and negative cases17. To stabilise variances, AUC values were logit-transformed prior to meta-analysis and back-transformed for interpretation. Pooled estimates were presented with corresponding 95% confidence intervals. Between-study heterogeneity was assessed using the I2 statistic, with values of 25%, 50%, and 75% representing low, moderate, and high heterogeneity, respectively. Studies were descriptively categorized as tumor-only or as models incorporating both tumor and peritumoral regions. A separate peritumoral-only quantitative subgroup was not performed because this category was not sufficiently represented. Additional subgroup analyses were performed according to imaging modality (CT versus MRI) and segmentation dimensionality (2D versus 3D). Additional analyses were performed restricting to externally validated models to assess generalizability. All statistical analyses were performed using R software (version 4.4.1). The following R packages were used: meta (version 7.0-1) and metafor (version 4.6-0) for meta-analysis, and dmetar (version 0.1.0) for supplementary functions. Pooled AUCs were calculated using the metagen function with the restricted maximum likelihood estimator. Model settings included the Knapp-Hartung adjustment for confidence intervals. The analysis code is provided as Supplementary File 2. A two-sided p-value of less than 0.05 was considered statistically significant for all tests.
Results
The literature search identified 368 records, of which 89 were duplicates. After duplicate removal, 279 records were screened, and 26 studies met the inclusion criteria (Figure 1). No additional studies were identified through manual searching.
Study characteristics
The 26 included studies18,19,20,21,22,23,24,25,26,27,28,29,30,31,32,33,34,35,36,37,38,39,40,41,42,43 were predominantly retrospective (25 of 26), with one prospective study. Most studies were conducted in China (23 studies), with the remainder originating from Europe. Sample sizes varied considerably across studies, with training cohorts ranging from 66 to 461 patients and validation cohorts from 25 to 283 patients. External validation was performed in 9 studies, whereas the majority (17 studies) relied solely on internal validation. Magnetic resonance imaging (MRI) was the most frequently used modality (17 studies), followed by computed tomography (CT) (10 studies), with one study integrating both CT and MRI. Most studies applied three‑dimensional segmentation approaches (22 studies), while two studies explicitly used two‑dimensional segmentation. The remaining two studies (references 18 and 30) did not clearly specify their segmentation dimensionality or employed a hybrid approach that could not be confidently categorized; these two studies were therefore excluded from the segmentation‑stratified subgroup analysis but remained in the overall pooled analysis. Segmentation strategies varied across studies. Sixteen studies analyzed tumor-only regions, whereas 10 incorporated both tumor and peritumoral regions, typically defined using fixed radial margins. Studies incorporating peritumoral information were more frequently conducted in later years. A total of 26 prediction models were identified across the included studies. Most studies (15 of 26) developed clinicoradiomics models integrating radiomic features with clinical variables, while 11 studies used radiomics-only approaches (Table 1). Reported accuracy, sensitivity, specificity, and corresponding contingency table data (TP, FP, FN, TN) across included studies are summarised in Table 2.
Model discrimination
Across all included studies, radiomics-based models demonstrated good discriminative performance for the prediction of microvascular invasion. The pooled C-statistic (AUC) from the random-effects model was 0.85 (95% CI 0.82–0.88), with substantial between-study heterogeneity (I2 = 77%) (Figure 2). When stratified by model type, clinicoradiomics models demonstrated higher and more consistent discriminative performance compared with radiomics-only models. Radiomics-only models yielded a pooled AUC of 0.84 (95% CI 0.78–0.88), with substantial heterogeneity (I2 = 80%) (Figure 2). In contrast, models incorporating both radiomics and clinical variables achieved a higher pooled AUC of 0.87 (95% CI 0.85–0.89) and showed markedly lower heterogeneity (I2 = 23%) (Figure 2).
Among studies using 3D segmentation (Supplementary Figure 1), the pooled AUC was 0.85 (95% CI 0.82–0.88), with substantial heterogeneity (I2 = 77.8%). In subgroup analysis, radiomics-only models achieved a pooled AUC of 0.83 (95% CI 0.78–0.88; I2 = 80.7%), whereas clinicoradiomics models demonstrated higher and more consistent performance (AUC 0.87, 95% CI 0.85–0.89; I2 = 15.1%). In CT-based studies (Supplementary Figure 2), the pooled AUC was 0.83 (95% CI 0.76–0.88), although heterogeneity was high (I2 = 88.6%). Performance appeared to vary substantially across radiomics-only models (AUC 0.81, 95% CI 0.70–0.89; I2 = 85.1%), whereas models incorporating clinical variables were both higher performing and notably more consistent (AUC 0.87, 95% CI 0.83–0.90; I2 = 4.0%). In MRI-based studies (Supplementary Figure 3), overall discrimination was slightly higher, with a pooled AUC of 0.86 (95% CI 0.83–0.89) and moderate heterogeneity (I2 = 57.6%). A similar pattern was observed, with clinicoradiomics models showing marginally better performance and reduced variability (AUC 0.87, 95% CI 0.84–0.90; I2 = 33.4%) compared with radiomics-only approaches (AUC 0.85, 95% CI 0.79–0.89; I2 = 61.7%).
External validation performance
Among externally validated models (n=9), overall discriminative performance remained high. The pooled AUC was 0.87 (95% CI 0.82–0.91), with moderate heterogeneity (I2 = 66%) (Supplementary Figure 4). Subgroup analysis within external validation cohorts showed comparable pooled performance between model types but differences in precision. Radiomics-only models achieved a pooled AUC of 0.87 (95% CI 0.78–0.93), whereas clinicoradiomics models yielded a pooled AUC of 0.87 (95% CI 0.83–0.91).
Quality assessment
Overall methodological quality was moderate. The reference standard and flow domains were consistently low risk, with all studies using histopathology and appropriate imaging-to-surgery intervals. The main source of bias was the index test domain, reflecting high-dimensional radiomics or deep learning models, limited pre-specification of modeling strategies, and inconsistent reporting of reproducibility. Patient selection was generally low risk, although concerns were higher in smaller single-center retrospective cohorts (Supplementary Table 1). Radiomics-specific assessment showed variable methodological rigor (Supplementary Table 1). While imaging protocols and segmentation were typically reported, reproducibility testing and external validation were less common. More recent multicenter studies demonstrated improved design and validation practices, although heterogeneity across methods remained substantial.
DATA AVAILABILITY:
All data generated or analyzed during this systematic review and meta-analysis are included in this published article and its supplementary information files. The database search strategies are provided in Supplementary File 1, and the R analysis code is in Supplementary File 2. The extracted study‑level data used for pooling are fully presented in Tables 1 and 2, and the detailed quality assessment results are in Supplementary Table 1. No additional raw data files beyond these are required for the reproduction of the findings.
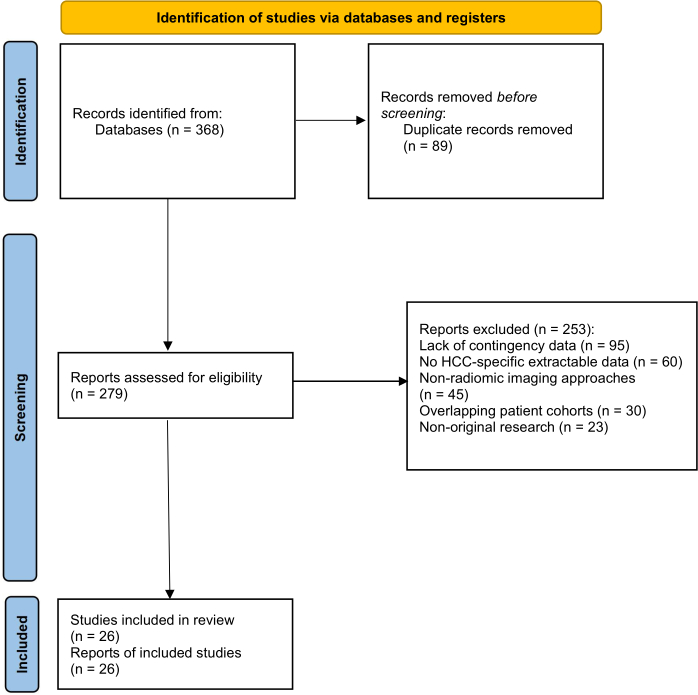
Figure 1: Flow diagram of the study selection process. Flow diagram of study identification, screening, eligibility assessment, and inclusion, with the number of records at each stage. Please click here to view a larger version of this figure.
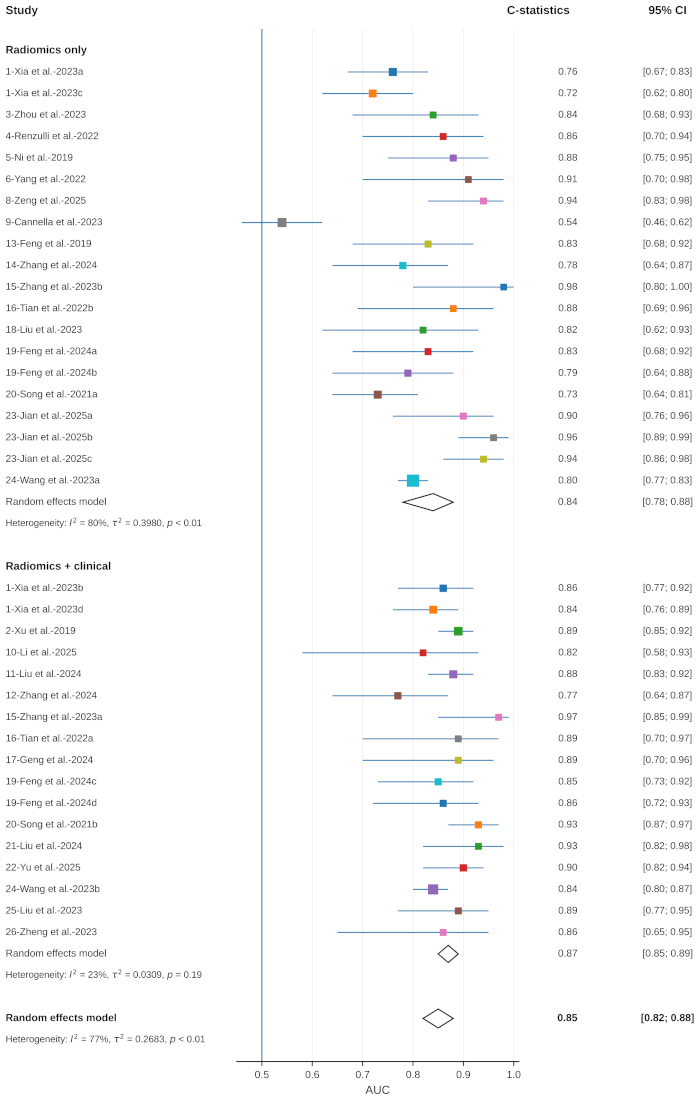
Figure 2: Forest plot of diagnostic performance of radiomics models for predicting microvascular invasion. Study-level and pooled C-statistics (AUCs) with 95% confidence intervals are shown, stratified by model type. Random-effects models were used, with heterogeneity assessed using the I2 statistic. Please click here to view a larger version of this figure.
Table 1: Characteristics of the included studies. Summary of study design, population, imaging modality, segmentation strategy, model type, and validation approach. Suffixes (a–c) indicate multiple models or cohorts within a single study. Abbreviations: CT = computed tomography; MRI = magnetic resonance imaging. Please click here to download this Table.
Table 2: Diagnostic performance of radiomics models for predicting microvascular invasion. Study-level accuracy, sensitivity, specificity, and contingency data (TP, FP, FN, TN) are shown by model type and validation setting. Accuracy was recalculated where necessary. Suffixes (a–c) denote multiple models or cohorts within the same study. Please click here to download this Table.
Supplementary Figure 1: Diagnostic performance of radiomics models using 3D segmentation. Forest plot showing study-level and pooled C-statistics (AUCs) for studies that applied 3D segmentation approaches, stratified by model type (radiomics-only vs. clinicoradiomics). The analysis was performed to assess whether 3D volumetric feature extraction, which captures spatial heterogeneity more comprehensively, yields performance differences compared with the overall pooled estimate, and to evaluate heterogeneity within each subgroup. Please click here to download this file.
Supplementary Figure 2: Diagnostic performance of CT-based radiomics models. Forest plot showing study-level and pooled C-statistics (AUCs) for studies that used computed tomography (CT) as the imaging modality, stratified by model type (radiomics-only vs. clinicoradiomics). This subgroup analysis was conducted to evaluate whether CT-based radiomics models achieve comparable diagnostic performance to MRI-based models, and to assess the impact of adding clinical variables on performance consistency within CT studies. Please click here to download this file.
Supplementary Figure 3: Diagnostic performance of MRI-based radiomics models. Forest plot showing study-level and pooled C-statistics (AUCs) for studies that used magnetic resonance imaging (MRI) as the imaging modality, stratified by model type (radiomics-only vs. clinicoradiomics). This subgroup analysis was performed to assess whether the superior soft-tissue contrast and multiparametric capability of MRI translate into higher discriminative performance for MVI prediction compared with CT-based models. Please click here to download this file.
Supplementary Figure 4: Diagnostic performance of externally validated models. Forest plot showing study-level and pooled C-statistics (AUCs) for models that underwent external validation in independent cohorts, stratified by model type (radiomics-only vs. clinicoradiomics). This analysis was conducted specifically to evaluate the generalizability of radiomics-based models to independent datasets and to assess whether performance decrements occur when models are applied to external populations, which is a critical indicator of clinical applicability. Please click here to download this file.
Supplementary Table 1: Quality assessment of included studies. Detailed results of the methodological quality assessment using the QUADAS-2 tool for each included study. The table presents risk-of-bias and applicability concern ratings across four domains: patient selection, index test, reference standard, and flow and timing. Each domain is rated as "low risk," "high risk," or "unclear risk," with judgments supported by specific reasons extracted from each study. This enables readers to evaluate the methodological rigor of individual studies and identify potential sources of bias that may influence the pooled estimates. Please click here to download this file.
Supplementary File 1: Database search strategies. All the database search strategies are combined in this document. Please click here to download this file.
Supplementary File 2: R analysis code. The code used to run this analysis is included in this document. Please click here to download this file.
Discussion
This systematic review and meta-analysis of 26 studies found that radiomics-based models demonstrate good, but variable, performance for the preoperative prediction of microvascular invasion in hepatocellular carcinoma, with most AUC estimates ranging between approximately 0.80 and 0.90. Across studies, diagnostic accuracy was generally moderate to high, with sensitivity and specificity typically exceeding 70%, although performance was not uniform. Models incorporating clinical variables tended to show more consistent discrimination and higher specificity than radiomics-only models. In addition, MRI-based approaches showed slightly higher performance than CT-based models. However, these findings should be interpreted in the context of substantial between-study heterogeneity and differences in study design, imaging protocols, and modeling strategies, which likely contributed to the observed variation in performance.
Several previous meta-analyses have evaluated radiomics for MVI prediction in HCC. One study44 included 13 studies and reported a pooled AUC of 0.88 for MRI-based radiomics, with combined models outperforming radiomics-only approaches (AUC: 0.90 vs 0.85). Another study45 analyzed 26 studies involving 3,539 patients with solitary HCC and reported a pooled AUC of 0.85 (95% CI 0.82–0.88) for radiomics models. The present synthesis extends these findings by demonstrating higher and more consistent performance for clinicoradiomics models (AUC 0.87) compared with radiomics-only models (AUC 0.84), highlighting the incremental value of clinical variable integration. Furthermore, the separate analyses by imaging modality—showing MRI (0.86) outperforming CT (0.83)—provide more precise estimates than prior work. Another meta-analysis by a group46 included both CT and MRI studies but focused primarily on risk stratification rather than model type comparisons. The present study extends previous work by comparing radiomics-only and clinicoradiomics models across imaging modalities and by separately evaluating externally validated models. These incremental innovations provide a more nuanced understanding of radiomics model performance and offer clearer guidance for future model development and clinical translation.
The higher and more consistent performance observed in models incorporating clinical variables in this meta-analysis is consistent with the underlying pathophysiology of microvascular invasion. Microvascular invasion represents tumor spread into small portal venous branches at the tumor margin, often accompanied by microscopic tumor thrombi and alterations in local hepatic perfusion. These changes are most pronounced at the tumor–liver interface rather than within the tumor core, which explains why imaging features reflecting this region are repeatedly associated with MVI. For example, peritumoral arterial enhancement and hepatobiliary phase hypointensity have been linked to reduced portal venous inflow and compensatory arterial hyperperfusion caused by microscopic vascular obstruction, while irregular or non-smooth tumor margins reflect infiltrative growth patterns that extend beyond the apparent tumor boundary. Quantitative imaging enables systematic characterization of texture and signal intensity within and around the tumor, reflecting underlying differences in cellular density, necrosis, and microvascular structure.
These findings indicate that imaging features alone are insufficient for accurate characterisation of microvascular invasion risk. Across included studies, radiomics-only models demonstrated substantial heterogeneity and slightly lower discriminative performance compared with clinicoradiomics models. This likely reflects the fact that microvascular invasion is not solely determined by local imaging characteristics but also by tumor biology at a systemic level. Clinical factors such as elevated alpha-fetoprotein, larger tumor size, and impaired liver function are well-established markers of tumor aggressiveness and have been consistently associated with vascular invasion and early recurrence. Larger tumors are more likely to invade adjacent microvasculature, while elevated AFP is associated with poorer differentiation and more aggressive phenotypes. The integration of these variables with imaging features therefore provides complementary information, combining local evidence of microscopic invasion with broader indicators of tumor behavior. This is reflected in the present analysis, where clinicoradiomics models not only achieved higher pooled AUCs but also demonstrated markedly lower heterogeneity, suggesting greater stability across different study settings.
The mechanistic basis for the predictive value of peritumoral radiomic features lies in the pathophysiological changes associated with MVI at the tumor–liver interface. Microvascular invasion involves tumor cell emboli within portal venous branches adjacent to the tumor margin, leading to partial or complete obstruction of small portal venules. This obstruction results in reduced portal venous inflow to the peritumoral liver parenchyma, with compensatory arterial hyperperfusion—a phenomenon reflected on imaging as peritumoral arterial enhancement or perfusion heterogeneity. Additionally, microscopic tumor thrombi induce local inflammatory responses and alter tissue microarchitecture, which may be captured by radiomic texture features reflecting changes in cellular density, necrosis, and microvascular density. Pathological studies have demonstrated that these peritumoral changes extend beyond the gross tumor boundary, providing a biological rationale for incorporating peritumoral regions with varying radial margins into radiomic models. The consistent association between peritumoral imaging features and MVI in the included studies is thus grounded in these underlying vascular and microstructural alterations, lending biological plausibility to the quantitative imaging findings.
The slightly higher performance observed in MRI-based models is also consistent with known differences in imaging capability. MRI enables multiparametric assessment, such as diffusion, perfusion, and hepatocyte-specific contrast uptake, which are associated with tumor differentiation and vascular invasion45. Hepatobiliary phase hypointensity and peritumoral signal changes are more readily detected on MRI. These features reflect impaired hepatocyte function and altered perfusion related to microscopic tumor spread. CT relies mainly on contrast enhancement patterns. It is less sensitive to these changes. This may explain the greater variability observed in CT-based models.
It is worth noting that the present review focused on CT- and MRI-based radiomics, as these were the predominant modalities in the literature. However, PET/CT radiomics may offer complementary value for MVI prediction by characterizing tumor metabolism, hypoxia, and biological heterogeneity—features that are not captured by anatomical or functional MRI alone. Emerging evidence suggests that metabolic parameters such as SUVmax and textural features from PET may correlate with tumor aggressiveness and vascular invasion. Nevertheless, the evidence base for PET/CT radiomics in MVI prediction remains limited compared with CT and MRI, and this area warrants further investigation in future studies. These findings have implications for clinical practice, particularly in the preoperative assessment of hepatocellular carcinoma. Preoperative identification of microvascular invasion remains difficult and affects the selection of resection, transplantation, or locoregional therapy. Quantitative imaging models that incorporate clinical variables may improve risk stratification beyond routine imaging and serum markers. A high predicted risk may support wider margins or closer postoperative surveillance in patients considered for resection. Similarly, improved risk stratification may be helpful for selection and listing decisions, particularly in borderline cases in transplant candidates.
It is important to note that while discriminative performance (AUC) was the primary focus of this meta-analysis, calibration and clinical utility are equally essential for real-world applicability. Calibration metrics—such as the Hosmer-Lemeshow test and calibration plots—assess the agreement between predicted and observed risks and are critical for informed clinical decision-making. Decision curve analysis evaluates the net benefit of using a model across different risk thresholds, which is directly relevant to clinical practice. However, among the included studies, only a minority reported calibration measures or decision curve analysis, representing a significant knowledge gap. Future studies should prioritize reporting these metrics to facilitate clinical translation and to ensure that model predictions are both accurate and actionable.
Despite the promising performance observed, these models are not yet ready for routine clinical use. Most studies were retrospective and conducted in single-center settings, with substantial variation in imaging protocols, segmentation methods, and model development. External validation was limited, and when performed, validation cohorts were often small or derived from similar populations. Few studies evaluated calibration, clinical utility, or the impact of model use on treatment decisions. These limitations are important in practice, where decisions regarding resection margins, transplant eligibility, and surveillance intensity require reliable and generalisable risk estimates. In addition, variability in image acquisition and processing across centers may affect model performance and reproducibility, further limiting translation into routine care. At present, these models should be considered adjuncts to established clinical and imaging assessment rather than standalone tools. Future work should focus on prospective, multicenter validation, standardization of imaging and analytical methods, and evaluation of clinical utility, including whether use of these models improves decision-making and patient outcomes.
This study has several limitations. First, the geographic distribution was heavily skewed, with 23 of 26 studies (88.5%) conducted in China and only 3 from European regions, which substantially limits generalizability to global HCC populations given the etiological differences between Eastern (viral hepatitis-related) and Western (metabolic-related) HCC, and formal subgroup analysis by region could not be reliably performed as the Western subgroup did not meet the minimum required sample size (≥10 studies). Second, complete 2 × 2 contingency data were unavailable for several studies, and threshold definitions varied substantially; therefore, the primary quantitative synthesis focused on AUC rather than pooled threshold-dependent diagnostic-accuracy measures (as presented in the Abstract), a comprehensive meta-analysis of these metrics across all 26 included studies was not feasible. This was because several studies omitted complete contingency tables, and, more importantly, there was substantial heterogeneity in threshold definitions across studies, rendering any unadjusted pooling of these metrics methodologically unreliable without accounting for threshold effects. Third, additional subgroup analyses stratified by tumor diameter, contrast agent type, peritumoral margin width, or classifier type could not be performed due to inconsistent reporting and insufficient sample sizes across subgroups (only 1–3 studies per classifier type), limiting the ability to explore the sources of the substantial between-study heterogeneity (I2= 77%). Fourth, the authors could not quantitatively examine the association between methodological quality and model performance through meta-regression, as METRICS scores were not available in a suitable format for all studies, assigning a single QUADAS-2 summary category is inherently subjective, and meta-regression with only 26 studies and multiple covariates would be underpowered and prone to overfitting. Fifth, most included studies were retrospective, single-center studies with relatively small sample sizes, and external validation was reported in only 9 of 26 studies, with most validation cohorts derived from similar institutional settings, limiting generalizability. Variability in imaging protocols, feature extraction pipelines, and model development approaches may further affect reproducibility. Sixth, reporting of diagnostic performance was inconsistent, with some studies omitting complete contingency data, confidence intervals for AUCs, calibration metrics, or decision curve analysis—all essential for assessing real-world applicability—representing a significant knowledge gap. Despite these limitations, the consistent direction of effect across all included studies, with radiomics-based models demonstrating good diagnostic performance (pooled AUC 0.85, 95% CI 0.82–0.88), supports the robustness of the main findings; the higher and more consistent performance of clinicoradiomics models compared with radiomics-only models, along with the higher pooled AUC observed for MRI-based than CT-based models, provides clinically meaningful insights to guide future model development. However, these limitations underscore the need for prospective, multicenter validation studies with standardized imaging protocols, complete reporting of diagnostic performance metrics, and systematic evaluation of calibration and clinical utility before these models can be translated into routine clinical practice.
Disclosures
The authors have no conflicts of interest. AI-assisted tools were used during proof correction for language editing, consistency checking, and figure formatting. No new study data were generated, and all scientific decisions, corrections, and final content were reviewed and approved by the authors, who take full responsibility for the article.
Acknowledgements
This study was supported by the Beijing Research Ward Excellence Program (BRWEP; No. BRWEP2024W032240102).
Materials
| Name | Company | Catalog Number | Comments |
|---|---|---|---|
| Cochrane Library | Wiley | https://www.cochranelibrary.com/ | |
| Cochrane Library | Wiley | https://www.cochranelibrary.com/ | |
| Embase | Elsevier | https://www.embase.com/ | |
| Embase | Elsevier | https://www.embase.com/ | |
| meta R package | CRAN | https://cran.r-project.org/package=meta | |
| meta R package | CRAN | https://cran.r-project.org/package=meta | |
| metafor R package | CRAN | https://cran.r-project.org/package=metafor | |
| metafor R package | CRAN | https://cran.r-project.org/package=metafor | |
| Microsoft Excel | Microsoft Corporation | https://www.microsoft.com/microsoft-365/excel | |
| Microsoft Excel | Microsoft Corporation | https://www.microsoft.com/microsoft-365/excel | |
| PRISMA 2020 flow diagram template | PRISMA Group | http://www.prisma-statement.org/ | |
| Mplus (if used) | StatModel | https://www.statmodel.com/ | |
| PubMed (MEDLINE) | National Library of Medicine | https://pubmed.ncbi.nlm.nih.gov/ | |
| PRISMA 2020 flow diagram template | PRISMA Group | http://www.prisma-statement.org/ | |
| QUADAS-2 tool | Cochrane | https://www.quadas.org/ | |
| PubMed (MEDLINE) | National Library of Medicine | https://pubmed.ncbi.nlm.nih.gov/ | |
| R software (version 4.4.1) | R Foundation for Statistical Computing | https://www.r-project.org/ | |
| QUADAS-2 tool | Cochrane | https://www.quadas.org/ | |
| Rayyan | Qatar Computing Research Institute | https://www.rayyan.ai/ | |
| R software (version 4.4.1) | R Foundation for Statistical Computing | https://www.r-project.org/ | |
| Web of Science | Clarivate | https://www.webofscience.com/ | |
| Rayyan | Qatar Computing Research Institute | https://www.rayyan.ai/ | |
| Web of Science | Clarivate | https://www.webofscience.com/ |
References
- Villanueva A. Hepatocellular Carcinoma. N Engl J Med. 2019;380(15):1450-1462.
- Mazzaferro V, et al. Predicting survival after liver transplantation in patients with hepatocellular carcinoma beyond the Milan criteria: a retrospective, exploratory analysis. The lancet oncology. 2009;10(1):35-43.
- Lee S, et al. Effect of microvascular invasion risk on early recurrence of hepatocellular carcinoma after surgery and radiofrequency ablation. Annals of surgery. 2021;273(3):564-571.
- Tabrizian P, et al. Recurrence of hepatocellular cancer after resection: patterns, treatments, and prognosis. Ann Surg. 2015;261(5):947-955.
- McHugh PP, et al. Alpha-fetoprotein and tumour size are associated with microvascular invasion in explanted livers of patients undergoing transplantation with hepatocellular carcinoma. HPB. 2010;12(1):56-61.
- Renzulli M, et al. Can Current Preoperative Imaging Be Used to Detect Microvascular Invasion of Hepatocellular Carcinoma? Radiology. 2016;279(2):432-442.
- Luo WL, et al. Impact of Middle Hepatic Vein Resection During Hemihepatectomy on Surgical Outcomes and Long-Term Prognosis in Hepatocellular Carcinoma: A Retrospective Study. Journal of hepatocellular carcinoma. 2025;12:2681-2692.
- Li J, et al. Prognostic value of lymphatic vessel density in the capsule of early-stage hepatocellular carcinoma: implications for postoperative recurrence risk. Frontiers in immunology. 2026;17:1714314.
- Hanif H, et al. Update on the applications and limitations of alpha-fetoprotein for hepatocellular carcinoma. World J Gastroenterol. 2022;28(2):216-229.
- Turshudzhyan A, et al. Persistently Rising Alpha-fetoprotein in the Diagnosis of Hepatocellular Carcinoma: A Review. J Clin Transl Hepatol. 2022;10(1):159-163.
- Lee S, et al. Preoperative gadoxetic acid–enhanced MRI for predicting microvascular invasion in patients with single hepatocellular carcinoma. Journal of hepatology. 2017;67(3):526-534.
- Barry N, et al. Evaluating the impact of the Radiomics Quality Score: a systematic review and meta-analysis. European Radiology. 2025;35(3):1701-1713.
- Kocak B, et al. Quality of radiomics research: comprehensive analysis of 1574 unique publications from 89 reviews. European Radiology. 2025;35(4):1980-1992.
- Wang Q, et al. Radiomics models for preoperative prediction of the histopathological grade of hepatocellular carcinoma: A systematic review and radiomics quality score assessment. European Journal of Radiology. 2023;166.
- Whiting PF, et al. QUADAS-2: a revised tool for the quality assessment of diagnostic accuracy studies. Ann Intern Med. 2011;155(8):529-536.
- Kocak B, et al. METhodological RadiomICs Score (METRICS): a quality scoring tool for radiomics research endorsed by EuSoMII. Insights Imaging. 2024;15(1):8.
- Hanley JA, et al. A method of comparing the areas under receiver operating characteristic curves derived from the same cases. Radiology. 1983;148(3):839-843.
- Cannella R, et al. Performances and variability of CT radiomics for the prediction of microvascular invasion and survival in patients with HCC: a matter of chance or standardisation? Eur Radiol. 2023;33(11):7618-7628.
- Famularo S, et al. Preoperative detection of hepatocellular carcinoma's microvascular invasion on CT-scan by machine learning and radiomics: A preliminary analysis. Eur J Surg Oncol. 2025;51(1):108274.
- Feng B, et al. The Value of LI-RADS and Radiomic Features from MRI for Predicting Microvascular Invasion in Hepatocellular Carcinoma within 5 cm. Acad Radiol. 2024;31(6):2381-2390.
- Feng ST, et al. Preoperative prediction of microvascular invasion in hepatocellular cancer: a radiomics model using Gd-EOB-DTPA-enhanced MRI. Eur Radiol. 2019;29(9):4648-4659.
- Geng Z, et al. Prediction of microvascular invasion in hepatocellular carcinoma patients with MRI radiomics based on susceptibility weighted imaging and T2-weighted imaging. Radiol Med. 2024;129(8):1130-1142.
- Jian W, et al. Predicting microvascular invasion in solitary hepatocellular carcinoma: a multi-center study integrating clinical, MRI assessments, and radiomics indicators. Front Oncol. 2025;15:1511260.
- Li J, et al. A clinical study exploring the prediction of microvascular invasion in hepatocellular carcinoma through the use of combined enhanced CT and MRI radiomics. PLoS One. 2025;20(1):e0318232.
- Liu HF, et al. A nomogram model integrating LI-RADS features and radiomics based on contrast-enhanced magnetic resonance imaging for predicting microvascular invasion in hepatocellular carcinoma falling the Milan criteria. Transl Oncol. 2023;27:101597.
- Liu J, et al. Development of a magnetic resonance imaging-derived radiomics model to predict microvascular invasion in patients with hepatocellular carcinoma. Quant Imaging Med Surg. 2023;13(6):3948-3961.
- Liu WM, et al. Radiomics of Preoperative Multi-Sequence Magnetic Resonance Imaging Can Improve the Predictive Performance of Microvascular Invasion in Hepatocellular Carcinoma. World J Oncol. 2024;15(1):58-71.
- Liu Y, et al. Clinical prediction of microvascular invasion in hepatocellular carcinoma using an MRI-based graph convolutional network model integrated with nomogram. Br J Radiol. 2024;97(1157):938-946.
- Ni M, et al. Radiomics models for diagnosing microvascular invasion in hepatocellular carcinoma: which model is the best model? Cancer Imaging. 2019;19(1):60.
- Renzulli M, et al. Automatically Extracted Machine Learning Features from Preoperative CT to Early Predict Microvascular Invasion in HCC: The Role of the Zone of Transition (ZOT). Cancers (Basel). 2022;14(7).
- Song D, et al. Using deep learning to predict microvascular invasion in hepatocellular carcinoma based on dynamic contrast-enhanced MRI combined with clinical parameters. J Cancer Res Clin Oncol. 2021;147(12):3757-67.
- Tian Y, et al. Preoperative Evaluation of Gd-EOB-DTPA-Enhanced MRI Radiomics-Based Nomogram in Small Solitary Hepatocellular Carcinoma (≤3 cm) With Microvascular Invasion: A Two-Center Study. J Magn Reson Imaging. 2022;56(5):1459-72.
- Wang L, et al. A Nomogram of Magnetic Resonance Imaging for Preoperative Assessment of Microvascular Invasion and Prognosis of Hepatocellular Carcinoma. Dig Dis Sci. 2023;68(12):4521-35.
- Xia TY, et al. Predicting Microvascular Invasion in Hepatocellular Carcinoma Using CT-based Radiomics Model. Radiology. 2023;307(4):e222729.
- Xu X, et al. Radiomic analysis of contrast-enhanced CT predicts microvascular invasion and outcome in hepatocellular carcinoma. J Hepatol. 2019;70(6):1133-44.
- Yang Y, et al. Deep learning radiomics based on contrast enhanced computed tomography predicts microvascular invasion and survival outcome in early stage hepatocellular carcinoma. Eur J Surg Oncol. 2022;48(5):1068-77.
- Yu H, et al. MRI-based 2.5D deep learning and radiomics effectively predicted microvascular invasion and Ki-67 expression in hepatocellular carcinoma. PLoS One. 2025;20(11):e0336579.
- Zeng J, et al. Multiparametric dual-energy computed tomography radiomics for predicting microvascular invasion in hepatocellular carcinoma. BMC Med Imaging. 2025;25(1):520.
- Zhang K, et al. Radiomics nomogram for the prediction of microvascular invasion of HCC and patients' benefit from postoperative adjuvant TACE: a multi-center study. Eur Radiol. 2023;33(12):8936-47.
- Zhang R, et al. Dynamic radiomics based on contrast-enhanced MRI for predicting microvascular invasion in hepatocellular carcinoma. BMC Med Imaging. 2024;24(1):80.
- Zhang Z, et al. Radiomics-Based Prediction of Microvascular Invasion Grade in Nodular Hepatocellular Carcinoma Using Contrast-Enhanced Magnetic Resonance Imaging. J Hepatocell Carcinoma. 2024;11:1185-92.
- Zheng R, Zhang X, Liu B, Zhang Y, Shen H, Xie X, et al. Comparison of non-radiomics imaging features and radiomics models based on contrast-enhanced ultrasound and Gd-EOB-DTPA-enhanced MRI for predicting microvascular invasion in hepatocellular carcinoma within 5 cm. Eur Radiol. 2023;33(9):6462-72.
- Zhou Z, et al. Prediction of preoperative microvascular invasion by dynamic radiomic analysis based on contrast-enhanced computed tomography. Abdom Radiol (NY). 2024;49(2):611-24.
- Zhou HY, et al. A Systematic Review and Meta-Analysis of MRI Radiomics for Predicting Microvascular Invasion in Patients with Hepatocellular Carcinoma. Current Medical Imaging. 2024;20:e15734056256824.
- Gou J, et al. The Diagnostic Accuracy Between Radiomics Model and Non-radiomics Model for Preoperative of Microvascular Invasion of Solitary Hepatocellular Carcinoma: A Systematic Review and Meta-analysis. Academic Radiology. 2024 Nov;31(11):4419-4433.
- Bodard S, et al. Performance of radiomics in microvascular invasion risk stratification and prognostic assessment in hepatocellular carcinoma: a meta-analysis. Cancers (Basel). 2023 Jan 25;15(3):743.