This protocol describes a mouse model of coronavirus disease 2019-associated lung injury induced by combined intranasal administration of severe acute respiratory syndrome coronavirus 2 and lipopolysaccharide. The model enables investigation of pulmonary inflammatory responses, impaired type I interferon responses, and potential therapeutic interventions.
Method Article
A Mouse Model of Coronavirus Disease 2019-Associated Lung Injury Induced by Severe Acute Respiratory Syndrome Coronavirus 2 and Lipopolysaccharide
83 views
⸱
September 11th, 2026
* These authors contributed equally
In This Article
Summary
Abstract
Despite the widespread implementation of vaccination and antiviral therapies, SARS-CoV-2 infection continues to cause substantial morbidity and mortality among vulnerable populations, underscoring the urgent need for reliable experimental models to investigate the pathogenesis of COVID-19, elucidate the mechanisms of drug action, and evaluate potential therapeutic strategies. SARS-CoV-2 infection can cause severe lung injury, characterized by excessive inflammatory responses and impaired type I interferon (IFN-I)-mediated antiviral immunity; however, current animal models remain limited in recapitulating the dysregulated immune-inflammatory responses associated with COVID-19. A SARS-CoV-2 and LPS-induced mouse model of COVID-19-associated lung injury was developed to recapitulate key immunopathological features of COVID-19. This model induces prominent pathological features in lung tissue, including inflammatory cell infiltration, alveolar structural destruction, and elevated expression of pro-inflammatory cytokines, accompanied by impaired IFN-I responses. This study provides a detailed description of the procedures used to establish the SARS-CoV-2 and LPS-induced mouse model of lung injury and systematically characterizes the model through analyses of lung histopathological alterations, viral load, inflammatory cytokines, and IFN-I levels. This model offers an experimental platform for investigating the immune-inflammatory mechanisms underlying COVID-19-associated lung injury and the processes involved in lung tissue repair, while also providing a foundation for evaluating therapeutic strategies aimed at alleviating immune-inflammatory dysregulation and promoting recovery of pulmonary function.
Introduction
Since its emergence in late 2019, SARS-CoV-2 has caused a global public health challenge, and ongoing viral evolution continues to pose challenges to existing vaccines and therapeutic strategies1,2,3. Therefore, further investigation into COVID-19-associated lung injury is essential for elucidating disease mechanisms and advancing therapeutic strategies.
SARS-CoV-2 infection can cause severe lung injury and may even progress to acute respiratory distress syndrome (ARDS) and multiple organ dysfunction syndrome4,5. A growing body of evidence suggests that the pathogenesis of COVID-19-associated lung injury is highly complex, with a key hallmark being the dysregulation of immune and inflammatory responses6,7,8,9. On the one hand, SARS-CoV-2 infection can induce an excessive inflammatory response, leading to the massive release of pro-inflammatory cytokines such as interleukin-6 (IL-6), interleukin-1β (IL-1β), and tumor necrosis factor-α (TNF-α), thereby triggering a so-called “cytokine storm”10,11, which is considered a major driver of lung injury and disease progression. On the other hand, in the early stage of infection, SARS-CoV-2 can suppress the host IFN-I response through multiple mechanisms, resulting in impaired IFN-I-mediated antiviral immunity12,13,14. Accordingly, a delayed interferon response accompanied by elevated pro-inflammatory cytokine levels is regarded as a characteristic feature of COVID-196,15.
Currently available animal models of COVID-19 largely rely on hACE2 transgenic mice, mouse-adapted viral strains, or other species such as ferrets and nonhuman primates16,17. However, conventional SARS-CoV-2 infection models in mice often fail to fully recapitulate the hyperinflammatory features of COVID-1918,19,20. LPS, a TLR4 agonist, induces robust inflammatory responses and is widely used in acute lung injury models21. Therefore, the SARS-CoV-2 and LPS-induced model described in this study is designed for investigations focusing on COVID-19-associated lung injury, particularly the mechanisms underlying excessive inflammatory activation and impaired antiviral immune responses. Compared with SARS-CoV-2-only models, this approach highlights immune-inflammatory features while preserving viral infection context. This model has considerable potential for investigating immune-inflammatory mechanisms, rather than modeling viral transmission or the complete natural course of SARS-CoV-2 infection.
This protocol outlines the procedural establishment of a SARS-CoV-2 and LPS-induced mouse model of COVID-19-associated lung injury. Given the limitations of existing models in reproducing COVID-19-associated immune-inflammatory dysregulation, this approach provides a practical platform for studying disease mechanisms and evaluating potential therapeutic strategies. The model was systematically evaluated through lung histopathology, viral load, inflammatory cytokines, and IFN-I responses.
Protocol
This study established a mouse model of COVID-19-associated lung injury via intranasal instillation of SARS-CoV-2 and LPS, providing a stable and cost-effective alternative to transgenic mouse models. The experimental protocol was approved by the Sichuan Center for Disease Control and Prevention and received animal ethics approval [Sichuan CDC (Animal Ethics) Approval No. 005 (2025)]. All procedures were conducted in strict accordance with relevant guidelines and biosafety regulations.
Detailed information on the primary reagents and equipment is provided in the Table of Materials.
1. Study protocol design
- Randomly assign BALB/c mice to the control group or model group.
- Administer SARS-CoV-2 intranasally to mice in the model group on day 0.
- Administer LPS intranasally to mice in the model group on day 2.
- Administer an equal volume of normal saline intranasally to control mice at the corresponding time points.
- Euthanize all mice on day 3 after SARS-CoV-2 infection and collect lung tissue for model validation.
NOTE: The experimental workflow is illustrated in Figure 1A.
2. Preparation
- Animal preparation
- Use specific pathogen-free (SPF) female BALB/c mice aged 6–8 months and weighing approximately 25–30 g.
- Randomly assign the mice to either a control group or a model group using a random number table, with four animals per group.
- House the mice under standard laboratory conditions with free access to food and water.
NOTE: Previous studies have shown that aged mice are more susceptible to intranasal SARS-CoV-2 infection than younger mice18,22. Therefore, aged BALB/c mice were selected in this study to facilitate the establishment of a SARS-CoV-2-associated lung injury model. - Intranasally inoculate each mouse with 100 µL of viral suspension, corresponding to a final infectious dose of 4.5 x 10⁵ TCID₅₀ per mouse.
NOTE: SARS-CoV-2 was provided by the Sichuan Center for Disease Control and Prevention. The strain used in this study was the SARS-CoV-2 Omicron variant, with a viral stock titer of 4.5 x 10⁶ TCID₅₀/mL.
CAUTION: As SARS-CoV-2 is a highly pathogenic microorganism, conduct all virus-related procedures in an Animal Biosafety Level 3 (ABSL-3) facility. Optimize the infectious dose based on preliminary experiments when using different viral variants or animal models.
- Preparation of working stock
- Preparation of LPS stock solution: Weigh 3 mg of LPS powder and dissolve it in 1 mL of normal saline. Mix gently or vortex continuously until completely dissolved to obtain a stock solution at a concentration of 3 mg/mL. Prior to administration, further dilute the stock solution with normal saline to the desired working concentration according to the body weight of the mice.
- Preparation of anesthetic solution: Reconstitute the powder with the sterile water for injection provided in the Zoletil package to prepare a solution at the required mass-to-volume ratio for subsequent use.
- Preparation of viral working solution: Thaw 1 mL of SARS-CoV-2 viral suspension slowly on ice in a biosafety cabinet prior to use.
NOTE: Follow the respective manufacturers’ instructions when preparing and using all working solutions.
3. Intranasal administration in mice
- Weigh each mouse before administration and record the body weight.
- Calculate the doses of Zoletil and LPS based on the body weight of each mouse.
- Prepare the corresponding working solutions and draw the required volumes using an appropriate syringe for subsequent administration.
- Mouse restraint: Gently grasp the mouse by the scruff using the thumb and index finger of the left hand, holding the skin behind the ears and neck.
- Place the animal in the palm while using the ring finger and little finger to secure the back and tail. Position the mouse in a supine orientation with the abdomen fully exposed and the body stabilized.
- Disinfection: Disinfect the abdominal injection site with 75% ethanol using a sterile cotton swab.
- Anesthesia: Insert the needle of the syringe containing the Zoletil (25mg/kg) approximately 0.5 cm lateral to the midline of the lower abdomen. Advance the needle at a 45° angle into the peritoneal cavity to a depth of approximately 2–3 mm after penetrating the skin. Aspirate to ensure the absence of blood and then slowly administer the anesthetic.
NOTE: Optimize the anesthetic dose based on pilot experiments to ensure adequate anesthesia and minimize mortality. Avoid repeated puncture to minimize tissue damage. - Confirmation of anesthesia: Confirm the anesthetized state by observing stable and regular respiration without signs of dyspnea or respiratory distress.
- Intranasal instillation of SARS-CoV-2 (day 0): Administer 100 µL of SARS-CoV-2 viral suspension (50 µL per nostril) slowly and dropwise onto the external nares using a micropipette or syringe during a steady respiratory cycle and at the onset of inspiration.
- Alternate nostrils to facilitate uniform inhalation. Treat control mice with an equal volume of normal saline using the same procedure.
NOTE: Administer the solution dropwise, ensuring that each drop is inhaled into the nasal cavity before applying the next until the target volume is reached. - Post-administration handling: Maintain the mouse head in a slightly elevated position for approximately 30–60 s after intranasal instillation to facilitate delivery of the solution into the lower respiratory tract. Return the mice to their cages once signs of recovery from anesthesia are observed and monitor them until full consciousness is restored.
- Recording and monitoring: Record the administration volume and identification number of each mouse. Monitor the animals continuously throughout the experimental period for survival status and general physiological condition.
- Intranasal instillation of LPS (day 2): Administer LPS to mice on day 2 post SARS-CoV-2 infection. Perform intranasal administration of LPS (5 mg/kg) following the same protocol used for SARS-CoV-2 administration. Administer an equal volume of normal saline to control mice using the same procedure.
NOTE: At this step, LPS and normal saline were administered following the same procedure as SARS-CoV-2 inoculation, including anesthesia and intranasal delivery.
4. Mouse dissection and lung tissue collection
- Euthanize the mice on day 3 post SARS-CoV-2 infection for tissue collection. Anesthetize the animals first and then sacrifice them by cervical dislocation. Process control mice using the same procedure.
NOTE: For detailed procedures regarding cervical dislocation, see Supplementary File 1. - Secure the euthanized mouse in a supine position on a dissection board with the abdominal and thoracic regions fully exposed. Moisten the abdominal fur with 75% ethanol to minimize contamination.
- Use sterile scissors to carefully cut the sternum along the bilateral costal margins and open the thoracic cavity gradually. Use forceps to gently retract tissues and dissect the lungs stepwise from the surrounding thoracic structures while minimizing mechanical injury to the lung tissue.
NOTE: Control the orientation of the scissor tips carefully during cutting to avoid damage to the heart, lungs, and major vascular structures. - Place the excised lung tissues immediately in pre-cooled PBS or normal saline and gently rinse them 2–3 times to remove residual blood and debris. Blot excess surface liquid carefully using lint-free filter paper and avoid compression to prevent structural damage to the tissue.
- Weigh the processed lung tissues promptly using an electronic balance and record the measurements.
- Excise the right caudal lobe and immediately fix it in 4% paraformaldehyde at 10 times the volume of the tissue for subsequent histopathological analysis.
CAUTION: Paraformaldehyde is toxic; handle it in accordance with institutional safety guidelines. - Collect the remaining lung tissues, aliquot them into cryovials, rapidly freeze them in liquid nitrogen, and store them at −80 °C for preservation. Allocate the right cranial lobe, right middle lobe, and accessory lobe for SARS-CoV-2 viral load and pro-inflammatory cytokine detection, and reserve the left lung for ELISA analysis.
CAUTION: Liquid nitrogen is extremely cold; wear appropriate cryogenic gloves and safety goggles when handling it to prevent cold burns or frostbite. - Clean and sterilize all instruments thoroughly according to standard procedures after completing the dissection. Dispose of animal carcasses and biological waste in compliance with institutional and regulatory guidelines for animal experiments.
5. Hematoxylin-Eosin (HE) staining23
- Fix fresh lung tissues in 4% paraformaldehyde at room temperature for 24 h.
NOTE: Control the fixation time carefully. Avoid insufficient fixation, which may result in incomplete tissue preservation, and prolonged fixation, which may cause excessive protein cross-linking and affect staining quality. - Process the fixed tissues using an automated tissue processor for graded dehydration, clearing, and paraffin infiltration.
NOTE: The protocol for the automated tissue processor is provided in Supplementary File 2. - Place the paraffin-infiltrated tissues into embedding molds. Add molten paraffin and carefully orient the tissue.
- Transfer the molds onto a cold plate for solidification. Remove the paraffin blocks from the molds after complete hardening.
- Mount the paraffin blocks onto a microtome and adjust the cutting surface to be parallel to the blade. Obtain serial sections at a thickness of approximately 3–5 µm.
- Transfer the sections immediately to a water bath at approximately 45 °C for flotation to allow complete expansion.
- Pick up the sections using slides by vertically dipping one end of the slide into the water and use forceps to assist proper adhesion of the sections onto the slide surface.
- Place the slides in a 65 °C slide dryer for approximately 1 h to enhance tissue adherence.
NOTE: Adjust the drying time according to tissue type, section thickness, and equipment conditions. Avoid overheating to prevent tissue damage. - Perform HE staining on the dried sections using an automated stainer.
NOTE: The protocol for the automated stainer is provided in Supplementary File 3. - Remove the stained sections and air-dry them. Apply a drop of neutral mounting medium and coverslip the slides. Examine the sections under a light microscope after the mounting medium has solidified.
6. Expression of SARS-CoV-2 viral load and pro-inflammatory cytokines in lung tissue
- Lung tissue homogenization
- Prepare RNase-free homogenization tubes by adding 4–5 stainless steel beads (3 mm in diameter) and 900 µL of pre-cooled lysis buffer as the homogenization medium.
NOTE: Adjust the volume of lysis buffer according to tissue weight, typically at a ratio of approximately 9 mL per 1 g of tissue. - Weigh approximately 50 mg of lung tissue, finely mince the tissue, and transfer it into the homogenization tube.
- Homogenize the tissue using a tissue grinder (60 Hz, 60 s, for 2–3 cycles with 10 s intervals between cycles).
NOTE: Optimize homogenization parameters according to the instrument and tissue type. - Inspect the sample after homogenization to ensure complete disruption. Repeat the homogenization process if visible tissue fragments remain until a uniform lysate is obtained.
- Prepare RNase-free homogenization tubes by adding 4–5 stainless steel beads (3 mm in diameter) and 900 µL of pre-cooled lysis buffer as the homogenization medium.
- Column-based extraction of total RNA from lung tissue
NOTE: Extract total RNA from lung tissue using a column-based purification method according to the manufacturer’s instructions. Perform alternative RNA extraction methods according to the corresponding product manuals when applicable.- Transfer the homogenate into a new 2 mL RNase-free microcentrifuge tube. Add 100 µL gDNA Eliminator solution. Secure the tube cap and shake vigorously for 15–20 s.
- Open the cap briefly, add 180 µL chloroform, and vortex thoroughly for 15 s.
CAUTION: Chloroform is volatile and toxic; handle it in a well-ventilated area or chemical fume hood and wear appropriate personal protective equipment to avoid inhalation and skin contact. - Incubate the sample at room temperature for 2 min and then centrifuge at 12,000 x g for 15 min at 4 °C.
- Transfer the upper aqueous phase carefully to a new tube. Add an equal volume of 70% ethanol and mix thoroughly by vortexing.
NOTE: Avoid disturbing the interphase and organic layer when collecting the aqueous phase to ensure RNA purity. Proceed to the next step directly after adding 70% ethanol without centrifugation. - Transfer the mixture to a spin column and centrifuge at 8,000 x g for 15 s. Discard the flow-through.
- Add 700 µL of wash buffer to the spin column and centrifuge at 8,000 x g for 15 s. Discard the flow-through.
- Add 500 µL of wash buffer to the spin column and centrifuge at 8,000 x g for 15 s. Repeat this washing step once.
- Transfer the spin column to a new collection tube and centrifuge at 12,000 x g for 1 min to remove residual wash buffer.
- Place the spin column into a new 1.5 mL RNase-free microcentrifuge tube. Add 30 µL of RNase-free water directly to the center of the membrane and centrifuge at 8,000 x g for 1 min to elute RNA.
NOTE: Adjust the volume of RNase-free water between 30–50 µL according to downstream applications. Use a lower elution volume when a higher RNA concentration is required.
- Detection of SARS-CoV-2 viral load by reverse transcription digital PCR (RT-dPCR)
NOTE: A one-step RT-dPCR assay was employed for absolute quantification of SARS-CoV-2 RNA. Specific primer-probe sets targeting the nucleocapsid (N) gene were used to determine viral RNA copy numbers.- Thaw RNA samples and reagents on ice.
- Prepare the RT-dPCR reaction mixture according to the manufacturer’s instructions.
- Combine 20 µL of RT-dPCR reaction mixture with 20 µL of RNA template. Vortex the mixture briefly, centrifuge it with a short spin, and keep it on ice.
- Load the 40 µL reaction mixture into the digital PCR chip wells and seal the chip according to the instrument protocol.
- Perform amplification using the following thermal cycling conditions: 50 °C for 40 min (1 cycle), 95 °C for 2 min (1 cycle), followed by 40 cycles of 95 °C for 15 s and 57 °C for 60 s. Set the detection channels to GREEN (250 ms) and RED (150 ms).
- Detection of inflammatory cytokine expression by reverse transcription quantitative PCR (RT-qPCR)
- Determine RNA concentration and purity using a UV spectrophotometer.
- Use 1,000 ng of total RNA per reaction for reverse transcription to synthesize complementary DNA (cDNA) according to the manufacturer’s instructions.
- Perform RT-qPCR using 100 ng of cDNA per reaction as the template with a SYBR Green PCR master mix and gene-specific primers. Use the following cycling conditions: 95 °C for 2 min, followed by 40 cycles of 95 °C for 5 s and 60 °C for 10 s. Primer sequences are listed in Table 1.
NOTE: Optimize reaction conditions according to the specific reagents and instruments used, and follow the corresponding manufacturer’s instructions. - Use GAPDH as the internal reference gene and calculate relative gene expression levels using the 2−ΔΔCt method.
7. Detection of pro-inflammatory cytokines in lung tissue by enzyme-linked immunosorbent assay (ELISA)24
NOTE: Use ELISA kits according to the specific protocols provided by different manufacturers. Follow the corresponding manufacturer’s instructions strictly when using kits from alternative suppliers.
- Homogenize lung tissue as described above. Use PBS or ELISA-specific tissue lysis buffer as the homogenization medium.
- Centrifuge the homogenized samples (e.g., 12,000 x g, 4 °C, 10 min) and collect the supernatant for subsequent analysis.
- Equilibrate the ELISA kit to room temperature for 30 min before use. Remove the required microplate strips from the aluminum foil pouch.
- Prepare standards, sample wells, and blank wells according to the manufacturer's instructions. Add 50 µL of standards to the standard wells and 10 µL of sample plus 40 µL of sample dilution buffer to the sample wells. Perform two technical replicates for each standard and sample.
- Add 100 µL of horseradish peroxidase (HRP)-conjugated detection antibody to each standard and sample well, except for the blank wells. Seal the plate with adhesive film and incubate at 37 °C for 60 min.
- Discard the liquid from each well after incubation and tap the plate gently on absorbent paper to remove residual fluid.
- Add washing buffer to each well, allow it to stand for 1 min, and then discard the buffer. Blot the plate dry. Repeat this washing step five times in total.
- Add 50 µL of substrate solution A and 50 µL of substrate solution B sequentially to each well. Mix the plate gently and incubate it at 37 °C in the dark for 15 min to allow color development.
- Terminate the reaction by adding 50 µL of stop solution to each well. Measure the optical density (OD) within 10 min at 450 nm using a microplate reader.
- Generate a standard curve by plotting standard concentrations (x-axis) against OD values (y-axis), and fit the curve. Calculate the concentrations of target cytokines in the samples by substituting OD values into the standard curve equation and multiply by the corresponding dilution factors.
- Determine the total protein concentration in lung tissue using a BCA protein assay kit. Normalize the final cytokine levels to total protein content and express the results as the amount of target cytokine per milligram of total protein (e.g., pg/mg protein).
Results
Model validation was performed by assessing pulmonary histopathological changes, SARS-CoV-2 viral load, and the levels of pro-inflammatory cytokines and type I interferons in both the control and model groups.
Statistical analysis
Data are presented as mean ± standard error (SE). An unpaired Student’s t-test was used for comparisons between the model and control groups. This test was selected because it is appropriate for comparing the means of continuous variables between two independent groups. In this study, mice were independently and randomly assigned to the two groups, satisfying the assumption of sample independence. A p-value < 0.05 was considered statistically significant.
Changes in body weight and lung index of mice
As shown in Figure 1B, compared with baseline values prior to modeling, the body weight of mice in the model group was significantly reduced after infection, with a statistically significant difference (p < 0.05). As shown in Figure 1C, the lung index of mice in the model group was significantly increased compared with that of the control group (p < 0.01), consistent with characteristic features of lung injury. No mortality was observed during the experimental period, and all mice survived until the endpoint.
Histopathological changes in lung tissue and SARS-CoV-2 viral load of mice
Figure 2 presents the histopathological alterations and viral load in the lung tissues of mice from both groups. HE staining showed that the control group exhibited intact lung architecture, whereas the model group displayed substantial pulmonary pathological changes, including alveolar septal thickening, inflammatory cell infiltration, and alveolar structural disruption (Figure 2A). Quantitative analysis further confirmed that both the lung injury score and alveolar inflammation score were significantly increased in the model group compared with the control group (p < 0.001), demonstrating the successful induction of lung injury and inflammatory responses (Figure 2B,C).
In addition, a substantial level of SARS-CoV-2 RNA expression was detected in lung tissues of the model group. On day 3 post-infection, the average viral load in lung tissue reached 5.5 x 10⁸ copies/g (Figure 2D), indicating successful viral replication and sustained high-level presence in the lung.
Changes in pro-inflammatory cytokines and IFN-I in mouse lung tissue
Figure 3 illustrates the changes in inflammatory cytokines and IFN-I in mouse lung tissue. The results showed that, compared with the control group, the mRNA expression and protein levels of IL-6, IL-1β, and TNF-α in the lung tissue of the model group were significantly increased (p < 0.05) (Figure 3A–F), indicating a marked activation of the inflammatory response. In contrast, ELISA results demonstrated that the levels of IFN-α and IFN-β in the lung tissue of the model group were significantly decreased compared with those in the control group (p < 0.001) (Figure 3G,H), suggesting suppression of the antiviral immune response.
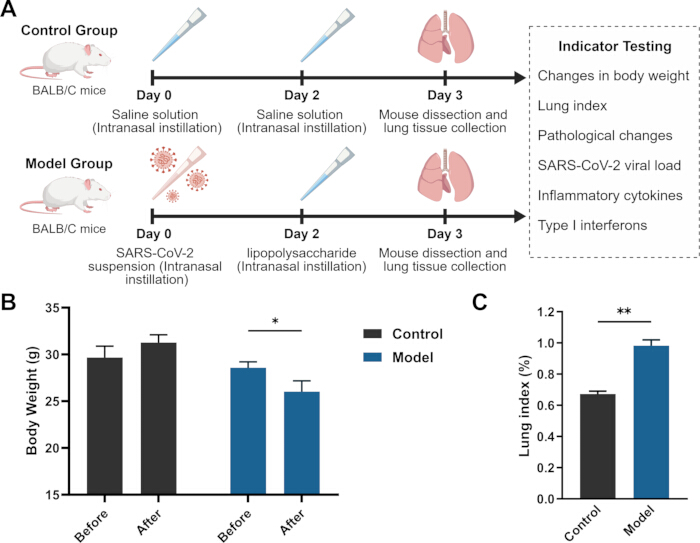
Figure 1: Experimental flowchart and changes in body weight and lung index of mice. (A) Experimental flowchart. (B) Changes in body weight of mice. (C) Changes in lung index of mice. Data are shown as mean ± SE for each group. Student's t-test was used to assess statistical differences between groups. *p < 0.05; **p < 0.01; ***p < 0.001. Figure 1A was created with BioGDP.com25. Please click here to view a larger version of this figure.
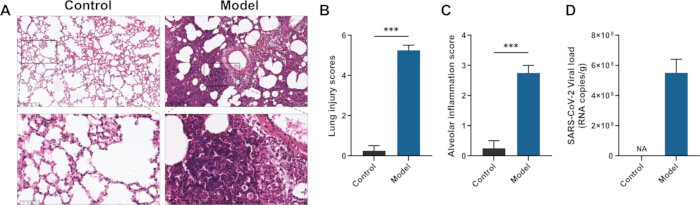
Figure 2: Histopathological changes and SARS-CoV-2 viral load in mouse lung tissue. (A) HE staining of mouse lung tissue. (B) Lung injury score (Smith score). (C) Alveolar inflammation score (Szapiel score). (D) SARS-CoV-2 viral load in lung tissue. Data are shown as mean ± SE for each group. Student’s t-test was used to assess statistical differences between groups. *p < 0.05; **p < 0.01; ***p < 0.001. Please click here to view a larger version of this figure.
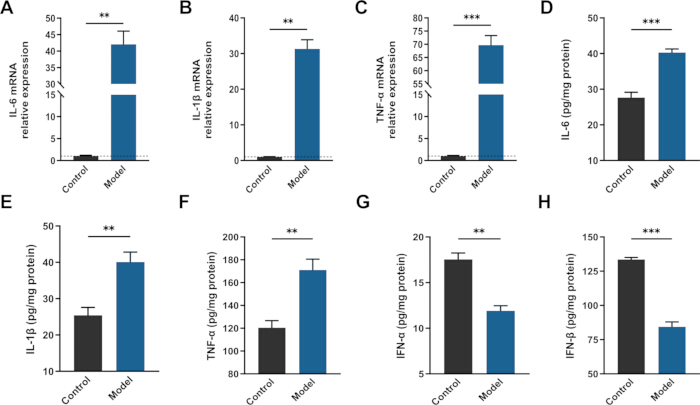
Figure 3: Changes in pro-inflammatory cytokines and IFN-I in mouse lung tissue. (A–C) Relative mRNA expression of the pro-inflammatory cytokines IL-6, IL-1β, and TNF-α in mouse lung tissue. (D–F) Protein levels of IL-6, IL-1β, and TNF-α in mouse lung tissue. (G–H) Levels of IFN-α and IFN-β in mouse lung tissue. Data are shown as mean ± SE for each group. Student’s t-test was used to assess statistical differences between groups. *p < 0.05; **p < 0.01; ***p < 0.001. Please click here to view a larger version of this figure.
| Primer | Forward sequence (5’ to 3’) | Reverse sequence (5’ to 3’) |
| IL-6 | CTTCTTGGGACTGATGCTGGTGAC | AGGTCTGTTGGGAGTGGTATCCTC |
| IL-1β | TCGCAGCAGCACATCAACAAGAG | AGGTCCACGGGAAAGACACAGG |
| TNF-α | GCCTCTTCTCATTCCTGCTTGTGG | GTGGTTTGTGAGTGTGAGGGTCTG |
| GAPDH | GGCAAATTCAACGGCACAGTCAAG | TCGCTCCTGGAAGATGGTGATGG |
Table 1: Primer sequences used in this study. Forward and reverse primer sequences (5′ to 3′) for the target and internal reference genes are listed.
Supplementary File 1 Please click here to download this file.
Supplementary File 2 Please click here to download this file.
Supplementary File 3 Please click here to download this file.
Discussion
This study established a murine model of COVID-19-associated lung injury via intranasal instillation of SARS-CoV-2 and LPS. The results demonstrated that intranasal co-administration of SARS-CoV-2 and LPS induces a robust inflammatory response accompanied by suppression of IFN-I signaling. Mice in the model group exhibited significant body weight loss and increased lung index, indicating systemic wasting and aggravated pulmonary injury. HE staining further confirmed that the model group exhibited typical diffuse lung injury, characterized by disruption of alveolar architecture and extensive inflammatory cell infiltration. In addition, compared with the control group, lung tissues from the model group showed significantly increased expression of key pro-inflammatory cytokines, including IL-6, IL-1β, and TNF-α, whereas the levels of IFN-α and IFN-β were markedly decreased. These findings suggest a state of immune imbalance characterized by excessive activation of pro-inflammatory responses accompanied by suppressed antiviral immunity, further supporting the potential value of this model in recapitulating the immunopathological features of disease.
SARS-CoV-2 infection is considered a central driving factor in the development of COVID-19-associated organ damage26,27. In this study, a high viral load was detected in the lung tissues of model mice, accompanied by marked diffuse lung injury and inflammatory cell infiltration, suggesting that viral infection may be a key trigger of the pulmonary inflammatory response. Consistent with previous reports, SARS-CoV-2 infection can induce pulmonary pathological changes and immune activation28; however, conventional SARS-CoV-2 infection models in mice often exhibit limited inflammatory responses and may not fully reproduce the hyperinflammatory phenotype observed in COVID-19 patients18,19,20. Therefore, additional innate immune stimulation may be required to better investigate the mechanisms underlying immune-inflammatory dysregulation associated with disease. LPS, a prototypical activator of innate immunity, binds to Toll-like receptor 4 (TLR4) and triggers both MyD88-dependent and TRIF-dependent signaling pathways, thereby activating key inflammatory transcriptional programs such as NF-κB and inducing the expression of multiple pro-inflammatory cytokines29. Previous studies have also demonstrated that LPS stimulation, either alone or in combination with SARS-CoV-2-related components, can enhance inflammatory responses and contribute to acute lung injury-like phenotypes, supporting the rationale for incorporating LPS as an inflammatory stimulus in COVID-19-related research30,31,32. In the present study, significantly elevated levels of IL-6, IL-1β, and TNF-α were observed in lung tissues of the model group, suggesting that LPS functions as an inflammatory amplifier in the context of SARS-CoV-2 infection rather than simply representing bacterial coinfection. Compared with LPS-only inflammatory models, which lack the viral infection background, the combined model established in this study integrates SARS-CoV-2-induced immune alterations with LPS-mediated inflammatory activation, thereby providing a more comprehensive platform for studying COVID-19-associated lung injury.
IFN-I are key effector molecules of host antiviral immunity and exert broad antiviral functions by inducing a wide range of interferon-stimulated genes (ISGs)33. However, SARS-CoV-2 has been demonstrated to antagonize IFN-I signaling through multiple mechanisms, including interference with pattern recognition receptor (PRR)-mediated signal transduction, suppression of interferon regulatory factor (IRF) activation, and blockade of downstream JAK-STAT signaling, thereby impairing host antiviral defenses14,34. In this study, significantly reduced levels of IFN-α and IFN-β were observed in the lung tissues of the model group, indicating that under the synergistic effects of viral infection and LPS stimulation, the host not only exhibited excessive inflammatory activation but also concomitant suppression of antiviral immunity. Such immune dysregulation is considered one of the key immunological hallmarks in the development and progression of COVID-198. Therefore, the present model partially recapitulates this complex pathological process, providing a valuable experimental tool for further investigation of COVID-19-associated immune dysregulation and for the development of related therapeutic interventions.
The COVID-19 mouse model established in this study based on combined SARS-CoV-2 and LPS administration is capable of recapitulating key features of disease pathology, including elevated pro-inflammatory cytokines and suppression of IFN-I signaling, thereby partially mimicking the immune imbalance observed in COVID-19-associated lung injury. Compared with single viral infection models, this combined approach incorporates an exogenous innate immune stimulus to enhance disease-relevant inflammatory responses, thereby enabling the study of pathological processes associated with excessive inflammation and impaired antiviral immunity. Accordingly, this model may be valuable for evaluating candidate anti-inflammatory, immunomodulatory, and lung repair strategies in vivo, particularly those targeting immune dysregulation rather than viral replication alone.
However, several limitations of this study should be acknowledged. First, LPS induces inflammation primarily through TLR4 activation, which does not fully reflect the complex virus–host interactions in clinical COVID-19 and may alter the inflammatory response. Second, although comparative experiments with SARS-CoV-2-only and LPS-only groups were performed during the preliminary optimization phase, these data are not included in the manuscript. Future studies will further evaluate the individual and combined effects of SARS-CoV-2 and LPS to better define the contribution of each component. Third, this model is designed to reproduce key immunopathological features of COVID-19-associated lung injury, particularly immune-inflammatory dysregulation, rather than the complete natural course of SARS-CoV-2 infection. Finally, although the SARS-CoV-2 dose and LPS concentration were determined based on preliminary optimization experiments, variations in mouse strains, viral variants, testing methods, and experimental conditions may affect model reproducibility and require further validation across different research settings. Under the optimized conditions described in this protocol, the overall model establishment success rate was approximately 90%; however, this rate may vary among different experimental settings. Future studies could further optimize this model by incorporating different SARS-CoV-2 variants, genetically modified mouse strains, or advanced immune profiling approaches, such as single-cell transcriptomic analysis, to better characterize virus–host interactions and identify therapeutic targets. These efforts may further improve the translational relevance of this model for COVID-19 research.
Disclosures
The authors have no conflicts of interest to disclose.
Acknowledgements
This research was supported by The National Natural Science Foundation of China (82374291); Sichuan Science and Technology Program (2024NSFJQ0059); Special subject of scientific research of Sichuan Administration of Traditional Chinese Medicine (2024zd005); 2022 “Tianfu Qingcheng Plan” Tianfu Science and Technology Leading Talents Project (Chuan Qingcheng No. 1090); Joint Innovation Fund of Health Commission of Chengdu and Chengdu University of Traditional Chinese Medicine (WXLH202403091).
Materials
| Name | Company | Catalog Number | Comments |
|---|---|---|---|
| Automated Tissue Processor | Dakewe Biotech Co., Ltd. | HP300 | Used for tissue dehydration. |
| Autostainer | Leica Biosystems | LEICA ST5010 | Used for HE staining. |
| Centrifuge | DLAB Scientific | D3024R | Used for centrifuging samples or reagents. |
| Constant-Temperature Water Bath | Shanghai LICHEN-BX Instrument Techonology Co., Ltd. | HH-6 | Used for constant-temperature water baths. |
| Digital PCR System | QIAGEN | QIAcuity One | Used for RT-dPCR. |
| TransScript All-in-One First-Strand cDNA Synthesis SuperMix for qPCR (One-Step gDNA Removal) | TransGen Biotech Co.,Ltd. | AT341 | Used for reverse transcription. |
| Eosin Solution | BASO | BA4024 | Used for histological staining. |
| Fluorescent Quantitative PCR System | Rocgene (Beijing) Technology Co., Ltd. | Archimed X6 | Used for RT-qPCR. |
| Hematoxylin Solution | BASO | BA4041 | Used for histological staining. |
| IBM SPSS Statistics software | IBM Corp., Armonk, NY, USA | version 22.0 | Used for statistical analysis. |
| Lipopolysaccharides from Escherichia coli O55:B5 | Sigma-Aldrich (Shanghai) Trading Co., Ltd. | L2880 | Used for mouse modeling. |
| Microplate Reader | Molecular Devices | SpectraMax Plus 384 | Used for Elisa. |
| Mouse IFN-α ELISA KIT | ZCIBIO Technology Co., Ltd. | ZC-37863W | Used to detect IFN-α levels in mice lung tissue. |
| Mouse IFN-β ELISA KIT | ZCIBIO Technology Co., Ltd. | ZC-37887W | Used to detect IFN-β levels in mice lung tissue. |
| Mouse IL-1β ELISA KIT | ZCIBIO Technology Co., Ltd. | ZC-37974W | Used to detect IL-1β levels in mice lung tissue. |
| Mouse IL-6 ELISA KIT | ZCIBIO Technology Co., Ltd. | ZC-37988W | Used to detect IL-6 levels in mice lung tissue. |
| Mouse TNF-α ELISA KIT | ZCIBIO Technology Co., Ltd. | ZC-39024W | Used to detect TNF-α levels in mice lung tissue. |
| One-Step RT-PCR Kit for Digital PCR | QIAGEN | 4829104 | Used for digital PCR. |
| Paraffin Embedding Machine | Hubei Aristion Medical Industrial Co., Ltd. | ABM-7L | Used for paraffin embedding of mouse lung tissue. |
| QuantiNova SYBR PCR Mix Kit | QIAGEN | 1129280 | Used for RT-qPCR. |
| RNeasy Plus Universal Mini Kit | QIAGEN | 1062832 | Used for total RNA extraction. |
| Slicer | Leica Biosystems | LEICA RM2235 | Used for paraffin sections. |
| Stainless Steel Beads for Tissue Homogenizer | Beyotime Biotechnology | F6621 | Used for homogenizing lung tissue. |
| XG primer Pool 1.0 for Digital PCR | QIAGEN | 4828104 | Used for digital PCR. |
| Zoletil 50 | VIRBAC | BN9VS7A | Used for anesthetizing mice. |
References
- Zhang X, et al. SARS-CoV-2 Evolution: Immune Dynamics, Omicron Specificity, and Predictive Modeling in Vaccinated Populations. Adv Sci (Weinh). 2024;11(40):e2402639.
- Yu Y, et al. COVID-19 Serum Drives Spike-Mediated SARS-CoV-2 Variation. Viruses. 2024;16(5):763.
- Alhamlan FS, Al-Qahtani AA. SARS-CoV-2 Variants: Genetic Insights, Epidemiological Tracking, and Implications for Vaccine Strategies. Int J Mol Sci. 2025;26(3):1263.
- Habashi NM, Camporota L, Gatto LA, Nieman G. Functional pathophysiology of SARS-CoV-2-induced acute lung injury and clinical implications. J Appl Physiol (1985). 2021;130(3):877-891.
- Nie X, et al. Multi-organ proteomic landscape of COVID-19 autopsies. Cell. 2021;184(3):775-791.e14.
- Blanco-Melo D, et al. Imbalanced Host Response to SARS-CoV-2 Drives Development of COVID-19. Cell. 2020;181(5):1036-1045.e9.
- Wang J, Li Q, Qiu Y, Lu H. COVID-19: imbalanced cell-mediated immune response drives to immunopathology. Emerg Microbes Infect. 2022;11(1):2393-2404.
- Sa Ribero M, Jouvenet N, Dreux M, Nisole S. Interplay between SARS-CoV-2 and the type I interferon response. PLoS Pathog. 2020;16(7):e1008737.
- El-Saber Batiha G, Al-Gareeb AI, Saad HM, Al-Kuraishy HM. COVID-19 and corticosteroids: a narrative review. Inflammopharmacology. 2022;30(4):1189-1205.
- Ye Q, Wang B, Mao J. The pathogenesis and treatment of the 'Cytokine Storm' in COVID-19. J Infect. 2020;80(6):607-613.
- Jiang Y, et al. Cytokine storm in COVID-19: from viral infection to immune responses, diagnosis and therapy. Int J Biol Sci. 2022;18(2):459-472.
- Zhang S, Wang L, Cheng G. The battle between host and SARS-CoV-2: Innate immunity and viral evasion strategies. Mol Ther. 2022;30(5):1869-1884.
- Beyer DK, Forero A. Mechanisms of Antiviral Immune Evasion of SARS-CoV-2. J Mol Biol. 2022;434(6):167265.
- Lei X, et al. Activation and evasion of type I interferon responses by SARS-CoV-2. Nat Commun. 2020;11(1):3810.
- Mostafa-Hedeab G, et al. A raising dawn of pentoxifylline in management of inflammatory disorders in Covid-19. Inflammopharmacology. 2022;30(3):799-809.
- Chen Z, et al. SARS-CoV-2 immunity in animal models. Cell Mol Immunol. 2024;21(2):119-133.
- Johansen MD, et al. Animal and translational models of SARS-CoV-2 infection and COVID-19. Mucosal Immunol. 2020;13(6):877-891.
- Zhang Y, et al. SARS-CoV-2 rapidly adapts in aged BALB/c mice and induces typical pneumonia. J Virol. 2021;95(11):e02477-20.
- Sun SH, et al. A Mouse Model of SARS-CoV-2 Infection and Pathogenesis. Cell Host Microbe. 2020;28(1):124-133.e4.
- Muñoz-Fontela C, et al. Animal models for COVID-19. Nature. 2020;586(7830):509-515.
- Liu T, et al. Therapeutic potential of inosine in acute lung injury: mechanistic insights into TLR4 suppression and macrophage polarization. Phytomedicine. 2025;143:156854.
- Powers JM, et al. Divergent pathogenetic outcomes in BALB/c mice following Omicron subvariant infection. Virus Res. 2024;341:199319.
- Fan F, et al. Association between systemic immune-inflammation indexes and Nuodikang capsule's protection in LPS-induced acute lung injury in mice. Phytomedicine. 2025;147:157229.
- Xie N, et al. Rhodiola crenulate alleviates hypobaric hypoxia-induced brain injury via adjusting NF-κB/NLRP3-mediated inflammation. Phytomedicine. 2022;103:154240.
- Jiang S, et al. Generic Diagramming Platform (GDP): a comprehensive database of high-quality biomedical graphics. Nucleic Acids Res. 2025;53(D1):D1670-D1676.
- Onohuean H, et al. Covid-19 and development of heart failure: mystery and truth. Naunyn Schmiedebergs Arch Pharmacol. 2021;394(10):2013-2021.
- Zarrilli G, et al. The Immunopathological and Histological Landscape of COVID-19-Mediated Lung Injury. Int J Mol Sci. 2021;22(2):974.
- Fernandes de Souza WD, et al. Lung Inflammation Induced by Inactivated SARS-CoV-2 in C57BL/6 Female Mice Is Controlled by Intranasal Instillation of Vitamin D. Cells. 2023;12(7):1092.
- Ciesielska A, Matyjek M, Kwiatkowska K. TLR4 and CD14 trafficking and its influence on LPS-induced pro-inflammatory signaling. Cell Mol Life Sci. 2021;78(4):1233-1261.
- Brandenburg K, et al. A Comparison between SARS-CoV-2 and Gram-Negative Bacteria-Induced Hyperinflammation and Sepsis. Int J Mol Sci. 2023;24(20):15169.
- Samsudin F, et al. SARS-CoV-2 spike protein as a bacterial lipopolysaccharide delivery system in an overzealous inflammatory cascade. J Mol Cell Biol. 2023;14(9):mjac058.
- Petruk G, et al. SARS-CoV-2 spike protein binds to bacterial lipopolysaccharide and boosts proinflammatory activity. J Mol Cell Biol. 2020;12(12):916-932.
- Martin-Sancho L, et al. Functional landscape of SARS-CoV-2 cellular restriction. Mol Cell. 2021;81(12):2656-2668.e8.
- Minkoff JM, tenOever B. Innate immune evasion strategies of SARS-CoV-2. Nat Rev Microbiol. 2023;21(3):178-194.