A time-resolved FRET assay monitors Mpro substrate cleavage kinetics to assess whether PROTACs affect enzymatic activity, enabling functional separation of degradation and inhibitory effects.
Method Article
A Time-Resolved FRET Activity Assay to Distinguish Enzymatic Inhibition from PROTAC-Mediated Degradation of SARS-CoV-2 Mpro
In This Article
Summary
Abstract
Proteolysis-targeting chimeras (PROTACs) are emerging as a promising strategy for antiviral drug development and are mechanistically distinct from classical small-molecule inhibitors. Many PROTAC designs targeting viral proteases, such as the SARS-CoV-2 main protease (Mpro), employ warheads derived from active-site inhibitors, thereby combining proximity-induced degradation with potential enzymatic inhibition. This dual functionality complicates the experimental distinction between degradation-driven effects and direct inhibition of catalytic activity on viral replication. To address this, we established a fluorescence resonance energy transfer (FRET)-based assay to quantify the catalytic activity of recombinant Mpro in the presence of inhibitors and degraders. The assay employs a quenched fluorogenic peptide substrate (MI-2822) containing the canonical Mpro cleavage sequence, flanked by a fluorophore and a quencher. Proteolytic cleavage results in a time-dependent increase in fluorescence, enabling continuous kinetic monitoring of enzyme activity. Recombinant Mpro expressed in Escherichia coli is purified and incubated with the FRET substrate under defined buffer conditions, and fluorescence is recorded over time to derive enzymatic activity profiles. The assay is controlled using the clinically approved active-site inhibitor nirmatrelvir, which efficiently suppresses substrate cleavage. In contrast, PROTACs targeting Mpro outside the catalytic cleft do not substantially reduce the fluorescence increase, indicating that they do not measurably inhibit enzymatic activity under the tested conditions. This protocol provides a robust and reproducible approach to distinguish between enzymatic inhibition and degradation-associated mechanisms. It is broadly applicable for the mechanistic characterization of PROTACs and other bifunctional molecules targeting viral proteases.
Introduction
Targeted protein degradation (TPD) leverages the cellular ubiquitin–proteasome system (UPS) to selectively eliminate proteins of interest. This strategy is based on heterobifunctional molecules, commonly referred to as proteolysis-targeting chimeras (PROTACs), which simultaneously bind a target protein and an E3 ubiquitin ligase2. E3 ubiquitin ligases represent a large and diverse class of cellular enzymes3that catalyze the ubiquitination of substrate proteins, thereby marking them for proteasomal degradation4.
PROTACs consist of a ligand for the target protein and a ligand for an E3 ligase, connected via a chemical linker5. By inducing proximity between the target protein and the E3 ligase, PROTACs promote the formation of a ternary complex that enables ubiquitin transfer and subsequent degradation of the target protein by the proteasome6,7. Compared to classical small-molecule inhibitors, this approach offers several advantages8. PROTACs can act catalytically, allowing efficient target depletion at lower concentrations, and they can exploit existing ligands or inhibitors as targeting moieties5. Furthermore, degradation-based strategies may retain efficacy in the presence of resistance-conferring mutations9,10and can be applied to proteins that are difficult to inhibit directly, such as those lacking well-defined binding pockets11.
In the context of antiviral drug development, many reported PROTACs targeting viral proteins rely on warheads derived from active-site inhibitors10,12,13,14. As a result, these molecules often combine enzymatic inhibition with degradation-driven target depletion, complicating the mechanistic interpretation of antiviral activity. While cellular antiviral assays integrate the combined outcome of multiple processes, including target degradation and inhibition of viral replication, they often do not allow a clear distinction between inhibition-driven and degradation-driven effects. In addition, many viral proteins lack clearly defined binding pockets or catalytic sites, which limits their accessibility to current PROTAC design strategies.
To address this challenge, we developed a fluorescence resonance energy transfer (FRET)-based assay using a SARS-CoV-2 Mpro peptide substrate, enabling time-resolved monitoring of enzymatic activity. This approach allows discrimination between PROTAC-associated effects and direct enzymatic inhibition. Using this assay, we evaluated an Mpro-targeting degrader that binds outside the catalytic cleft and does not measurably interfere with protease activity under the conditions tested, while retaining its degradative capability. In parallel, the clinically approved Mpro inhibitor nirmatrelvir was used as a control and resulted in a pronounced reduction of enzymatic activity.
In summary, this assay provides a robust method to distinguish between enzymatic inhibition and degradation-related effects. It is particularly valuable for characterizing degraders targeting enzymatically active proteins, in which disentangling these mechanisms is essential to understanding their antiviral activity (Figure 1).
Protocol
1. Materials preparation
- Prepare the expression system
- Use Escherichia coli BL21 Rosetta2 chemically competent cells as the expression host.
- Use a pET28a(+) expression vector encoding SARS-CoV-2 Mpro with 6× histidine tags at the N- and C-termini.
- Prepare the growth medium
- Prepare 5 L of Luria–Bertani (LB) medium by dissolving 10 g/L tryptone, 5 g/L yeast extract, and 10 g/L sodium chloride (NaCl) in distilled water. Sterilize the medium by autoclaving at 121 °C for 20 min.
- Prepare the IPTG stock solution
- Dissolve 4.20 g of IPTG in 45 mL of distilled water to prepare a 0.4 M stock solution. Store the stock solution at −20 °C.
- Prepare the buffers
- Prepare 1 L of Mpro lysis buffer (MLB) containing 50 mM Tris, 300 mM NaCl, 5% glycerol, and 0.5% Triton X-100 (pH 7.5).
- Prepare 4 L of Mpro protein buffer (MB) containing 20 mM Tris and 150 mM NaCl (pH 7.5).
- Prepare 500 mL of wash buffer (WB) containing 20 mM Tris, 150 mM NaCl, and 20 mM imidazole (pH 7.5).
- Prepare 100 mL each of Elution Buffer 1 (100 mM imidazole), Elution Buffer 2 (250 mM imidazole), and Elution Buffer 3 (500 mM imidazole), each containing 20 mM Tris and 150 mM NaCl (pH 7.5).
- Prepare 1 mL of 4× sample buffer containing mercaptoethanol, bromophenol blue, glycerol, Tris (pH 6.8), sodium dodecyl sulfate (SDS), and distilled water.
- Prepare 1 L of phosphate-buffered saline (PBS) containing KCl, KH₂PO₄, Na₂HPO₄, and NaCl in distilled water.
2. Mpro expression in Escherichia coli
- Transform the expression plasmid into E. coli
- Prepare chemically competent E. coli Rosetta2 cells using a commercial transformation kit. Inoculate 5 mL of super optimal broth (SOB) medium and incubate the culture overnight at 37 °C with shaking.
- Transfer the overnight culture into 100 mL of SOB medium and grow the cells to an OD600 of 0.4–0.5. Cool the culture on ice and centrifuge at 1,800 × g for 5 min.
- Wash the cell pellet twice with washing buffer and resuspend it in competent buffer. Aliquot 50 µL of competent cells and store them at −70 °C.
- Transform the expression plasmid into chemically competent bacteria
- Thaw one aliquot of competent cells on ice for 10 min. Add 1 µL of plasmid DNA (<50 ng) and mix gently.
- Incubate the cells on ice for 30 min. Plate the transformed cells on LB agar (1.5% agar) containing 100 µg/mL kanamycin and incubate the plates overnight (ca. 18 h) at 37 °C.
- Expand the bacterial culture
- Inoculate 5 mL of LB medium containing 100 µg/mL kanamycin with a single colony. Incubate the culture overnight at 37 °C with shaking at 200 rpm.
- Transfer the overnight culture into 100 mL of LB medium containing 100 µg/mL kanamycin. Incubate the culture overnight under the same conditions.
- Transfer 35 mL of the overnight culture into 1 L of LB medium containing 100 µg/mL kanamycin. Incubate the culture at 37 °C with shaking at 140 rpm until the OD600 reaches 1.0–1.2.
- Induce Mpro expression
- Cool the culture to 16 °C. Add 1 mL of 0.4 M IPTG (0.4 mM final concentration) to induce protein expression.
- Incubate the culture at 16 °C with shaking at 140 rpm for 72 h.
3. Harvest and purify Mpro
- Harvest the bacterial cells
- Centrifuge the culture at 5,000 × g and 4 °C for 1 h. Discard the supernatant and resuspend the pellet in 35 mL of phosphate-buffered saline (PBS).
NOTE: Ensure complete resuspension of the pellet to maximize protein recovery during downstream purification. - Transfer the suspension to a 50 mL centrifuge tube and centrifuge at 6,800 × g and 4 °C for 10 min. Discard the supernatant and store the cell pellet at −20 °C.
- Centrifuge the culture at 5,000 × g and 4 °C for 1 h. Discard the supernatant and resuspend the pellet in 35 mL of phosphate-buffered saline (PBS).
- Lyse the cells
- Thaw the cell pellet on ice for 15–30 min. Resuspend the pellet in 80 mL of Mpro lysis buffer (MLB) until homogeneous.
NOTE: Keep the buffer and sample on ice throughout this step to minimize protein degradation and aggregation. - Sonicate the suspension on ice for 10 min using 30 s pulses at 50–60% amplitude with 2 min cooling intervals between pulses.
- Transfer the lysate to centrifuge tubes and centrifuge at 60,000 × g and 4 °C for 1 h. Collect the clarified supernatant for affinity purification.
- Thaw the cell pellet on ice for 15–30 min. Resuspend the pellet in 80 mL of Mpro lysis buffer (MLB) until homogeneous.
- Purify Mpro by immobilized metal affinity chromatography
- Equilibrate the affinity column with 10 column volumes (CV) of distilled water, followed by 10 CV of Mpro protein buffer (MB). Prepare the wash and elution buffers before loading the sample.
NOTE: Avoid introducing air bubbles into the column, as they may reduce binding efficiency. - Load the clarified lysate onto the equilibrated column at a low flow rate. Collect the flow-through.
NOTE: Maintain a sufficiently low flow rate to maximize binding of the His-tagged protein. - Wash the column with 50 mL of wash buffer (WB). Collect the final 2 mL of the wash fraction for quality assessment if required.
- Elute the bound protein sequentially with 6 mL of Elution Buffer 1 (three 2 mL fractions), 6 mL of Elution Buffer 2 (three 2 mL fractions), and 8 mL of Elution Buffer 3 (four 2 mL fractions). Keep all collected fractions on ice.
- Equilibrate the affinity column with 10 column volumes (CV) of distilled water, followed by 10 CV of Mpro protein buffer (MB). Prepare the wash and elution buffers before loading the sample.
- Regenerate the affinity column
- Wash the column sequentially with 10 CV of Elution Buffer 3, 10 CV of Mpro protein buffer, 10 CV of distilled water, and 10 CV of 20% ethanol.
- Assess protein quality
- Mix 45 µL of each protein sample with 15 µL of 4× sample buffer. Heat the samples at 100 °C for 10 min and briefly centrifuge them.
- Separate the samples on a 10–12% SDS-PAGE gel at 150 V until the dye front reaches the bottom of the gel.
- Stain the gel with Coomassie stain for 15–30 min. Rinse the gel with distilled water and assess protein purity (expected molecular weight: ca. 36 kDa).
4. Protein preparation
- Exchange the buffer and concentrate the protein
- Exchange the protein buffer to Mpro protein buffer (MB) using centrifugal filters (MWCO: 10 kDa). Concentrate the protein solution to a final volume of approximately 1 mL.
- Quantify the protein
- Measure the protein concentration using a spectrophotometer. Blank the instrument with MB before measurement.
- Calculate the protein concentration using the appropriate extinction coefficient (ε = 0.931).
5. Optimize the assay conditions
- Prepare the assay reagents
- Prepare a 3 µM stock solution of purified Mpro and a 300 µM stock solution of the peptide substrate in Mpro protein buffer (MB).
- Prepare serial dilutions
- Prepare six two-fold serial dilutions of the Mpro stock solution in MB.
- Prepare three two-fold serial dilutions of the peptide substrate in MB.
- Configure the plate reader
- Preheat the plate reader to 37 °C. Set the excitation wavelength to 320 nm, the emission wavelength to 420 nm (20 nm bandwidth), and the acquisition interval to 60 s for a total measurement time of 60 min.
NOTE: Prepare all assay components before adding the substrate, as the reaction begins immediately upon substrate addition.
- Preheat the plate reader to 37 °C. Set the excitation wavelength to 320 nm, the emission wavelength to 420 nm (20 nm bandwidth), and the acquisition interval to 60 s for a total measurement time of 60 min.
- Prepare the assay plate
- Add 25 µL of each Mpro dilution to columns 1–6 of a black 96-well plate. Add 25 µL of MB to column 7 as the no-enzyme control.
- Add 100 µL of MB to each well.
NOTE: Use black 96-well plates to minimize background fluorescence and optimize the fluorescence signal.
- Initiate the reaction
- Add 25 µL of the peptide substrate to rows A–C. Add 25 µL of MB to row D to serve as the no-substrate control.
- Start fluorescence acquisition immediately after adding the substrate.
- Analyze the data
- Export the fluorescence data and plot relative fluorescence units (RFU) as a function of time.
- Select the Mpro and substrate concentrations that provide a high signal-to-noise ratio without reaching early signal saturation (e.g., 500 nM Mpro and 50 µM substrate).
- Determine kinetic parameters (optional)
- Determine the kinetic parameters of the fluorogenic substrate by fitting the initial reaction velocities to the Michaelis–Menten equation. Convert fluorescence units to product concentration using a calibration curve generated with 2-amino-N-(3-aminopropyl) benzamide. Detailed synthesis of the calibration fluorophore is provided in Supplementary File 1.
6. Perform the FRET assay
- Prepare the plate reader
- Preheat the plate reader to 37 °C. Set the excitation wavelength to 320 nm, the emission wavelength to 420 nm (20 nm bandwidth), and the acquisition interval to 60 s for a total measurement time of 60 min.
- Prepare the assay reagents
- Prepare stock solutions of purified Mpro (3 µM), peptide substrate (300 µM), and the test compounds in Mpro protein buffer (MB).
- Prepare serial dilutions of each test compound in DMSO while maintaining a constant final DMSO concentration in all samples. Include DMSO-only and buffer-only controls.
- Prepare the reaction mixtures
- Dilute each test compound or control in 100 µL of MB. Add 25 µL of Mpro to achieve a final enzyme concentration of 500 nM.
- Immediately transfer the reaction mixtures to the wells of a black 96-well plate.
- Initiate the reaction
- Add 25 µL of peptide substrate to each well to achieve a final substrate concentration of 50 µM (final reaction volume: 150 µL).
- Start fluorescence acquisition immediately after substrate addition.
NOTE: Begin data acquisition immediately after adding the substrate to ensure accurate measurement of the initial reaction kinetics.
- Acquire the fluorescence data
- Record fluorescence continuously for 60 min using the predefined acquisition settings.
Results
Successful implementation of the time-resolved fluorescence resonance energy transfer (TR-FRET) assay requires optimization of the enzyme-to-substrate ratio. As described in the protocol, this can be achieved by titrating both components. In this study, enzyme concentrations ranging from 15.6 to 500 nM were tested in combination with substrate concentrations ranging from 12.5 to 50 µM. Control reactions lacking either the substrate or the enzyme were included. In a separate experiment, the Michaelis–Menten constant (KM) was determined to be 29.2 ± 6.1 µM (Supplementary Figure 1).
The results demonstrate that enzyme concentration primarily determines substrate turnover, whereas substrate concentration mainly influences fluorescence signal intensity. Increasing substrate concentrations resulted in higher initial fluorescence signals (t = 0). For example, baseline fluorescence ranged from approximately 400 to 500 RFU in Figure 2A, whereas lower substrate concentrations produced lower baseline fluorescence values (Figure 2B,C). In the absence of substrate (Figure 2D), only background fluorescence, typically below 20 RFU, was detected.
Increasing enzyme concentrations resulted in greater substrate turnover and improved signal-to-noise ratios (Figure 2A). At the highest enzyme concentration, the reaction approached a plateau after approximately 50 min, indicating near-complete substrate turnover. The plateau was reached earlier at lower substrate concentrations and later at higher substrate concentrations. In contrast, lower enzyme concentrations did not reach saturation within the 60 min measurement period and maintained an approximately linear increase in fluorescence.
Based on these observations, optimal assay conditions should meet the following criteria: (1) minimal background fluorescence in the no-substrate control; (2) stable baseline fluorescence without substrate turnover in the no-enzyme control; (3) an enzyme-to-substrate ratio that provides an adequate signal-to-noise ratio for quantitative analysis; and (4) fluorescence signals that approach a plateau by the end of the measurement period. Based on these criteria, an enzyme concentration of 500 nM and a substrate concentration of 50 µM were selected for subsequent experiments.
To further characterize the fluorogenic substrate, enzyme kinetic parameters were determined under standard assay conditions using eight substrate concentrations (0.39–50 µM) and a fixed enzyme concentration (15.9 nM). Initial reaction velocities obtained from the fluorescence progress curves were fitted to the Michaelis–Menten equation (Supplementary Figure 1A,B). The substrate MI-2822 exhibited a KM of 29.2 ± 6.1 µM and a Vmax of 91.8 ± 14.2 RFU/s (n = 7). Using a calibration curve generated with 2-amino-N-(3-aminopropyl) benzamide (Supplementary Figure 1C), the kcat was calculated as 0.62 s⁻1, corresponding to a catalytic efficiency (kcat/KM) of 2.12 × 10⁴ s⁻1 M⁻1, approximately 30-fold higher than that reported for previously described ACC-based fluorogenic substrates. These kinetic data indicate efficient substrate recognition by SARS-CoV-2 Mpro and support the suitability of MI-2822 for sensitive fluorescence-based enzymatic assays.
The assay was performed using 500 nM Mpro and 50 µM substrate (Figure 3 and Figure 4). Nirmatrelvir was used as a reference inhibitor targeting the catalytic site (the "inhibitor"). In parallel, an Mpro-targeting PROTAC that binds outside the catalytic cleft (the "PROTAC") and a corresponding ligand lacking the E3 ligase-binding moiety (the "ligand") were evaluated. All compounds were tested at three concentrations to assess dose-dependent effects.
To control for solvent effects, all reactions contained a constant DMSO concentration (0.1%). Additional controls included a buffer-only control and a no-enzyme (mock) control.
The inhibitor is expected to reduce substrate turnover in a dose-dependent manner. In contrast, the PROTAC, which binds outside the catalytic site, is not expected to significantly affect enzymatic activity under cell-free conditions. Similarly, the ligand control is expected to have little or no effect on substrate turnover. The mock control should maintain baseline fluorescence throughout the experiment.
Consistent with expectations, DMSO had no measurable effect on enzyme activity compared with the buffer control (Figure 3A–C, black). Likewise, the mock control maintained a stable baseline fluorescence signal throughout the experiment (Figure 3A–C, magenta).
The inhibitor produced dose-dependent inhibition of Mpro activity (Figure 3A, red). At 10 µM, substrate turnover was markedly reduced, whereas lower concentrations produced progressively weaker inhibition. In contrast, both the PROTAC (Figure 3B, blue) and the ligand (Figure 3C, green) caused only minor reductions in substrate turnover. Because both compounds share the same warhead, their similar behavior is consistent with their binding properties. Importantly, neither compound significantly inhibited enzymatic activity under the conditions tested.
These findings are important for interpreting degradation-based antiviral activity. Because the PROTAC exhibited minimal inhibition of Mpro enzymatic activity, unlike the active-site inhibitor, any reduction in viral replication observed in cell-based assays is attributable primarily to protein degradation rather than direct enzymatic inhibition. This mechanistic distinction is essential for validating that antiviral activity is mediated through the intended degradation mechanism.
Reaction kinetics were further evaluated by calculating the area under the fluorescence-time curve (AUC; Figure 4), which provides a quantitative measure of cumulative substrate turnover (ΣRFU). The AUC was calculated as the sum of RFU values across all recorded time points.
This analysis confirmed that only the highest inhibitor concentration significantly reduced substrate turnover. The PROTAC produced only a minor dose-dependent effect, whereas the ligand had no measurable effect. The DMSO and buffer controls produced comparable results. The mock control showed a slight decrease in fluorescence over time, most likely due to fluorophore photobleaching.
Representative examples of failed or suboptimal reactions are shown in Figure 5 to illustrate potential assay limitations. Reliable assay performance depends on both the purity and the integrity of the enzyme preparation, which should be verified before interpreting the results.
Figure 5A illustrates a failed reaction in which either enzyme purity was insufficient or the concentration of active enzyme was too low to support substrate turnover. The initial fluorescence baseline (t = 0) exceeded 1,000 RFU, possibly due to inaccurate substrate preparation or impurities in the enzyme preparation that contribute to background fluorescence. Furthermore, no substrate turnover was observed under any experimental condition, suggesting either insufficient active enzyme or contamination that interfered with enzymatic activity.
A no-substrate control can be included to determine whether the enzyme preparation contributes to background fluorescence. Ideally, this signal should remain minimal. In the optimized assay (Figure 5B), background fluorescence remained below 20 RFU and was consistent across all enzyme concentrations, indicating that the enzyme preparation contributed negligibly to the background signal. Although interference with enzymatic activity cannot be completely excluded, a substantial contribution of the enzyme preparation to the elevated baseline fluorescence can be ruled out.
Substrate preparation is another critical determinant of assay performance. In this study, the peptide substrate was dissolved in protein buffer to maintain consistent assay conditions. During assay optimization, substrate solubility was evaluated in two protein buffers and in distilled water. Dissolving the substrate in distilled water reduced its solubility and promoted peptide aggregation. As these aggregates gradually dissolved during the assay, they produced abrupt increases in fluorescence, resulting in inaccurate estimates of effective substrate concentrations (Figure 5C, red). Therefore, use a solvent that maintains complete substrate solubility while preserving enzyme activity.
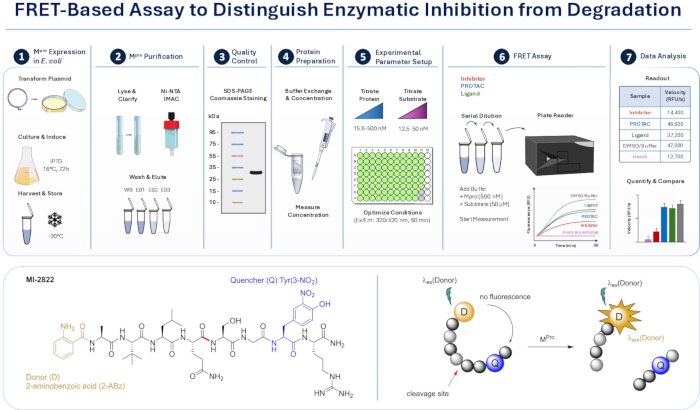
Figure 1: Overview of the FRET-based experiment and assay principle. The upper panel illustrates the experimental workflow, including recombinant Mpro expression in E. coli, purification by immobilized metal affinity chromatography, quality control, protein preparation, and optimization of assay conditions, followed by the FRET assay and data analysis. The lower panel depicts the assay principle: a quenched fluorogenic peptide substrate is cleaved by Mpro, resulting in separation of fluorophore and quencher and a corresponding increase in fluorescence signal. This setup enables kinetic monitoring of enzymatic activity and comparison of inhibitor-, PROTAC-, and ligand-treated conditions. Abbreviations: Mpro = main protease, E. coli = Escherichia coli, FRET = fluorescence resonance energy transfer, PROTAC = proteolysis-targeting chimera. Please click here to view a larger version of this figure.
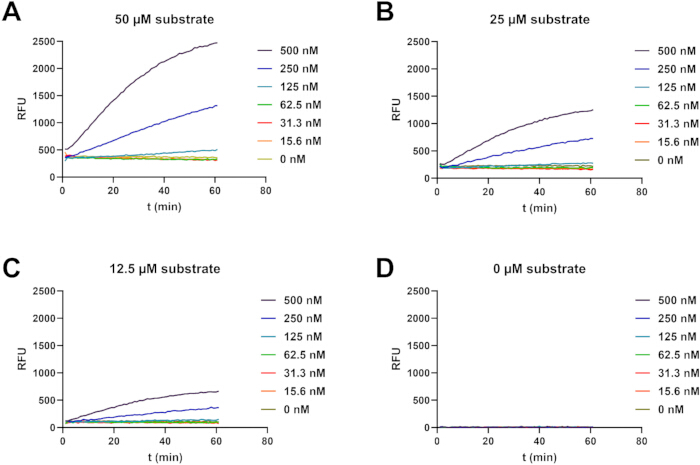
Figure 2: Protein and substrate titration. In a total reaction volume of 150 µL, a serial dilution of purified Mpro (15.6–500 nM) was combined with (A) 50 µM, (B) 25 µM, (C) 12.5 µM substrate, or (D) buffer (no-substrate control). Reactions were performed in black flat-bottom 96-well plates and monitored in a multimode microplate reader. Fluorescence was recorded every 60 s for 60 min (λex 320 nm, λem 420 nm). RFU is plotted over time. Abbreviations: Mpro = main protease, λex = excitation wavelength, λem = emission wavelength, RFU = relative fluorescence units. Please click here to view a larger version of this figure.
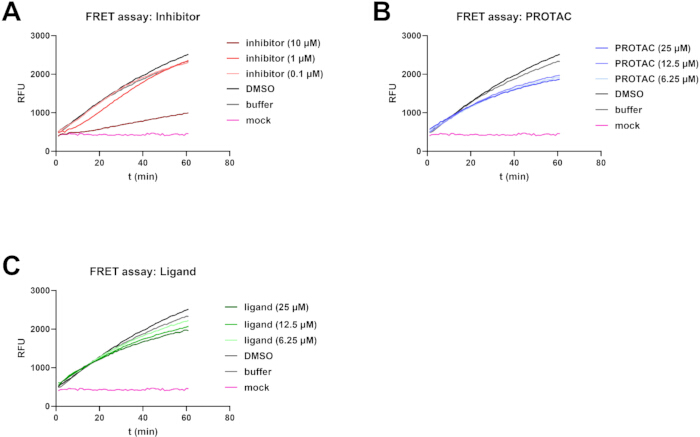
Figure 3: TR-FRET in the presence of Mpro inhibitor, PROTAC, and ligand. In a total reaction volume of 150 µL, 500 nM purified Mpro was incubated with 50 µM substrate in the presence of serial dilutions of (A) the active-site inhibitor nirmatrelvir, (B) an Mpro-targeting PROTAC, or (C) the corresponding ligand lacking the E3 ligase-binding moiety. Reactions were carried out in black flat-bottom 96-well plates and monitored in a multimode microplate reader. Fluorescence was recorded every 60 s for 60 min (λex 320 nm, λem 420 nm). RFU values are plotted over time. Abbreviations: Mpro = main protease, PROTAC = proteolysis-targeting chimera, λex = excitation wavelength, λem = emission wavelength. RFU = relative fluorescence units. Please click here to view a larger version of this figure.
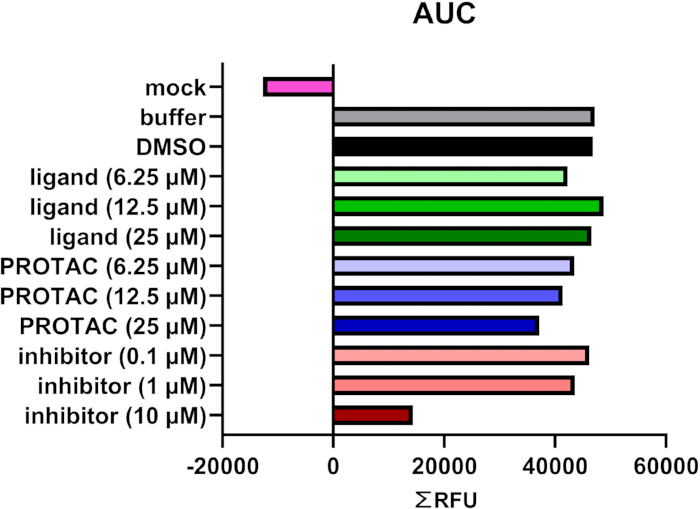
Figure 4: Integrated kinetics analysis of the TR-FRET assay. Integrated kinetics derived from the AUC (shown in Figure 3) are expressed as ΣRFU, which integrates all RFUs over 60 min. AUC values quantify substrate turnover and enable direct comparison of inhibitor-, PROTAC-, and ligand-treated conditions. Abbreviations: AUC = area under the curve, RFU = relative fluorescence units, PROTAC = proteolysis-targeting chimera. Please click here to view a larger version of this figure.
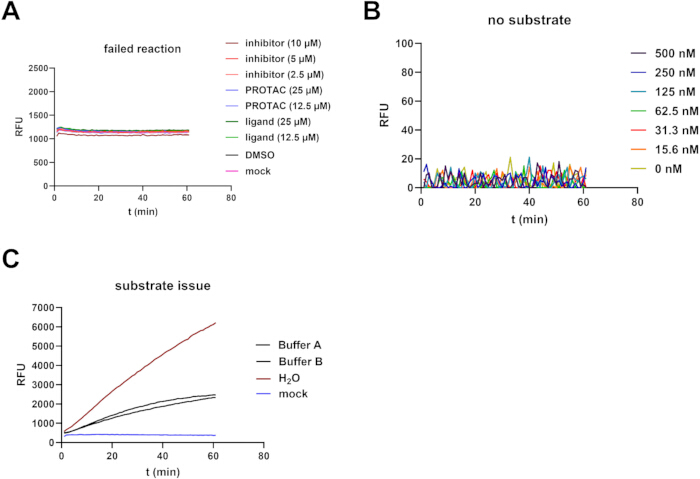
Figure 5: Exemplary results of failed reactions and control experiments. (A) TR-FRET assay performed as described in Figure 3, including serial dilutions of inhibitor, PROTAC, and ligand. The data show a failed reaction characterized by elevated baseline fluorescence and absence of substrate turnover across all conditions. (B) No-substrate control performed as described in Figure 2D. Background fluorescence remains low (<20 RFU) and constant across enzyme concentrations. (C) TR-FRET assay performed as described in Figure 3 using substrate dissolved in different solvents (protein buffers A and B or dH₂O). Poor solubility in dH₂O results in peptide aggregation, leading to irregular increases in fluorescence due to delayed substrate dissolution and inaccurate effective concentrations. Abbreviations: TR-FRET = time-resolved fluorescence resonance energy transfer, PROTAC = proteolysis-targeting chimera. Please click here to view a larger version of this figure.
Supplementary Figure 1: Enzyme kinetic analysis of the SARS-CoV-2 main protease (15.9 nM in assay) using substrate MI-2822. (A) Progress curves at substrate concentrations 50 µM (black), 25 µM (light green), 12.5 µM (blue), 6.25 µM (pink), 3.13 µM (dark green), 1.56 µM (dark blue), 0.78 µM (violet), and 0.39 µM (purple). (B) Fitting of the velocities to the Michaelis-Menten equation provided a KM of 29.2 ± 6.1 µM and a Vmax value of 91.8 ± 14.2 RFU/s (n = 7). (C) A calibration curve with fluorophore 2-amino-N-(3-aminopropyl) benzamide was used for calculating a kcat of 0.62 s-1 and a kcat/KM value of 2.12 × 10⁴ s-1 M-1.Please click here to download this file.
Supplementary File 1: Synthesis of 2-amino-N-(3-aminopropyl) benzamide. Detailed synthetic procedure and analytical characterization of 2-amino-N-(3-aminopropyl) benzamide, the water-soluble amide derivative of the fluorophore 2-aminobenzamide (2-Abz) used for fluorescence calibration in the enzyme kinetic assay.Please click here to download this file.
Discussion
In this work, we present a time-resolved fluorescence resonance energy transfer (TR-FRET)-based assay to assess the enzymatic activity of SARS-CoV-2 Mpro in the presence of inhibitors, proteolysis-targeting chimeras (PROTACs), and their corresponding ligands. The assay was developed to functionally distinguish between effects of a PROTAC arising exclusively from protein degradation and those resulting from direct inhibition of the target enzyme's catalytic activity. Using a fluorogenic peptide substrate, we demonstrate that an Mpro-targeting PROTAC that binds outside the catalytic cleft has only a minor effect on enzymatic activity, whereas the active-site inhibitor nirmatrelvir markedly suppresses substrate turnover.
Reliable assay performance depends on several critical factors, including the purity and activity of the recombinant enzyme, complete solubility and accurate preparation of the peptide substrate, and careful optimization of enzyme and substrate concentrations. Suboptimal enzyme quality or inaccurate substrate concentrations can increase background fluorescence or reduce detectable substrate turnover. Furthermore, enzyme activity measurements should begin immediately after substrate addition, and the plate reader should be temperature-equilibrated before initiating the assay to ensure consistent and reproducible kinetic measurements.
The assay can be readily adapted to different proteases15,16,17,18,19 or experimental configurations by optimizing enzyme and substrate concentrations to achieve the desired dynamic range. Appropriate controls, including no-enzyme, no-substrate, and solvent controls, are essential for identifying assay-related artifacts. Troubleshooting should focus on distinguishing technical artifacts from genuine effects on enzymatic activity by evaluating background fluorescence, confirming enzyme integrity and activity, and, when necessary, testing alternative substrate solvents. In particular, incomplete substrate solubility may lead to aggregation and irregular increases in fluorescence due to delayed substrate dissolution during the reaction.
Because this assay is performed in a biochemical, cell-free system, it does not capture degradation-dependent processes such as ternary complex formation, ubiquitination, or proteasomal degradation. Consequently, it specifically measures the contribution of direct enzymatic inhibition without assessing degradation efficiency. In addition, compound-related artifacts, including intrinsic fluorescence, fluorescence quenching, or interference with substrate cleavage, may influence the assay readout. These potential confounding factors should be addressed by incorporating appropriate control experiments, including compound-only, no-enzyme, no-substrate, and solvent controls. Accurate interpretation of the results also requires maintaining assay conditions within the linear range of enzyme kinetics.
Compared with cell-based degradation assays, the presented TR-FRET assay provides a direct and quantitative measurement of enzymatic activity under well-defined biochemical conditions. Cellular assays evaluating the antiviral activity of PROTACs integrate multiple biological processes, including target degradation and downstream consequences such as impaired viral polyprotein processing, reduced viral replication, and altered viral protein expression. Although these assays provide valuable information regarding overall antiviral efficacy, they generally cannot distinguish whether the observed effects result from direct inhibition of enzymatic activity or from degradation of the target protein10,12,13,14. In contrast, the TR-FRET assay enables precise mechanistic dissection at the enzymatic level and therefore serves as an important complement to established biochemical and cellular approaches.
This assay is particularly valuable for the development and optimization of PROTACs and other bifunctional molecules targeting enzymatically active proteins. Many antiviral degraders incorporate warheads derived from active-site inhibitors, thereby combining direct enzymatic inhibition with targeted protein degradation10,12,13,14. However, not all ligand scaffolds possess intrinsic inhibitory activity, and structural modifications, such as linker attachment, may alter binding affinity or binding mode20. The presented assay, therefore, enables quantitative assessment of the contribution of direct enzymatic inhibition to the overall antiviral activity of a PROTAC. Beyond SARS-CoV-2 Mpro, the method is broadly applicable to other viral proteases and enzymatic targets and may facilitate the rational development of degraders with well-defined mechanistic profiles. Importantly, by demonstrating that the investigated PROTAC induces only minimal direct inhibition of Mpro activity in vitro, this TR-FRET assay provides mechanistic validation that the antiviral effects observed in subsequent cell-based assays are primarily attributable to protein degradation rather than direct enzymatic inhibition.
In summary, the presented TR-FRET assay provides a robust, sensitive, and versatile platform for distinguishing direct enzymatic inhibition from degradation-associated effects. When integrated with complementary cellular assays, it enables comprehensive characterization of PROTAC mechanisms of action and supports the rational development of next-generation antiviral degraders.
Disclosures
The authors have no conflicts of interest to declare.
Acknowledgements
We acknowledge Laura Bunt, Justus Happe, Dominique Hagene, and Lukas Plamper for their support in the synthesis of the compounds used in this study. We further thank Konstantin Bloch and Miriam Ruth Heindl for advice during the establishment of this assay. Furthermore, we thank the Jürgen Manchot Foundation, the LOEWE Center DRUID, and the Uniscientia Foundation for funding.
Materials
| Name | Company | Catalog Number | Comments |
|---|---|---|---|
| Acrylamide (Rotiphorese® Gel 30) | Carl Roth | 3029.1 | SDS-PAGE ingredient |
| Ammoniumpersulfate (APS) | Biorad | 1610700 | SDS-PAGE ingredient |
| Bacterial strain BL21 Rosetta2 | La Jolla Institute for Immunology, San Diego, USA | N/A | provided by partners |
| BioTek Synergy H1 Multimode Reader | Agilent Technologies | Synergy H1 | For TR-FRET readout |
| Black 96-well FluoroNunc MaxiSorp plates | Thermo-Fisher Scientific | 437111 | Make sure to use black plates |
| Bromphenolblue | Sigma-Aldrich | 1.08122 | Sample buffer ingrediant |
| Centrifuge 5430-R (tabletop) | Eppendorf | 5430-R | With cooling function |
| Centrifuge Avanti J-25 | Beckman Coulter | 6594 | High speed centrifuge |
| Centrifuge Avanti J-26 XP | Beckman Coulter | JXN-26 | High speed centrifuge |
| Dimethylsulfate (DMSO) | Carl Roth | A994.1 | Solvent |
| Disodium hydrogen phosphate (Na2HPO4) | Carl Roth | X987.2 | Buffer ingredient |
| Ethanol (ROTIPURAN® ≥ 99,8 %, p.a.) | Carl Roth | 9065.1 | For IMAC |
| Glycerol | Carl Roth | 6967.1 | For bacterial stock |
| Hei-FLOW Core 120 peristaltic pump | Heidolph | 523-50010-00 | For IMAC |
| Heraeus Multifuge 3S-R | Heraeus | 2395 | No cooling function |
| HisTrap® FF Crude histidine-tagged protein purification columns (5 mL) | Cytiva | 17528601 | For IMAC |
| Imidazole | Carl Roth | 3899.3 | For protein elution during IMAC |
| InoLab pH/ION 7320 BNC pH meter | WTW | 1GA330 | For pH titration |
| Isopropyl-β-D-thiogalactopyranosid (IPTG) | Carl Roth | CN08.1 | For expression induction |
| Kanamycinsilfate | Sigma-Aldrich | PHR1487 | Antibiotic |
| Magnetic stirrer (Heated) | Heidolph | 7402 | For buffer production |
| Mercaptoethanol | Sigma-Aldrich | M6250-10ML | Sample buffer ingrediant |
| MultiScreen® 96-Well-Platte | MilliporeSigma | MSSBNFX40 | For dilutions |
| N,N,N',N'-tetramethylethylenediamine (TEMED) | Fisher Scientific | 11424214 | SDS-PAGE ingredient |
| Photometer Nanodrop ND1000 | Peqlab | 7533 | Protein concentration determination |
| Plasmid vector pET28a(+) | Addgene | 69864-3 | Expression vector |
| Potassium chloride (KCl) | Carl Roth | 1LCY.1 | Buffer component |
| Potassium dihydrogen phosphate (KH2PO4) | Carl Roth | 3904.1 | Buffer component |
| Protein Detective - ultrafast Coomassie protein stain (1 L) | BIOZOL | BZL-PD1 | For quick and easy protein staining |
| Rotor JA 25.50 and JLA 8.1000 | Beckmann Coulter | 363055, 363688 | High speed rotors |
| SenTix® 81 pH electrode | WTW | 103642 | For pH titration |
| Sodium cloride (NaCl) | Carl Roth | 3957.1 | Buffer and medium component |
| Sodium dodecyl sulfate (SDS) | Carl Roth | 0183.1 | SDS-PAGE and sample buffer ingredient |
| Sonifier Branson Ultrasonics S-450 | BANDELIN electronic | 10656933 | For sonication |
| SP standard (wt 1.6 mm) single channel pump head | Heidolph | 523-43010-00 | For IMAC |
| Spark Multimode Microplate Reader | Tecan Group | N/A | Enzyme kinetic assay |
| Tris | Carl Roth | 4855.2 | Buffer ingredient |
| Triton-X100 | Sigma-Aldrich | X100-100ML | Buffer ingredient |
| Tryptone/Peptone | Carl Roth | 6681.3 | Medium ingredient |
| Yeast extract | Carl Roth | 2363.2 | Medium ingredient |
| Z-Competent E. coli Transformation Kit® and Buffer Set | Zymo Research | T3001 | For bacterial transformation |
References
- Samarasinghe KTG, Crews CM. Targeted protein degradation: A promise for undruggable proteins. Cell Chem Biol. 2021;28(7):934-951.
- Dong G, Ding Y, He S, Sheng C. Molecular glues for targeted protein degradation: From serendipity to rational discovery. J Med Chem. 2021;64(15):10606-10620.
- Buetow L, Huang DT. Structural insights into the catalysis and regulation of E3 ubiquitin ligases. Nat Rev Mol Cell Biol. 2016;17(10):626-642.
- Li W, et al. Genome-wide and functional annotation of human E3 ubiquitin ligases identifies MULAN, a mitochondrial E3 that regulates the organelle's dynamics and signaling. PLoS One. 2008;3(1).
- Békés M, Langley DR, Crews CM. PROTAC targeted protein degraders: The past is prologue. Nat Rev Drug Discov. 2022;21(3):181-200.
- Crowe C, et al. Mechanism of degrader-targeted protein ubiquitinability. Sci Adv. 2024;10(41).
- Fischer ES, et al. Structure of the DDB1-CRBN E3 ubiquitin ligase in complex with thalidomide. Nature. 2014;512(7512):49-53.
- Teng M, Gray NS. The rise of degrader drugs. Cell Chem Biol. 2023;30(8):864-878.
- Burke MR, Smith AR, Zheng G. Overcoming cancer drug resistance utilizing PROTAC technology. Front Cell Dev Biol. 2022;10.
- de Wispelaere M, et al. Small molecule degraders of the hepatitis C virus protease reduce susceptibility to resistance mutations. Nat Commun. 2019;10(1):3468.
- Paiva SL, Crews CM. Targeted protein degradation: Elements of PROTAC design. Curr Opin Chem Biol. 2019;50:111-119.
- Pan B, et al. Targeted protein degraders of SARS-CoV-2 Mpro are more active than enzymatic inhibition alone with activity against nirmatrelvir-resistant virus. Commun Med. 2025;5(1):140.
- Alugubelli YR, et al. Discovery of first-in-class PROTAC degraders of SARS-CoV-2 main protease. J Med Chem. 2024;67(8):6495-6507.
- Xu Z, et al. Discovery of oseltamivir-based novel PROTACs as degraders targeting neuraminidase to combat H1N1 influenza virus. Cell Insight. 2022;1(3):100030.
- Schwerdtner M, et al. Unveiling the role of TMPRSS2 in the proteolytic activation of pandemic and zoonotic influenza viruses and coronaviruses in human airway cells. Viruses. 2024;16(11):1798.
- Steinmetzer T, Hardes K. The antiviral potential of host protease inhibitors. In: Böttcher-Friebertshäuser E, Garten W, Klenk HD, editors. Activation of Viruses by Host Proteases. Springer; 2018. p. 279-325.
- Böttcher-Friebertshäuser E, et al. Cleavage of influenza virus hemagglutinin by airway proteases TMPRSS2 and HAT differs in subcellular localization and susceptibility to protease inhibitors. J Virol. 2010;84(11):5605-5614.
- Lam van TV, Ivanova T, Lindberg I, Böttcher-Friebertshäuser E, et al. Design, synthesis, and characterization of novel fluorogenic substrates of the proprotein convertases furin, PC1/3, PC2, PC5/6, and PC7. Anal Biochem. 2022;655:114836.
- Hardes K, Hammamy MZ, Steinmetzer T. Synthesis and characterization of novel fluorogenic substrates of coagulation factor XIII-A. Anal Biochem. 2013;442(2):223-230.
- Frost A, O'Connor S, Ciulli A. Allosteric PROTACs: Expanding the horizon of targeted protein degradation. J Am Chem Soc. 2026;148(3):2823-2837.
Reprints and Permissions
This article has been published
Video Coming Soon