This study establishes a robust cross-scale framework linking binder damage mechanics to mixture fatigue performance, demonstrating that linear amplitude sweep–simplified viscoelastic continuum damage (LAS–S-VECD) parameters provide a reliable, mechanistically grounded basis for predicting and designing durable warm-mix asphalt systems.
A subscription to JoVE is required to view this content. Sign in or start your free trial.
Research Article
Cross-Scale Characterization of Fatigue Damage in Warm-Mix Asphalt Based on Linear Amplitude Sweep and Four-Point Bending Tests
In This Article
Summary
Abstract
Fatigue cracking is a critical factor governing the long-term durability of asphalt pavements, while the cross-scale relationship between binder fatigue behavior and mixture fatigue performance remains insufficiently understood for warm-mix asphalt (WMA). In this study, the fatigue characteristics of WMA were systematically investigated at both binder and mixture scales to establish quantitative cross-scale correlations. Dynamic shear rheometer (DSR) tests and linear amplitude sweep (LAS) tests interpreted using the simplified viscoelastic continuum damage (S-VECD) framework were employed to characterize the rheological properties and damage evolution of asphalt binders with different crude oil origins. Mixture-scale fatigue performance was evaluated using strain-controlled four-point bending fatigue tests. The results indicate that aging significantly increases binder stiffness and accelerates fatigue degradation, with the fatigue factor G*·sin δ increasing by approximately 150–250% after long-term aging. The effectiveness of warm-mix modification at the binder scale was strongly binder-dependent, as reflected by an 8–13% reduction in the damage rate coefficient for Binders A and B but an approximately 11% increase for Binder C. Conventional rheological indicators such as sin δ exhibited limited and material-dependent capability in predicting mixture fatigue life, whereas LAS–S-VECD-derived damage parameters showed consistently strong correlations with mixture-scale fatigue performance. Overall, this study demonstrates that LAS–S-VECD-based binder damage characterization provides a robust basis for predicting mixture fatigue resistance and supports its application in performance-based mixture design for durable and sustainable WMA pavements.
Introduction
Conventional asphalt pavement construction relies on high-temperature processing, typically ranging from 160 °C to 180 °C, and exceeding 190 °C for modified binders such as rubberized asphalt and high-performance polymer-modified bitumen. In specialized applications, including steel bridge deck pavements, in-situ mixture placement temperatures may surpass 200 °C1. These extreme thermal conditions result in substantial fossil fuel consumption and generate significant atmospheric emissions, including greenhouse gases and hazardous asphalt fumes rich in benzene-soluble compounds and carcinogenic polycyclic aromatic hydrocarbons (e.g., benzo[a]pyrene)2,3. Previous studies have consistently shown that reducing asphalt production and compaction temperatures can lower fuel consumption, CO₂ emissions, and occupational exposure to asphalt fumes, although the magnitude of these benefits depends on mixture type, plant configuration, additive dosage, and field construction conditions. Recent studies have further enriched the understanding of asphalt performance under various modifications and service conditions. It has been reported that the introduction of calcium lignosulfonate into asphalt mixtures can effectively delay thermo-oxidative aging by inhibiting oxidation reactions and stabilizing the colloidal structure of asphalt binders.
In terms of fracture behavior, investigations of hot mix asphalt (HMA) and warm mix asphalt (WMA) under pure Mode I and Mode II loading conditions have demonstrated that loading mode plays a critical role in governing low-temperature fracture toughness and energy dissipation. Moisture susceptibility has also been extensively studied in rubber-modified asphalt systems, where recycled rubber materials improve resistance to moisture-induced damage, and optimal rubber content can be determined through combined mechanical and economic evaluation approaches. Regarding high-temperature performance, modified stone matrix asphalt (SMA) has been evaluated using Dynamic Creep and Hamburg Wheel Tracking Device tests, confirming that the mixture modification significantly enhances rutting resistance. In addition, semicircular bending (SCB)-based studies on asphalt mixtures incorporating recycled additives have shown notable improvements in Mode I fracture resistance and moisture damage resistance, highlighting the synergistic effects of recycled materials on fatigue and durability performance. Consequently, the development of low-temperature asphalt technologies has emerged as a critical pathway toward sustainable pavement construction and environmentally responsible infrastructure systems.
Warm mix asphalt (WMA) technology, achieved through the incorporation of chemical additives, organic waxes, or foaming techniques, enables effective mixture production at temperatures typically between 90 °C and 130 °C—representing a reduction of 30–50 °C compared with conventional hot mix asphalt (HMA)4. Beyond its well-documented benefits in reducing energy demand and pollutant emissions, WMA plays a pivotal role in mitigating the thermo-oxidative aging of asphalt binders during production and placement. Asphalt aging is governed by temperature-dependent chemical kinetics, with oxidation rates approximately doubling for every 10 °C increase in temperature5,6. Elevated temperatures accelerate volatilization, oxidation, and polymerization reactions, progressively transforming maltenes into rigid asphaltenes and thereby increasing binder stiffness while reducing ductility7. By lowering production temperatures, WMA suppresses these deleterious reactions, preserving binder viscoelasticity and potentially enhancing long-term fatigue resistance8.
Although the environmental and constructability advantages of WMA have been extensively reported, systematic investigations into its fatigue performance under aging conditions remain comparatively limited. In particular, asphalt binders derived from different crude oil sources—such as Karamay, offshore CNOOC, and CNPC feedstocks—exhibit pronounced variations in chemical composition, including asphaltene content, resin distribution, aromatic fractions, and saturate levels9. These compositional differences are widely recognized as fundamental determinants of rheological behavior, aging susceptibility, and fatigue durability10. Nevertheless, existing fatigue studies seldom differentiate binders based on crude oil origin, resulting in an incomplete understanding of how source-dependent chemistry governs fatigue performance, especially under cumulative aging representative of in-service conditions11,12. From an engineering perspective, a reliable binder-scale fatigue evaluation method would be particularly useful for preliminary material screening, warm-mix additive selection, aging sensitivity assessment, and quality control before mixture-level verification. Nevertheless, LAS–S-VECD should not be regarded as a complete substitute for mixture fatigue testing because aggregate gradation, air voids, binder–aggregate interaction, compaction quality, and field aging may also govern pavement fatigue performance. Furthermore, the relationship between binder-scale fatigue indicators and mixture-scale fatigue behavior has not been conclusively established across diverse asphalt sources13. While rheological tests such as the Linear Amplitude Sweep (LAS) have shown promise in characterizing binder fatigue damage, their predictive reliability for mixture fatigue life—particularly for binders with distinct chemical origins—remains insufficiently validated14. This disconnect limits the accuracy of laboratory-based performance predictions and constrains rational material selection for engineering practice15.
To address these critical gaps, this study conducts a comprehensive, multi-scale investigation into the fatigue behavior of warm-mix modified asphalt binders derived from three distinct crude oil sources16. By integrating dynamic shear rheometer (DSR) analysis, Linear Amplitude Sweep (LAS) testing within the Simplified Viscoelastic Continuum Damage (S-VECD) framework, and mixture-scale four-point bending fatigue tests, this work systematically evaluates the influence of crude oil origin, warm-mix modification, and aging on fatigue resistance17,18,19. The findings aim to establish robust cross-scale correlations between binder rheology and mixture performance, providing a mechanistic basis for fatigue life prediction and offering practical guidance for the design and selection of sustainable asphalt materials.
This study presents a cross-scale fatigue characterization framework for warm-mix asphalt by integrating binder-scale LAS–S-VECD analysis with mixture-scale four-point bending fatigue testing. Compared with previous studies that mainly focus on either binder-level rheological evaluation or mixture-level performance assessment in isolation, the present work establishes a direct mechanistic linkage between crude oil–dependent binder chemistry, warm-mix modification, and mixture fatigue behavior under aging conditions. The novelty of this study lies in three aspects: (i) explicit incorporation of crude oil origin as a governing variable for fatigue performance; (ii) systematic cross-scale correlation between LAS–S-VECD damage evolution and mixture fatigue life; and (iii) unified evaluation of warm-mix modification effects across binder and mixture scales. The results demonstrate that LAS–S-VECD-derived damage parameters provide robust predictors of mixture fatigue performance, offering a more mechanistically grounded alternative to conventional rheological indices. These findings establish a scientific basis for performance-oriented evaluation and design of sustainable warm-mix asphalt systems.
Access restricted. Please log in or start a trial to view this content.
Protocol
Materials
The three asphalt binders selected in this study, as summarized in Table 1, are representative pavement binders derived from different crude oil sources and have been widely used in practical road engineering in China. Karamay asphalt, CNOOC 36-1 asphalt, and PetroChina asphalt differ markedly in crude origin, chemical composition, aging susceptibility, and rheological characteristics, providing a suitable material basis for investigating oil-source-dependent fatigue behavior. Their selection enables a comparative evaluation of how intrinsic binder composition influences the effectiveness of warm-mix modification and mixture-scale fatigue performance, thereby enhancing the engineering relevance of the proposed cross-scale fatigue characterization framework. Detailed geological origins and chemical characteristics of each binder are as follows:
Binder A: Derived from heavy oil feedstock of the 9th zone, produced via a blending process of vacuum residue and deoiled asphalt. Its base material exhibits distinctive properties, including low paraffin content (<2%), minimal sulfur concentration, and high resin composition. Notably, Karamay asphalt is the only pavement binder with a specific gravity below 1 g/cm3 in current engineering applications, and it features superior dynamic viscosity and excellent ductility retention after aging. These characteristics make it particularly suitable for regions subjected to large diurnal temperature variations and intense ultraviolet exposure.
Binder B: Originates from the rare heavy crude oil extracted from the Suizhong 36-1 offshore oilfield, with a high bitumen yield of 56% through refining. The feedstock is classified as a sulfur-deficient, naphthenic-base heavy crude with a high acid value, resulting in a processed binder with high density (1.012 g/cm3), low paraffin content (1.8%), and elevated resin proportions. Such properties endow the binder with excellent low-temperature flexibility, rendering it advantageous for cold environment applications.
Binder C: Primarily formulated using Venezuelan Boscan heavy crude as the base feedstock, achieving a 60% production yield via specialized refining processes. This crude oil exhibits unique geochemical features, including high acid content, significant heavy metal concentrations, and strong carbon residue formation potential. The binder displays an atypical hydrocarbon composition, characterized by low saturated hydrocarbon fractions, enriched resin-asphaltene complexes, and remarkably low paraffin content (1.3%).
In this investigation, the three base asphalt binders were designated as AO (Karamay), BO (CNOOC 36-1), and CO (PetroChina). Corresponding WMA binders were prepared by incorporating Evotherm M1 additive, coded as AP, BP, and CP, respectively20. Comprehensive performance indices, including penetration, softening point, and ductility, were tested in accordance with JTG E20-201121 specifications, with detailed comparative data presented in Table 1. All experimental procedures were strictly followed by the standardized protocols outlined in the Technical Specifications for Highway Engineering Asphalt and Bituminous Mixtures.
| Project | Unit | Karamay | CNOOC | CNPC |
| Penetration | 0.1 mm (15 °C) | 22 | 22 | 24 |
| 0.1 mm (25 °C) | 72 | 68 | 71 | |
| 0.1 mm (30 °C) | 112 | 110 | 116 | |
| PI | - | -1.14 | -1.2 | -0.81 |
| TR&B | °C | 46 | 46.5 | 47.5 |
| Dynamic viscosity (60 °C) | Pa·s | 223.5 | 230 | 256.9 |
| Ductility (10 °C,5 cm/min) | cm | >100 | >100 | 52 |
| Wax content | % | 1.9 | 1.8 | 1.3 |
| Flash point (COC) | ℃ | 278 | 287 | 312 |
| Solubility | % | 99.5 | 99.7 | 99.8 |
| Density (15 °C) | g/cm³ | 0.977 | 1.012 | 1.049 |
| RTFOT | Quality change (%) | 0.05 | 0.06 | -0.07 |
| Residual penetration ratio (%) | 66.2 | 67.4 | 64.8 | |
| Residual ductility (10 °C,cm) | 13 | 12 | 9 |
Table 1: Key technical parameters of bituminous binders. Table 1 summarizes the key technical parameters of bituminous binders, including physical properties, temperature susceptibility, rheological characteristics, and short-term aging performance, to evaluate their fundamental properties and durability.
The WMA preparation process involved a strictly controlled multi-stage protocol designed to ensure reproducibility of binder modification. The base asphalt binder was first heated in a forced-convection oven at 135 ± 2 °C for 60 min to achieve a stable molten state, followed by 30 min of equilibration to eliminate thermal gradients. All heating processes were conducted under sealed containers with nitrogen protection (flow rate: 0.5 L/min) to minimize oxidative aging during temperature conditioning.
The Evotherm M1 additive was then incorporated at 135 ± 2 °C under continuous mechanical stirring at 300 rpm for 5 min prior to high-shear processing, ensuring initial dispersion of the surfactant phase. Subsequently, high-shear mixing was performed using a rotor–stator homogenizer at 3000 rpm for 25 min, while maintaining the binder temperature within 135–140 °C using an external oil bath temperature control system (±1 °C accuracy). During the entire mixing process, the temperature was continuously monitored using a calibrated K-type thermocouple inserted into the binder matrix, and fluctuations exceeding ±2 °C triggered automatic heating adjustment. The modified binder was then subjected to a controlled cooling procedure to 25 °C at 5 °C/min before subsequent testing or short-term storage. The shear protocol design followed the viscosity–temperature relationship of asphalt binders, ensuring that all samples were prepared under comparable shear history conditions. This strict thermal–mechanical control guarantees high repeatability and minimizes variability in WMA binder preparation.
Dynamic shear rheometer (DSR) testing
To characterize the rheological response and fatigue-related properties of asphalt binders modified with warm-mix additives, Dynamic shear rheometer (DSR) tests were conducted using a temperature-controlled rotational rheometer in accordance with ASTM D717522. The rheological evaluation focused on intermediate-temperature fatigue behavior, which is closely associated with crack initiation and propagation in asphalt pavements.
The fatigue factor G*sin δ23, widely recognized as an indicator of fatigue susceptibility at the binder level, was adopted to quantify changes in viscoelastic dissipation behavior induced by warm-mix modification and aging. Temperature sweep tests were performed over a range of 58–82 °C, with temperature increments of 6 °C. At each target temperature, specimens were allowed to equilibrate for 10 min before data acquisition to ensure thermal stability. To investigate the influence of aging on rheological properties, binder specimens were subjected to three aging conditions: unaged, rolling thin film oven test (RTFOT) aging, and combined RTFOT and Pressure Aging Vessel (PAV) aging 24. These aging protocols were designed to simulate short-term aging during production and placement, as well as long-term aging during in-service pavement operation. The evolution of G*sin δ with temperature and aging condition was analyzed to assess the fatigue resistance of different binders.
Before each DSR test, the binder specimen was carefully trimmed after loading between the parallel plates to ensure a uniform edge profile. The specimen was conditioned at the target temperature for 10 min before measurement. Testing was performed over 58–82 °C at 6 °C increments. A valid test was confirmed when the measured torque and displacement remained within the instrument’s recommended operating range, and no visible specimen slippage occurred.
Linear amplitude sweep (LAS) testing
Viscoelastic behavior characterization was conducted in accordance with ASTM D7175 specifications for dynamic mechanical analysis25. The experimental methodology included strain amplitude sweeps to establish linear viscoelastic boundaries, followed by frequency-controlled testing at 10 rad/s26. Temperature-dependent evaluations covered the operational temperature spectrum of asphalt pavements (58–82°C), executed in 6°C increments with 10 minutes allowed for thermal equilibrium at each isothermal segment. The AASHTO T391 protocol was employed to quantify binder damage accumulation through dissipated energy evolution, specifically monitoring the viscoelastic dissipation factor (|G*|sin δ) during cyclic loading 27,28. The Simplified Viscoelastic Continuum Damage (S-VECD) framework was adopted to predict degradation patterns of bituminous composites29. The LAS protocol executes an oscillatory amplitude sweep at a fixed 10 Hz frequency, applying controlled strain progression from 0.1% to 30% with 0.1% resolution increments.
Key viscoelastic parameters were derived using the following equations:
log G "(ω) = m (log ω) + b (1)
G'(ω) = G* (ω) × cosδ (ω) (2)
 (3)
(3)
where G''(ω) is the loss modulus, ω is the angular frequency, m and b are fitting coefficients, G'(ω) is the storage modulus, G*(ω) is the complex modulus, δ(ω) is the phase angle, and is the viscoelasticity index.
Damage quantification employed the fundamental relationship expressed in Equation (4):
 (4)
(4)
In the formula: C(t)—the integrity parameter, C(t)=G^* (t)/G^* (Initial), G^*- complex modulus (MPa);
γ_0—Applying strain (%);
t—Test duration (s)
The temporal evolution of damage metric D(t) and structural integrity coefficient C(t) is mathematically parameterized through a power-law constitutive relationship (Yuan 2024):
C(t) = C0 - C1 × DC2 (5)
In the formula: C0 represents the initial integrity parameter (normally equal to 1) ,C1, C2—fitting parameters.
Calculate the fatigue damage value using the concept of the shear stress peak point:
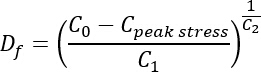 (6)
(6)
Cpeak is the integrity parameter corresponding to the maximum shear stress point.
The fatigue life calculation formula is:
Nf = A(γmax)-B (7)
In the formula: A, B—fatigue-related coefficient,
A = f × (Df)[1 + (1 - C2 )a] / {[1 + (1 - C2 )a] × (πC1 C2 )a} (8)
B=2a, f-loading frequency;
γmax — expected maximum strain level (%)
To ensure the reliability and reproducibility of experimental results, all binder-scale and mixture-scale tests were conducted with at least 3 independent replicates (n = 3) per condition. The reported results represent the mean values of replicate measurements. The variability of experimental data was evaluated using standard deviation (SD), and error bars are provided in all relevant figures to reflect statistical dispersion. For LAS–S-VECD parameters, DSR rheological indices, and fatigue life from four-point bending tests, the coefficient of variation (COV) was additionally calculated to assess data consistency.
In all cases, statistical differences between modified and unmodified binders were examined to ensure that observed trends are not due to experimental scatter but represent statistically meaningful differences in fatigue and rheological behavior.
Four-point bending fatique testing
To validate binder-level fatigue indicators and establish cross-scale correlations, four-point bending fatigue tests were conducted on asphalt mixtures prepared using an AC-16C gradation30,31. The aggregate gradation, apparent density, bulk specific gravity, and water absorption of each aggregate size, together with the properties of the mineral filler, are summarized in Table 2. The asphalt content of all mixtures was fixed at 4.8% to ensure consistency across different WMA formulations.
| Sieve Size (mm) | Aggregate Category | Synthetic Grading (%) | ||||
| 1# (10~20mm. 29%) | 2# (5~10mm. 29.2%) | 3# (3~5mm. 17%) | 4# (0~3mm. 19%) | Mineral Powder (5.8%) | ||
| 0.075 | 0 | 0.1 | 0 | 0.9 | 90.8 | 5.5 |
| 0.15 | 0.1 | 0.1 | 0 | 4.9 | 95.3 | 6.5 |
| 0.3 | 0.1 | 0.2 | 0 | 13 | 98.7 | 8.3 |
| 0.6 | 0.1 | 0.2 | 0 | 25.2 | 99.7 | 10.6 |
| 1.18 | 0.1 | 0.2 | 0 | 47.8 | 100 | 15 |
| 2.36 | 0.1 | 0.5 | 0 | 100 | 100 | 25 |
| 4.75 | 0.8 | 15.5 | 98.9 | 100 | 100 | 46.4 |
| 9.5 | 15.2 | 99.5 | 100 | 100 | 100 | 75.2 |
| 13.2 | 68.4 | 99.8 | 100 | 100 | 100 | 90.8 |
| 16 | 94.8 | 100 | 100 | 100 | 100 | 98.5 |
| 19 | 100 | 100 | 100 | 100 | 100 | 100 |
| Apparent Relative Density | 2.899 | 2.918 | 2.845 | 2.754 | 2.872 | 2.865 |
| SSD Relative Density | 2.854 | 2.847 | 2.816 | 2.691 | - | 2.814 |
| Bulk Specific Gravity | 2.829 | 2.81 | 2.8 | 2.655 | - | 2.787 |
| Aggregate Water Absorption Rate (%) | 0.85 | 1.32 | 0.56 | 1.36 | - | - |
Table 2: Grading of aggregates in warm-mix asphalt mixture. Table 2 presents the aggregate gradation of the warm-mix asphalt mixture, including the proportions of different aggregate fractions, mineral powder content, synthetic gradation curve, and aggregate physical properties. The table presents the designed particle-size distribution and the basic characteristics of the aggregates used in the asphalt mixture.
Four-point bending fatigue tests were performed using a Cooper testing apparatus under strain-controlled loading conditions to evaluate the fatigue durability of warm-mix asphalt (WMA) mixtures32. The failure criterion was defined as the number of loading cycles required for the flexural stiffness to decrease to 50% of its initial value. In accordance with the established testing protocol33, cyclic loading was applied in the form of a continuous sinusoidal waveform at a frequency of 10 Hz under isothermal conditions of 15 °C. All tests were conducted without rest periods to ensure uninterrupted energy input during fatigue loading34,35.
Beam specimens were fabricated in accordance with standard dimensional requirements, with a length of 381 ± 6.35 mm, a width of 63.5 ± 6.35 mm, and a height of 50.8 ± 6.35 mm3637. Under strain-controlled conditions, fatigue performance was characterized by plotting fatigue characteristic curves for specimens with different WMA formulations in a double-logarithmic coordinate system38. A power-law constitutive relationship was subsequently established, and nonlinear regression analysis was employed to fit the fatigue data of the various asphalt mixtures, providing the basis for subsequent fatigue life modeling and comparative analysis39,40,41. The beam specimen was mounted symmetrically in the four-point bending fixture, and contact between the loading clamps and specimen surface was checked before loading. The test was conducted at 15 °C under strain-controlled sinusoidal loading at 10 Hz without rest periods. The test endpoint was defined as the number of cycles at which flexural stiffness decreased to 50% of its initial value. Tests were considered valid when failure occurred within the gauge section, and no abnormal clamp slippage or sudden non-fatigue fracture was observed. All quantitative data are presented as mean ± standard deviation (mean ± SD), with sample size n = 3 for all experimental groups unless otherwise specified.
Access restricted. Please log in or start a trial to view this content.
Results
Rheological properties of WMA
The asphalt–aggregate interfacial zone is widely recognized as the primary initiation site of fatigue cracking. Accordingly, the fatigue-related rheological parameter G*sin δ, measured at intermediate service temperatures, was employed to evaluate the fatigue performance of warm-mix asphalt (WMA) binders. Figure 1 presents the variation of G*sin δ for the original and warm-mix modified bin...
Access restricted. Please log in or start a trial to view this content.
Discussion
This study proposes a cross-scale fatigue evaluation framework that integrates binder-level Linear Amplitude Sweep (LAS) testing with the Simplified Viscoelastic Continuum Damage (S-VECD) model and mixture-level four-point bending fatigue testing to establish a mechanistic linkage between asphalt binder damage evolution and mixture fatigue performance. Unlike conventional fatigue evaluation approaches that primarily rely on empirical rheological indicators, such as G*·sin δ, the proposed framework utilizes dama...
Access restricted. Please log in or start a trial to view this content.
Disclosures
The authors declare no conflict of interest.
Acknowledgements
We are grateful to the Zhejiang Provincial Department of Transportation for the Major R&D project. This research was funded by a major R&D project of the Zhejiang Provincial Department of Transportation (ZJXL-SJT-202316A).
Access restricted. Please log in or start a trial to view this content.
Materials
| Name | Company | Catalog Number | Comments |
|---|---|---|---|
| Binder A / AO, Karamay asphalt | Karamay crude oil source, China | N/A | Base asphalt binder |
| Binder B / BO, CNOOC 36-1 asphalt | CNOOC 36-1 offshore crude oil source, China | N/A | Base asphalt binder |
| Binder C / CO, PetroChina asphalt | PetroChina / Venezuelan Boscan crude-based source | N/A | Base asphalt binder |
| Evotherm M1 warm-mix additive | Ingevity / MeadWestvaco | Evotherm M1 | Warm-mix additive for WMA binder preparation |
| Dynamic Shear Rheometer | Malvern | Kinexus DSR+ | Used for DSR temperature sweep and LAS tests |
| Rolling Thin Film Oven Test device | Shanghai Changji | SYD-0610 | Used for short-term aging |
| Pressure Aging Vessel | InstroTek | PAV-9300 | Used for long-term aging |
| Four-point bending fatigue testing system | Cooper Research Technology | SA4PT | Used for strain-controlled mixture fatigue tests |
| S-VECD analysis framework | data analysis | N/A | Used to calculate LAS-derived damage parameters |
| Data analysis software | Origin | OriginPro 2024 | Used for regression fitting, correlation analysis, and plotting |
References
- Autelitano F, Bianchi F, Giuliani F. Airborne emissions of asphalt/wax blends for warm mix asphalt production. J Clean Prod. 2017;164:749-756.
- Bairgi BK, Mannan UA, Tarefder RA. Influence of foaming on tribological and rheological characteristics of foamed asphalt. Constr Build Mater. 2019;205:186-195.
- Chen H, Bahia HU. Modeling effects of aging on asphalt binder fatigue using complex modulus and the Linear Amplitude Sweep test. Int J Fatigue. 2021;146:106150.
- Cui B, Gu X, Hu D, et al. A multiphysics evaluation of the rejuvenator effects on aged asphalt using molecular dynamics simulations. J Clean Prod. 2020;259:120629.
- Diab A, You Z. Rheological characteristics of nano-sized hydrated lime-modified foamed warm mix asphalt. Pavement Materials, Structures, and Performance. 2014:79-89.
- Dong F, Yu X, Wang T, et al. Influence of base asphalt aging levels on the foaming characteristics and rheological properties of foamed asphalt. Constr Build Mater. 2018;177:43-50.
- Fang Y, Zhang Z, Zhang H, et al. Analysis of wetting behavior and its influencing factors of rejuvenator/old asphalt interface based on surface wetting theory. Constr Build Mater. 2022;314:125674.
- Ferrotti G, Mancinelli E, Passerini G, et al. Comparison of energy and environmental performance between warm and hot mix asphalt concrete production: A case study. Constr Build Mater. 2024;418:135453.
- Gao Z, Fu H, Chen Q, et al. Rheological properties and viscosity reduction mechanism of SBS warm-mix modified asphalt. Pet Sci Technol. 2020;38(6):556-564.
- Ge J, Yu H, Qian G, et al. Enhancement mechanism of aggregate surface roughness structure on interfacial properties of asphalt mixtures. Constr Build Mater. 2024;449:138388.
- Guo M, Tan Y, Wang L, et al. A state-of-the-art review on interfacial behavior between asphalt binder and mineral aggregate. Front Struct Civ Eng. 2018;12:248-259.
- Hu J, Ma T, Yin T, et al. Foamed warm mix asphalt mixture containing crumb rubber: Foaming optimization and performance evaluation. J Clean Prod. 2022;333:130085.
- Huang W, Guo Y, Zheng Y, et al. Chemical and rheological characteristics of rejuvenated bitumen with typical rejuvenators. Constr Build Mater. 2021;273:121525.
- Wang C, Chen Y, Xie W. A comparative study for fatigue characterization of asphalt binder using the linear amplitude sweep test. Mater Struct. 2020;53:101.
- Jiang Q, Li N, Yang F, et al. Rheology and volatile organic compounds characteristics of warm-mix flame retardant asphalt. Constr Build Mater. 2021;298:123691.
- Kheradmand B, Muniandy R, Hua LT, et al. An overview of the emerging warm mix asphalt technology. Int J Pavement Eng. 2014;15(1):79-94.
- Li B, Li N, Yu X, et al. Evaluation of the field-aged performance of foamed warm mix asphalt: Comparisons with hot mix asphalt. Case Stud Constr Mater. 2023;18:e01750.
- Doković K, Tošović S, Janković K, Šušić N. Physical-mechanical properties of cement stabilized RAP/crushed stone aggregate mixtures. Teh Vjesn. 2019;26(2):385-390.
- Liu H, Zhang Z, Li N, et al. Effect of organic montmorillonite on rheological properties of sasobit warm-mix asphalt and analysis of its ultraviolet aging behaviors. J Mater Civ Eng. 2022;34(12):04022339.
- Liu N, Liu L, Li M, et al. A comprehensive review of warm-mix asphalt mixtures: Mix design, construction temperatures determination, performance, and life-cycle assessment. Road Mater Pavement Des. 2024;25(7):1381-1425.
- Madeira NC, Ferreira PDS, Allochio Filho JOF, et al. Study of thermal aging of model compounds present in asphalt cement by GC/MS, ESI-MS, NMR, and FTIR. Energy Fuels. 2021;35(18):14553-14568.
- Menapace I, Cucalon LG, Kaseer F, et al. Application of low-field nuclear magnetic resonance to evaluate asphalt binder viscosity in recycled mixes. Constr Build Mater. 2018;170:725-736.
- Pouranian MR, Notani MA, Tabesh MT, et al. Rheological and environmental characteristics of crumb rubber asphalt binders containing non-foaming warm mix asphalt additives. Constr Build Mater. 2020;238:117707.
- Qu X, Wang D, Wang L, et al. The State-of-the-Art Review on Molecular Dynamics Simulation of Asphalt Binder. Adv Civ Eng. 2018;1:4546191.
- Sabouri M, Mirzaiyan D, Moniri A. Effectiveness of Linear Amplitude Sweep (LAS) asphalt binder test in predicting asphalt mixtures fatigue performance. Constr Build Mater. 2018;171:281-290.
- Shi C, Ge J, Yu H, et al. Interfacial adhesion properties and debonding mechanisms in rejuvenated asphalt mixtures. Constr Build Mater. 2024;425:135973.
- Sukhija M, Saboo N, Pani A. Effect of warm mix asphalt (WMA) technologies on the moisture resistance of asphalt mixtures. Constr Build Mater. 2023;369:130589.
- Sun X, Guo D, Li J, et al. Compaction Characteristics of a Foam Asphalt Hot In-Place Recycling Asphalt Mixture. Buildings. 2023;14(1):58.
- Tang N, Yang K-K, Alrefaei Y, et al. Reduce VOCs and PM emissions of warm-mix asphalt using geopolymer additives. Constr Build Mater. 2020;244:118338.
- Wang W, Cheng H, Sun L, et al. Multi-performance evaluation of recycled warm-mix asphalt mixtures with high reclaimed asphalt pavement contents. J Clean Prod. 2022;377:134209.
- Xia W, Dong M, Xu T. Synergistic suppressions of porous warm mix agent and composite flame retardant on combustion and fume release of asphalt pavement. J Clean Prod. 2024;443:141003.
- Xiu M, Wang X, Morawska L, et al. Emissions of particulate matters, volatile organic compounds and polycyclic aromatic hydrocarbons from warm and hot asphalt mixes. J Clean Prod. 2020;275:123094.
- Zhang M, Li W, Li Y, Ma Q, Zhao G. Preparation of low rolling resistance modified asphalt and analysis of its rolling resistance and viscoelasticity. Teh Vjesn. 2021;28(4):1297-1305.
- Yao Y, Chen H, Li G, et al. Effect of asphalt surface properties and genetic components on ice-asphalt interface adhesion behaviors. Constr Build Mater. 2025;471:140635.
- Yu S, Shen S, Steger R, et al. Effect of warm mix asphalt additive on the workability of asphalt mixture: From particle perspective. Constr Build Mater. 2022;360:129548.
- Yuan H, Liu J, Ding H, et al. Evaluation of physical hardening of wax-based warm mix asphalt binders from low-temperature rheological properties. Constr Build Mater. 2024;419:135496.
- Zhang S, Wang D, Guo F, et al. Properties investigation of the SBS modified asphalt with a compound warm mix asphalt (WMA) fashion using the chemical additive and foaming procedure. J Clean Prod. 2021;319:128789.
- Medjdoub A, Abdessemed M. Tests on the influence of cyclic loading and temperature on the behavior of flexible pavement reinforced by geogrids with numerical simulation. Teh Vjesn. 2023;30(2):521-529.
- Milad A, Babalghaith AM, Al-Sabaeei AM, et al. A comparative review of hot and warm mix asphalt technologies from environmental and economic perspectives: towards a sustainable asphalt pavement. Int J Environ Res Public Health. 2022;19(22):14863.
- Zhang F, Zhu J, Sun Y, et al. Effect analysis of using tall oil pitch (TOP) to partially extend bitumen in asphalt pavements: Comparison of different TOPs. Road Mater Pavement Des. 2025:1-20.
- Zhang F, Cannone Falchetto A, Wang D, et al. Prediction of asphalt rheological properties for paving and maintenance assistance using explainable machine learning. Fuel. 2025;396:135319.
Access restricted. Please log in or start a trial to view this content.