This study presents a Dynamic Orchestration Strategy for low-voltage feeder acceptance using collaborative multi-agent reinforcement learning. Intelligent agents coordinate feeder operation, congestion management, voltage stability, and renewable-energy integration under uncertain conditions. The approach was evaluated through simulations using the FeederBW and 236-bus datasets.
Research Article
Multi-Agent RL-Based Dynamic Feeder Acceptance Orchestration Using the FeederBW Dataset and 236-Bus Low-Voltage Distribution Network
In This Article
Summary
Abstract
The extensive integration of distributed renewable energy sources and the rapid expansion of low-voltage (LV) feeders have created operational challenges related to feeder acceptance and congestion coordination. Existing voltage-control and feeder-management approaches may have limited scalability and adaptability under intermittent renewable generation and changing network conditions. To address these limitations, this study proposes a Dynamic Orchestration Framework for Low-Voltage Feeder Acceptance based on intelligent-agent collaboration within a multi-agent reinforcement learning approach. Unlike voltage-control strategies focused primarily on voltage stabilization, the proposed framework supports dynamic feeder acceptance through the coordinated operation of agents responsible for feeder monitoring, congestion management, and voltage-sensitivity-based prioritization. The agents independently observed feeder states, evaluated congestion and voltage sensitivities, and collaborated on feeder-acceptance decisions. The framework was evaluated through simulations using the FeederBW dataset and the 236-bus low-voltage distribution-network dataset under varying renewable-integration levels and load conditions. The proposed framework achieved a Feeder Acceptance Rate of 97%, a Voltage Compliance Index of 98%, an orchestration latency of 98 ms measured as the wall-clock execution time of the orchestration algorithm on the reported hardware, and a convergence speed of 98.5%, outperforming the evaluated centralized coordination methods. The results also indicated improved adaptability, operational resilience, and decentralized decision-making efficiency under the simulated low-voltage distribution-network conditions.
Introduction
Modern power systems face significant operational challenges because of rising electricity demand and the increasing use of distributed generation. Imbalances between electricity supply and demand, or rapid increases in distributed generation, can impose financial strain on utilities and end users and jeopardize grid stability. Conventional, centrally controlled, fossil fuel-based electricity infrastructure is therefore shifting toward a distributed, renewable energy-driven design. This transition has improved access to more affordable and environmentally sustainable energy sources. However, the intermittent and unpredictable nature of photovoltaic (PV) generation raises concerns about grid reliability1,2.
The global energy transition is accelerating PV deployment because of its environmental benefits, scalability, and declining cost. According to the International Renewable Energy Agency, PV capacity is expected to account for more than 22% of global electricity supply by 2050, and solar PV is expected to become a major contributor to the global electricity supply by 20303. This widespread integration presents substantial challenges for conventional power systems, particularly regarding operational stability and reliability. Voltage fluctuation is a critical concern because PV generation is intermittent and non-dispatchable, and its effects become more pronounced as penetration increases across distribution and transmission networks4.
Variations in solar irradiance directly affect PV output and can produce rapid voltage changes. Cloud movement, abrupt irradiance variation, and load transients may cause voltage fluctuations that existing grid architectures cannot adequately accommodate5. Although conventional technologies have been effective in centralized and relatively stable grid configurations, they are less suitable for increasingly distributed networks. Rapid bidirectional voltage changes can exceed the capabilities of conventional power systems, particularly under high PV penetration6. Uncontrolled fluctuations may violate voltage limits, affect sensitive loads, and compromise grid safety.
The integration of smart loads and distributed resources into distribution networks has therefore motivated the development of more advanced control strategies. Intelligent control systems that continuously monitor and coordinate distributed equipment can help mitigate challenges in low-voltage (LV) networks with high distributed generation7. Large-scale PV integration also creates operational difficulties for thermal generation, particularly when PV output declines and thermal units must respond rapidly, sometimes exceeding ramp-rate limits8. At the same time, demand response (DR) programs must balance long-term sustainability with economic feasibility9.
DR programs can support the integration of distributed generation while helping balance electricity supply and demand. These programs are categorized as price-based DR or incentive-based DR (IBDR). Price-based DR encourages consumers to modify electricity use in response to time-varying tariffs, whereas IBDR provides fixed or variable financial incentives to reduce consumption when requested10. However, price-based DR exposes consumers to fluctuating wholesale prices and offers limited operational flexibility from the utility perspective, which may discourage risk-averse participants11,12.
Several studies have examined IBDR in PV-rich distribution systems. One study assessed the challenges and benefits of combining IBDR with high PV penetration but focused on aggregated power use rather than household-level home energy management systems13. Another proposed an incentive-based voltage-management method in which pricing signals indirectly controlled battery operation to maintain voltage limits, although household demand was not explicitly modeled14. A fuzzy logic-based method for determining incentive payments considered consumer satisfaction and renewable-integration costs but did not include feeder-level analysis15. Long-term generation planning incorporating both price-based and incentive-based DR has also been studied, including thermal and renewable generation, but without accounting for user comfort or household-level demand16.
Deep reinforcement learning (RL) has also been applied to residential DR. Deep RL methods for aggregated load control under time-of-use tariffs have been proposed, although their generalizability was limited by small user populations and the absence of appliance-level scheduling17. A multi-agent reinforcement learning framework combining DR and voltage control used long short-term memory networks for load forecasting, but did not resolve customer dissatisfaction resulting from load restriction18. Other work has focused on DR coordination for air-conditioning systems in commercial buildings using a Markov decision process, without considering other residential loads19. Existing deep RL voltage-control studies have generally not incorporated both DR and PV integration20,21.
Smart inverters can respond rapidly to abrupt and irregular changes in PV output22. When voltage violations occur, PV inverters can act within milliseconds, whereas conventional devices may require several seconds23. Some studies have proposed modifications to standard device-control procedures, including multi-agent approaches for coordinating voltage regulators and modifying conventional voltage-controller actions24. Nevertheless, standalone PV generation without co-located storage can worsen voltage excursions and does not alleviate evening peaks, even when it reduces daytime net imports24,25. Household batteries may also be depleted during periods of daytime PV surplus and become unavailable for nighttime electric-vehicle charging if their dispatch is not coordinated with local demand and generation26,27. The combined effects of stochastic demand, intermittent generation, and diverse storage behavior make capacity management, asset longevity, and resilience important concerns for distribution-system operators28. Home Energy Management Systems provide one potential means of implementing automated control at the customer level. RL is well-suited to such applications because agents can learn control strategies through interaction with the environment while handling uncertainty and making low-latency decisions.
Advances in electric-vehicle routing also illustrate how deep RL can manage dynamic energy constraints. The heterogeneous fleet-based capacitated electric-vehicle routing problem incorporates driving dynamics, road characteristics, kinetic resistance, and charging efficiency while minimizing maximum energy expenditure across a diverse fleet29. A dynamic-aware deep reinforcement learning method frames this problem as a customized Markov decision process and uses an encoder-updater-decoder architecture. In this design, the encoder develops role-specific representations for vertices and vehicles, the updater refines vehicle tokens as contextual information changes, and the decoder separates vehicle selection from vehicle-specific vertex selection to support adaptive decision-making. Similarly, an energy-optimal electric-vehicle routing problem with pickup-delivery and time windows uses a high-resolution energy-consumption model that includes charging behavior, time-dependent driving dynamics, and detailed route information30. A heterogeneous attention-driven deep reinforcement learning framework represents the routing task as a Markov decision process, with an encoder that captures role-specific interactions among depots, customers, and charging stations, and a decoder that tracks state transitions and temporal feasibility.
Despite these developments, most LV distribution-management studies emphasize voltage stabilization and reactive-power optimization rather than dynamic feeder-acceptance orchestration under renewable uncertainty. Distributed voltage-control methods based on intelligent inverters and machine learning generally focus on voltage compensation and reactive power optimization, without addressing adaptive feeder acceptance control or congestion-based orchestration in complex LV networks. Likewise, voltage-constrained multi-agent reinforcement learning approaches for DR do not directly address collaborative feeder-acceptance management, decentralized congestion-aware orchestration, or node-level admission control in interconnected LV distribution systems. Cooperative voltage-regulation methods based on multi-agent coordination typically minimize voltage deviations and tap operations using PV inverters, but do not consider adaptive feeder admission, renewable-related acceptance instability, or decentralized orchestration under dynamic network conditions.
Current distributed and multi-agent resource-coordination methods also face limitations in congestion awareness, temporal adaptability, and scalability. Most emphasize overload analysis, distributed energy resource interactions, or tariff-driven energy management rather than adaptive feeder-level acceptance and voltage-aware orchestration. Their reliance on partial centralization and static priorities can further limit decentralized decision-making, rapid response to congestion propagation, and adaptation to renewable variability. A fully decentralized, reinforcement learning-based framework that combines cooperative agent coordination with voltage- and congestion-sensitivity analysis is therefore needed for adaptive feeder-acceptance management using large-scale datasets such as FeederBW and the 236-bus LV distribution network.
In this study, feeder acceptance refers to the adaptive operational process for determining whether an LV feeder can accommodate additional distributed energy resources or electrical loads while maintaining network security, voltage compliance, thermal loading limits, and operational reliability. The operational boundary for feeder acceptance includes evaluating feeder capacity, voltage sensitivity, congestion conditions, and renewable energy variability before new feeder connections are accepted or prioritized. Unlike conventional voltage control, which regulates voltage profiles, distributed energy resource coordination, which manages resource operation, or congestion management, which mitigates network overloads, feeder acceptance integrates these functions within a collaborative multi-agent reinforcement learning framework to support dynamic, decentralized, and adaptive orchestration under renewable-rich conditions.
The objective of this study is to develop a collaborative intelligent-agent-based Dynamic Orchestration Strategy for Low-Voltage Feeder Acceptance under changing operating conditions and renewable uncertainty. The proposed framework performs decentralized feeder-acceptance orchestration by dynamically evaluating feeder states, voltage sensitivity, congestion sensitivity, and acceptance capacity, thereby enabling adaptive prioritization and decision-making beyond static voltage-control methods. Using the FeederBW dataset and the 236-bus LV distribution-network dataset, the study also develops a scalable multi-agent reinforcement learning architecture for large-scale LV systems. Through reinforcement-driven learning and low-latency collaborative optimization performed at each simulated operating interval, the framework is designed to reduce congestion propagation, improve voltage compliance, lower orchestration latency, and increase decentralized coordination efficiency.
The framework contributes a dynamic LV feeder-acceptance orchestration approach that replaces static voltage-control-based feeder-management strategies; a decentralized multi-agent reinforcement learning architecture for renewable uncertainty and varying load conditions; decentralized admission management based on low-latency conditions and dynamic feeder prioritization; joint voltage- and congestion-sensitivity indices for identifying critical feeders and prioritizing acceptance decisions; collaborative communication among neighboring agents; continuous reinforcement learning-based policy optimization to improve feeder stability, congestion mitigation, voltage compliance, and convergence; and large-scale simulation-based validation using the FeederBW and 236-bus LV datasets. Comparative results indicate improved feeder acceptance, congestion mitigation, orchestration delay, convergence speed, and voltage compliance relative to traditional centralized coordination methods.
Protocol
Human subjects, vertebrate animals, human tissues, or animal tissues were not used in this investigation. Only publicly accessible datasets (the FeederBW dataset and the 236-bus Low-Voltage Distribution Network dataset) and computer-based simulations were used in the study. Therefore, this study did not require institutional review board (IRB), ethical, or informed consent approval.
The Dynamic Orchestration Strategy for Low-Voltage Feeder Acceptance Based on Agent Collaboration was developed using multi-agent reinforcement learning (MARL) for renewable-rich operating conditions. The FeederBW and 236-bus low-voltage datasets were preprocessed, normalized, and temporally synchronized to construct a dynamic network model representing feeder states, distributed energy resources, voltage-sensitive regions, and congestion conditions. Intelligent agents were assigned to feeder sections and network junctions to monitor local voltage, congestion, renewable-generation uncertainty, and feeder acceptance capacity, exchange information with neighboring agents, and update orchestration policies through decentralized reinforcement learning. The reward function was designed to improve feeder acceptance while limiting congestion, voltage instability, and coordination delays. Voltage, feeder loading, transformer loading, and congestion constraints were considered, whereas three-phase unbalanced operation, advanced photovoltaic inverter control, and reactive power compensation were not explicitly modeled. The overall framework is shown in Figure 1. The research tools used in this study are listed in the Table of Materials.
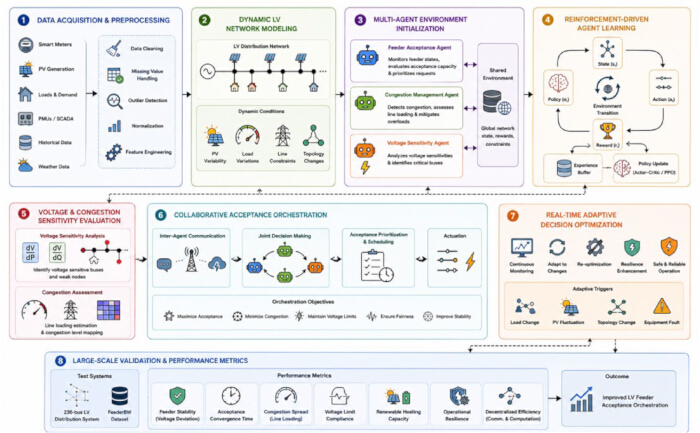
Figure 1: Architecture of the proposed framework. Schematic of the Dynamic Orchestration Framework incorporating intelligent agents, reinforcement learning, congestion analysis, and adaptive feeder coordination. Please click here to view a larger version of this figure.
1. Data acquisition
Data were acquired from the FeederBW dataset31 and the 236-bus LV distribution dataset32. These datasets were selected because they contained information on feeder topology, voltage conditions, renewable-generation behavior, load demand, congestion, and dynamic operating profiles required for decentralized orchestration and reinforcement-based agent learning.
The FeederBW dataset was used primarily to model feeder operation, renewable-energy intermittency, voltage deviation, and congestion propagation in LV grids. It contained feeder-operating data, distributed-generation behavior, node-voltage measurements, and load fluctuations that supported adaptive orchestration analysis. The 236-bus LV dataset was used to evaluate scalability and decentralized coordination. It contained bus-connection information, feeder-loading conditions, node-voltage characteristics, distributed renewable penetration, and congestion-sensitive operating cases. Together, the two datasets supported feeder-level and large-scale analyses under conditions of high renewable-energy penetration. The dataset characteristics and their purposes in the framework are summarized in Table 1.
| Dataset Name | Dataset Type | Number of Nodes/Buses | Data Attributes | Purpose in Proposed Work |
| FeederBW Dataset | Low-Voltage Feeder Operational Dataset | Multiple feeder nodes | Voltage profiles, renewable generation, load demand, congestion states, feeder operational behavior | low-latency feeder orchestration, congestion analysis, adaptive acceptance prioritization |
| 236-bus LV Dataset | Large-Scale Low-Voltage Distribution Dataset | 236 buses | Bus topology, feeder loading, voltage sensitivity, renewable penetration, congestion dynamics | Scalability validation, decentralized coordination evaluation, large-scale orchestration analysis |
Table 1: Dataset characteristics. Description of the datasets, operational attributes, and their purposes within the proposed low-voltage orchestration framework.
2. Data preprocessing
The acquired datasets were preprocessed to improve consistency, temporal alignment, and reinforcement-learning stability. Missing entries, erroneous measurements, duplicate records, and inconsistent feeder data were filtered using statistical preprocessing procedures. This step was used to maintain consistency among feeder-operating data, renewable-generation profiles, voltage measurements, and congestion-state data. All operational variables were min–max normalized so that the input features were transformed to a common scale suitable for agent learning. The normalized variables included feeder voltage, active-power demand, renewable generation, congestion status, and feeder acceptance capacity. The mathematical formulation of the preprocessing procedure is provided in Supplementary File 1 (Section 1).
3. Dynamic low-voltage network modeling
After data acquisition and preprocessing, a dynamic LV network model was constructed to simulate the behavior of a distribution system with a high proportion of renewable generation under varying load and generation conditions. The model dynamically tracked feeder topology, distributed energy resource behavior, voltage-sensitive regions, and congestion propagation.
Unlike a static network representation, the model updates feeder behavior according to renewable intermittency, consumer demand, and congestion conditions. The FeederBW and 236-bus LV datasets were used to construct interconnected feeders in which buses, transformers, distributed renewable sources, and loads were represented as network nodes. Each feeder node provided updated information on voltage magnitude, active-power demand, renewable generation, feeder-loading status, and congestion status. These variables were used by the intelligent agents to monitor feeder behavior and make decentralized orchestration decisions. The network model also supported the identification of sensitive regions and feeder acceptance prioritization through continuous sensitivity analysis.
The LV distribution grid was represented as a graph-based network containing bus stations, feeder lines, transformers, renewable sources, and consumer-load nodes. Detailed mathematical derivations of the network model are provided in Supplementary File 1(Section 2). The dynamic network state and congestion index were monitored continuously. The congestion index was normalized to the range [0,1], and collaborative feeder acceptance orchestration was initiated when the congestion index exceeded 0.80.
4. Multi-Agent Environment Initialization
After the dynamic LV network model had been constructed, the multi-agent environment was initialized to support decentralized feeder acceptance. Intelligent agents were assigned to feeder segments, distributed energy resource connection points, transformer locations, and congestion-prone nodes within the LV network.
Each agent operated as an independent decision-making entity that monitored local feeder operation, exchanged information with neighboring agents, and executed adaptive orchestration actions. Agents were assigned to key feeder nodes according to voltage sensitivity, renewable penetration, congestion level, and feeder importance. The LV network was configured as an agent-based environment in which the agents continuously monitored feeder voltage, active power demand, renewable generation variation, congestion status, and feeder acceptance capacity. The mathematical formulation of the multi-agent environment is provided in Supplementary File 1(Section 3).
5. Reinforcement-driven agent learning
Following initialization of the multi-agent environment, reinforcement-driven learning was implemented to enable the agents to learn feeder-orchestration policies through interaction with changing LV operating conditions. During each interaction, an agent observed the current feeder state, selected an orchestration action, and received a reward or penalty. The decentralized learning process enabled the agents to adapt to renewable-generation uncertainty, changing congestion conditions, voltage variation, and changes in feeder acceptance capacity. Each agent selected an orchestration action according to its learned policy. The associated mathematical derivations are provided in Supplementary File 1(Section 4).
A total of 64 intelligent agents were deployed. Based on feeder topology, renewable penetration level, voltage sensitivity, and congestion severity, each agent was allocated to a feeder segment, transformer site, distributed energy resource connection point, or congestion-sensitive network node. While preserving reasonable computational complexity, the decentralized deployment allowed for cooperative monitoring and adaptive feeder acceptance throughout the 236-bus low-voltage distribution network. Each agent observed a five-dimensional state vector consisting of voltage magnitude, feeder-load demand, renewable generation, congestion status, and feeder acceptance capacity. The action space consisted of five orchestration actions: feeder acceptance prioritization, congestion mitigation, renewable coordination, load balancing, and voltage control. Cooperative decision-making was supported through a decentralized neighborhood communication topology in which each agent exchanged sensitivity indices and local operating information only with neighboring feeder agents.
A Q-learning-based MARL method was implemented using a fully connected neural network with two hidden layers containing 128 and 64 neurons. Rectified linear unit activation was applied in the hidden layers. The network parameters were optimized using the Adam optimizer with a learning rate of 0.001 and a discount factor of 0.99. A mini-batch size of 64 was used, and the experience-replay buffer had a capacity of 100,000 transitions. Training was considered to have converged when the moving average of the cumulative reward over the previous 20 episodes changed by less than 0.1% for 10 consecutive evaluation windows. If this criterion was not satisfied, training continued until a maximum of 500 episodes was reached. The reinforcement-learning workflow is shown in Figure 2.
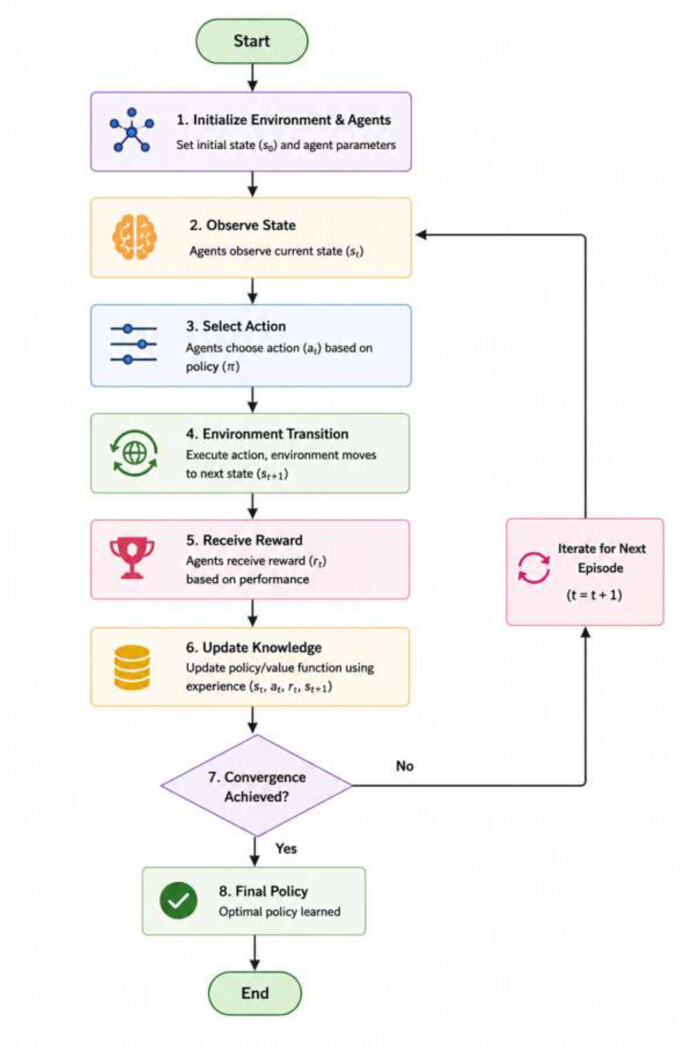
Figure 2: Flowchart of reinforcement-driven agent learning. Flowchart illustrating the reinforcement-based agent-learning process for decentralized feeder orchestration and decision optimization. Please click here to view a larger version of this figure.
The learning process began with initialization of the LV distribution environment, agent states, and learning parameters. Intelligent agents were placed in feeder regions, distributed energy resource locations, and congestion-prone buses. The observation space, learning rate, exploration strategy, reward factors, and policy functions were then defined. At each interaction step, every agent observed the current state of its assigned feeder region. The state consisted of node-voltage magnitude, feeder-load demand, renewable-generation characteristics, congestion level, and feeder acceptance capacity. These observations formed the environmental state used for orchestration decision-making. Each agent selected an action according to its reinforcement-learning policy. The available actions included feeder acceptance prioritization, congestion management, renewable-energy coordination, load balancing, and voltage management. The selected action was applied to the dynamic LV environment, after which the feeder state was updated.
A reward was calculated after each action. A positive reward was assigned when the selected action improved feeder acceptance, prevented congestion propagation, maintained voltage compliance, or improved network stability. A penalty was applied when the action resulted in, or failed to prevent, feeder overload, voltage violations, or orchestration delays. The calculated reward was used to update the agent’s value function and decision policy through reinforcement optimization. The observation, action selection, environment transition, reward calculation, and policy update sequence was repeated until the stopping criterion was satisfied.
6. Voltage and congestion sensitivity evaluation
Following reinforcement-driven learning, voltage and congestion sensitivities were evaluated to identify vulnerable feeder regions and to support dynamic feeder acceptance decisions under renewable energy uncertainty.
At each operating interval, the effects of changes in feeder power, renewable generation, and load demand on node voltage and network congestion were determined. Voltage- and congestion-sensitivity indices were recalculated at each simulated operating interval rather than being derived solely from static network conditions. The sensitivity indices for each feeder node were updated based on the current network conditions, renewable generation variation, and feeder loading state. The resulting values were used to rank feeder nodes for feeder acceptance, congestion management, and voltage control actions.
The voltage-sensitivity index quantified the change in node voltage resulting from a change in active-power flow. After the voltage- and congestion-sensitivity indices were calculated, they were combined into a composite sensitivity score for adaptive prioritization of feeder acceptance. The composite scoring method is described in Supplementary File 1(Section 5). Feeder nodes with higher sensitivity scores were assigned higher orchestration priorities during congestion relief, feeder acceptance correction, and voltage regulation operations. The sensitivity scores were recalculated at each operating interval and shared with neighboring agents through the collaborative communication environment.
7. Collaborative acceptance orchestration and adaptive decision optimization at each simulated operating interval
After a sensitivity evaluation, collaborative acceptance orchestration was performed to enable decentralized agents to make coordinated feeder acceptance decisions under renewable uncertainty and dynamic congestion conditions. The agents exchanged local feeder states, sensitivity indices, congestion alerts, and operating priorities. Each agent independently evaluated its local feeder condition while coordinating with neighboring agents to support overall network stability.
Feeder acceptance was prioritized according to voltage sensitivity, congestion severity, renewable-generation variability, and available feeder capacity. Local sensitivity-aware observations were aggregated across agents, and coordinated feeder acceptance actions were generated. The mathematical formulation of the collaborative orchestration process is provided in Supplementary File 1 (Section 6). The dynamic LV network environment was deployed with collaborative agents positioned in feeder regions, renewable-energy integration points, and congestion-prone buses, as described in Supplementary File 1 (Algorithm 1). At each operating interval, each agent observed local feeder parameters, including voltage magnitude, renewable generation variation, feeder loading, congestion level, and feeder acceptance capacity.
The voltage-sensitivity and congestion-sensitivity indices were then calculated to identify feeder regions susceptible to voltage instability or congestion propagation. These indices were combined into an overall feeder-sensitivity score that determined feeder acceptance and orchestration priority. Local state information, congestion levels, voltage-instability indicators, and acceptance priorities were exchanged among neighboring agents. Based on the local observations and shared information, each agent selected and implemented an adaptive orchestration action. After each action, reinforcement feedback was obtained from the dynamic LV network environment according to feeder stability, congestion reduction, voltage compliance, and feeder acceptance efficiency. This feedback was used to update each agent’s policy through reinforcement-based optimization. The global orchestration objective function simultaneously provided coordinated feedback for adaptive optimization across the agent population. Policy updates continued until the agent policies converged toward an optimal decentralized orchestration strategy.
8. Large-scale validation
The Dynamic Orchestration Strategy was validated using the FeederBW dataset and the 236-bus LV distribution network dataset under operating scenarios with high renewable-energy penetration. The validation assessed the ability of the decentralized orchestration framework to manage dynamic feeder acceptance, renewable intermittency, congestion propagation, and voltage instability in interconnected LV distribution systems. The evaluated operating scenarios included high renewable penetration, changing load demand, dynamic congestion propagation, voltage-sensitive conditions, and varying feeder acceptance capacity.
Framework performance was evaluated using feeder acceptance rate, voltage compliance index, congestion reduction rate, orchestration latency, convergence speed, decentralized coordination efficiency, and renewable accommodation capability. These measures were used to assess scalability, robustness, adaptability, and coordination performance. The proposed framework was compared with traditional centralized feeder-orchestration approaches under the same network configurations. Equivalent datasets, operating scenarios, evaluation conditions, and performance measures were applied to the comparison methods.
Table 2 summarizes the datasets, operating conditions, orchestration environments, and performance variables used for experimental validation. The FeederBW dataset was used to evaluate feeder operating dynamics, renewable intermittency, congestion development, residential load variation, and voltage fluctuations under LV feeder conditions. The 236-bus LV dataset was used to evaluate decentralized orchestration in a larger interconnected network. The architecture was validated under varying conditions of renewable generation, load demand, voltage, and congestion. Decentralized coordination and reinforcement-learning-based policy optimization were assessed jointly across the intelligent agents.
Feeder acceptance rate, voltage compliance index, congestion reduction rate, convergence speed, and orchestration latency were used to quantify performance under dynamic operating conditions in renewable energy systems.
| Experimental Parameter | FeederBW Dataset | 236-bus LV Dataset | Validation Purpose |
| Network Type | Low-Voltage Feeder Network | Large-Scale LV Distribution Network | Dynamic orchestration evaluation |
| Number of Nodes/Buses | Multiple feeder nodes | 236 buses | Scalability analysis |
| Renewable Integration | PV and distributed renewable sources | High renewable penetration buses | Renewable uncertainty validation |
| Load Demand Behavior | Dynamic residential load profiles | Large-scale feeder load variations | Adaptive load orchestration |
| Congestion Scenarios | Feeder overload and congestion states | Multi-bus congestion propagation | Congestion mitigation analysis |
| Voltage Conditions | Voltage fluctuation profiles | Voltage-sensitive bus conditions | Voltage compliance evaluation |
| Intelligent Agents | Distributed feeder agents | Large-scale collaborative agents | Decentralized coordination analysis |
| Learning Environment | Reinforcement-driven orchestration | Multi-agent adaptive learning | Policy optimization validation |
| Simulation Conditions | Dynamic renewable variability | Large-scale dynamic operation | low-latency orchestration testing |
| Performance Metrics | Acceptance rate, congestion reduction | Voltage compliance, convergence speed | Overall orchestration performance |
Table 2: Large-scale experimental validation. Experimental settings used to evaluate scalability, renewable-energy uncertainty, and decentralized coordination.
Results
All experiments were conducted five times using different random seeds to reduce the influence of stochastic learning. Mean values were calculated across the five runs. The same datasets, simulation parameters, hyperparameters, stopping criteria, and evaluation procedures were used for all methods. Centralized Voltage Control (CVC)33, Conventional Multi-Agent Control (CMAC)21, Reinforcement Learning-Based Voltage Regulation (RLVR)20, Distributed Energy Resource Coordination (DERC)26, and Sensitivity-Based Congestion Management (SBCM)34 were used as comparison methods.
Using one-way analysis of variance (ANOVA), statistical comparisons between the suggested framework and the baseline techniques (CVC, CMAC, RLVR, DERC, and SBCM) were carried out independently for each assessment metric. Tukey's honestly significant difference (HSD) post hoc test was employed for paired comparisons when the ANOVA revealed statistically significant differences. The threshold for statistical significance was set at p < 0.001. All statistical analyses were performed using one-way analysis of variance, followed by a significant difference post hoc test where appropriate. One-way ANOVA was conducted using the statsmodels.stats.anova module. The final converged performance values from five separate simulation runs for each approach were used for statistical significance testing. The purpose of the intermediate training episodes was to visualize the learning process; they were not tested for statistical significance.
Data acquisition
The FeederBW and 236-bus low-voltage (LV) distribution datasets supported the evaluation of the proposed framework under complementary operating conditions. The FeederBW dataset provided time-series feeder information, including voltage, distributed renewable generation, load demand, congestion conditions, and feeder acceptance behavior. It was used to evaluate dynamic feeder operation, renewable intermittency, residential load variation, congestion propagation, and voltage fluctuations.
The 236-bus LV distribution dataset contained 236 interconnected buses and included feeder topologies, voltage-sensitive regions, renewable penetration conditions, power-flow states, and congestion-propagation scenarios. It was used to evaluate decentralized coordination, adaptive orchestration, and scalability in a larger interconnected distribution network. Table 3 and Table 4 summarize the experimental validation conditions and simulation environment.
| Validation Parameter | Description |
| Datasets Used | FeederBW Dataset and 236-bus LV Dataset |
| Network Environment | Dynamic low-voltage renewable-rich distribution system |
| Renewable Sources | Distributed photovoltaic (PV) and renewable generators |
| Learning Framework | Multi-Agent Reinforcement Learning (MARL) |
| Coordination Strategy | Collaborative decentralized orchestration |
| Operating Scenarios | Renewable intermittency, load fluctuation, congestion propagation |
| Number of Intelligent Agents | 64 distributed feeder-level collaborative agents |
| Validation Objective | Adaptive feeder acceptance optimization |
| Evaluation Process | Real-time orchestration and sensitivity-aware coordination |
| Comparative Analysis | Compared with conventional centralized coordination methods |
Table 3: Environmental validation parameters. Validation parameters used to assess adaptive orchestration under dynamic low-voltage operating conditions.
| Simulation Component | Configuration |
| Processor Environment | High-performance multi-core processing system |
| Programming Framework | Python 3.11.9 |
| Learning Framework | Multi-Agent Reinforcement Learning (MARL) |
| Learning Algorithm | Q-learning-based Multi-Agent Reinforcement Learning |
| Neural Network Architecture | Fully connected neural network with two hidden layers (128 and 64 neurons, ReLU activation) |
| Optimizer | Adam optimizer |
| Learning Rate (α) | 0.001 |
| Discount Factor (γ) | 0.99 |
| Replay Mechanism | Experience replay buffer (capacity: 100,000 transitions) |
| Mini-batch Size | 64 |
| Exploration Policy | ε-greedy exploration (ε decayed from 1.0 to 0.01) |
| Training Episodes | 500 |
| Stopping Criterion | Maximum training episodes reached or convergence of cumulative reward |
| Network Modeling | Dynamic LV feeder network simulation |
| Renewable Simulation | Variable renewable generation profiles |
| Agent Coordination | Distributed collaborative communication |
| Data Processing | Real-time synchronized feeder state processing |
| Optimization Method | Reinforcement-based adaptive policy learning |
| Experimental Platform | Large-scale simulation using the FeederBW dataset and the 236-bus LV distribution network dataset |
| Performance Monitoring | Feeder Acceptance Rate (FAR), Voltage Compliance Index (VCI), Congestion Reduction Rate (CRR), Orchestration Latency (OL), Convergence Speed (CS), and Decentralized Coordination Efficiency (DCE) |
| Reward Weight (β) | 0.3 |
| Reward Weight (δ) | 0.25 |
| Objective Weight (ω₁) | 0.30 (Feeder Acceptance) |
| Objective Weight (ω₂) | 0.25 (Congestion Reduction) |
| Objective Weight (ω₃) | 0.25 (Voltage Compliance) |
| Objective Weight (ω₄) | 0.20 (Orchestration Latency) |
| Policy Learning Rate (η) | 0.001 |
| Regularization / Balancing Parameter (λ) | 0.1 |
Table 4: Simulation environment. Simulation settings used for reinforcement-based feeder-orchestration experiments.
Data preprocessing
The synchronized and normalized data supported consistent comparison across the proposed framework and the baseline methods. The same preprocessed feeder states, renewable-generation profiles, load-demand conditions, voltage conditions, and congestion scenarios were used in all evaluations. This common input structure reduced differences caused by dataset preparation and allowed the observed performance differences to be associated with the evaluated orchestration methods.
Dynamic low-voltage network modeling
The dynamic LV network model represented changing renewable generation, consumer demand, voltage conditions, feeder loading, and congestion propagation. Under these conditions, the proposed framework maintained feeder acceptance while responding to voltage-sensitive and congestion-sensitive operating states. The model supported evaluation under fluctuating renewable generation, changing consumer loads, and congestion-prone network conditions. Across these conditions, the collaborative agents performed feeder prioritization, voltage-dependent coordination, congestion mitigation, and renewable accommodation without centralized control.
Multi-agent environment initialization
The decentralized agent arrangement supported local observation and coordinated decision-making across feeder regions and network junctions. Agents exchanged feeder-state information and sensitivity measures with neighboring agents while independently selecting orchestration actions. The observed coordination behavior showed that the distributed arrangement supported feeder prioritization, load coordination, voltage management, and congestion response. The decentralized configuration also reduced dependence on a single centralized controller and supported coordinated operation across the larger 236-bus network.
Reinforcement-driven agent learning
The reinforcement-driven policy improved across the training period for feeder acceptance, voltage compliance, congestion reduction, orchestration latency, and convergence speed. Figure 3 compares the Feeder Acceptance Rate (FAR) of the proposed framework with CVC, CMAC, RLVR, DERC, and SBCM. CVC produced the lowest FAR, increasing from 62% to 70%. CMAC and DERC reached maximum FAR values of 75% and 78%, respectively. RLVR and SBCM reached 83% and 81%, respectively. The proposed framework increased FAR from 72% during the early training stage to 97% during the later stage. This result showed that the collaborative reinforcement-learning process supported adaptive feeder acceptance under renewable uncertainty and changing LV operating conditions.
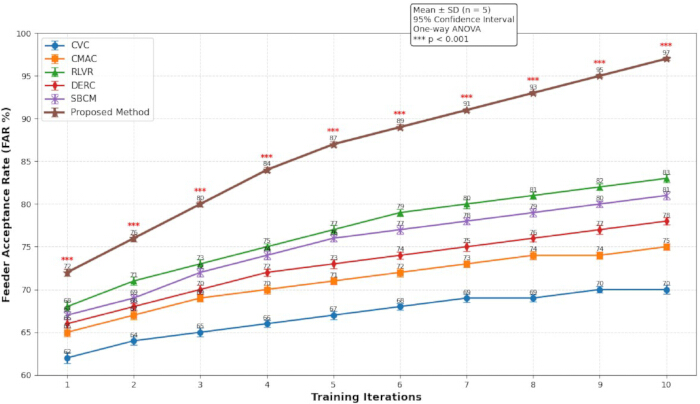
Figure 3: Feeder Acceptance Rate (FAR). Comparison of FAR between the proposed framework and the baseline feeder-coordination methods. Values are presented as mean ± SD by comparing the proposed framework with each baseline method across five independent simulation runs. Statistical significance was evaluated at p < 0.001, with 95% confidence intervals. Abbreviations: FAR, Feeder Acceptance Rate; CVC, Centralized Voltage Control; CMAC, Conventional Multi-Agent Control; RLVR, Reinforcement Learning-Based Voltage Regulation; DERC, Distributed Energy Resource Coordination; SBCM, Sensitivity-Based Congestion Management. Please click here to view a larger version of this figure.
Figure 4 presents the Voltage Compliance Index (VCI). CVC increased from 70% to 77%, whereas CMAC and DERC reached approximately 81% and 84%, respectively. RLVR and SBCM reached 88% and 86%, respectively. The proposed framework increased from 78% during early training to approximately 98% at convergence. The higher VCI indicated that the proposed approach maintained voltage compliance more effectively than the comparison methods under intermittent renewable generation and changing load demand.
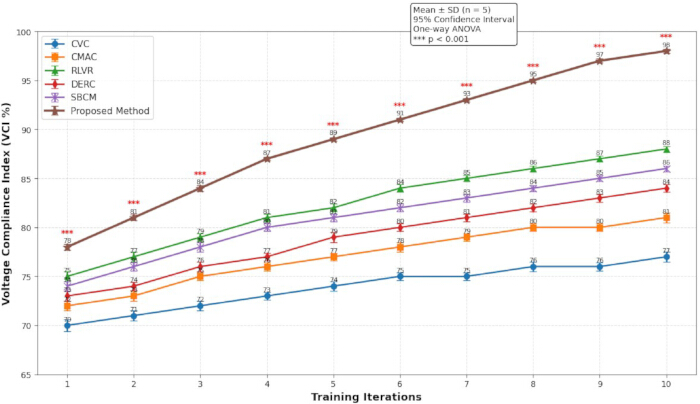
Figure 4: Voltage Compliance Index (VCI). Comparative analysis of VCI under dynamic low-voltage operating conditions. Values are presented as mean ± SD by comparing the proposed framework with each baseline method across five independent simulation runs, with 95% confidence intervals and statistical significance evaluated at p < 0.001. Abbreviations: VCI, Voltage Compliance Index; CVC, Centralized Voltage Control; CMAC, Conventional Multi-Agent Control; RLVR, Reinforcement Learning-Based Voltage Regulation; DERC, Distributed Energy Resource Coordination; SBCM, Sensitivity-Based Congestion Management. Please click here to view a larger version of this figure.
The VCI heatmap in Figure 5 showed the progression of voltage compliance over the training episodes. The proposed framework achieved values between 95% and 98% in later iterations. CVC remained between 70% and 77%, whereas RLVR and SBCM reached approximately 88% and 86%, respectively. The heatmap, therefore, showed that the proposed framework maintained the highest voltage-compliance performance during the later stages of learning.
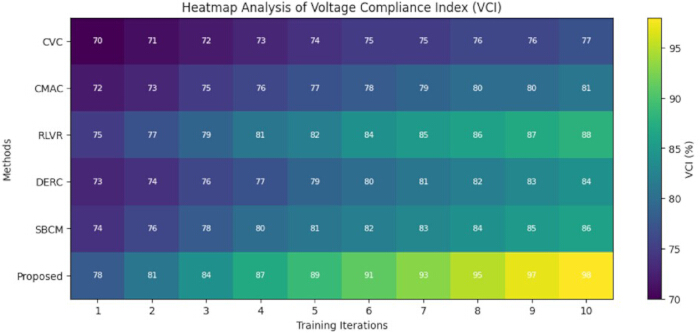
Figure 5: Voltage Compliance Index (VCI) heatmap. Heatmap showing VCI performance across training iterations and feeder-coordination methods. The color scale represents the magnitude of the Voltage Compliance Index, with lighter colors indicating lower VCI values and darker colors indicating higher VCI values. Abbreviations: VCI, Voltage Compliance Index; CVC, Centralized Voltage Control; CMAC, Conventional Multi-Agent Control; RLVR, Reinforcement Learning-Based Voltage Regulation; DERC, Distributed Energy Resource Coordination; SBCM, Sensitivity-Based Congestion Management. Please click here to view a larger version of this figure.
Table 5 presents the Congestion Reduction Rate (CRR). CVC increased from 48% to 63%. CMAC and DERC reached approximately 73% and 75%, respectively, whereas RLVR reached 80% and SBCM reached 82%. The proposed framework increased from 64% at the beginning of training to approximately 96% after convergence. Relative to the final values of the comparison methods, the proposed framework improved CRR by approximately 33% over CVC, 23% over CMAC, 16% over RLVR, 21% over DERC, and 14% over SBCM. These observations showed that the collaborative orchestration policy reduced congestion propagation more effectively than the centralized, conventional multi-agent, voltage-regulation, distributed-resource, and sensitivity-based comparison methods. Figure 6 compares Orchestration Latency (OL). The reported orchestration latency corresponds to the measured wall-clock execution time required by the proposed orchestration algorithm during simulation on the reported hardware platform. It should not be interpreted as the physical operating time of a deployed distribution network. The proposed framework reduced OL from 220 ms to 98 ms. At convergence, CVC, CMAC, RLVR, DERC, and SBCM produced latencies of 283 ms, 253 ms, 215 ms, 242 ms, and 205 ms, respectively. The proposed framework therefore reduced latency by approximately 65%, 61%, 54%, 59%, and 52% relative to CVC, CMAC, RLVR, DERC, and SBCM, respectively. Lower latency indicated that decentralized collaboration enabled faster decisions on feeder orchestration.
| Training Iteration | CVC (%)(Mean ± SD) | CMAC (%)(Mean ± SD) | RLVR (%)(Mean ± SD) | DERC (%)(Mean ± SD) | SBCM (%)(Mean ± SD) | Proposed Method (%)(Mean ± SD) |
| 1 | 48.0 ± 0.5 | 52.0 ± 0.5 | 56.0 ± 0.4 | 54.0 ± 0.5 | 58.0 ± 0.4 | 64.0 ± 0.3 |
| 2 | 50.0 ± 0.5 | 54.0 ± 0.5 | 59.0 ± 0.4 | 56.0 ± 0.5 | 61.0 ± 0.4 | 68.0 ± 0.3 |
| 3 | 52.0 ± 0.5 | 57.0 ± 0.4 | 62.0 ± 0.4 | 59.0 ± 0.5 | 64.0 ± 0.4 | 72.0 ± 0.3 |
| 4 | 54.0 ± 0.4 | 60.0 ± 0.4 | 65.0 ± 0.4 | 62.0 ± 0.4 | 67.0 ± 0.4 | 76.0 ± 0.2 |
| 5 | 56.0 ± 0.4 | 62.0 ± 0.4 | 68.0 ± 0.3 | 64.0 ± 0.4 | 70.0 ± 0.3 | 80.0 ± 0.2 |
| 6 | 58.0 ± 0.4 | 65.0 ± 0.4 | 71.0 ± 0.3 | 67.0 ± 0.4 | 73.0 ± 0.3 | 84.0 ± 0.2 |
| 7 | 60.0 ± 0.4 | 67.0 ± 0.4 | 74.0 ± 0.3 | 69.0 ± 0.3 | 76.0 ± 0.3 | 87.0 ± 0.2 |
| 8 | 61.0 ± 0.4 | 69.0 ± 0.3 | 76.0 ± 0.3 | 71.0 ± 0.3 | 78.0 ± 0.3 | 90.0 ± 0.2 |
| 9 | 62.0 ± 0.4 | 71.0 ± 0.3 | 78.0 ± 0.3 | 73.0 ± 0.3 | 80.0 ± 0.3 | 93.0 ± 0.2 |
| 10 | 63.0 ± 0.4 | 73.0 ± 0.3 | 80.0 ± 0.3 | 75.0 ± 0.3 | 82.0 ± 0.3 | 96.0 ± 0.2 |
Table 5: Congestion Reduction Rate (CRR): Mean ± SD of Congestion Reduction Rate (CRR) from five independent simulation runs comparing the proposed framework with the baseline feeder-orchestration methods. Abbreviations: CRR, Congestion Reduction Rate; CVC, Centralized Voltage Control; CMAC, Conventional Multi-Agent Control; RLVR, Reinforcement Learning-Based Voltage Regulation; DERC, Distributed Energy Resource Coordination; SBCM, Sensitivity-Based Congestion Management.
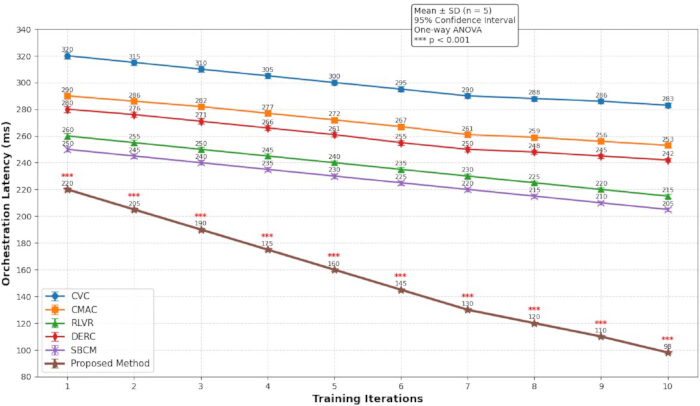
Figure 6: Orchestration Latency (OL). Comparative analysis of orchestration latency during adaptive decentralized feeder coordination. Values are presented as mean ± SD by comparing the proposed framework with each baseline method across from five independent simulation runs, with 95% confidence intervals and statistical significance evaluated at p < 0.001. Abbreviations: OL, Orchestration Latency; CVC, Centralized Voltage Control; CMAC, Conventional Multi-Agent Control; RLVR, Reinforcement Learning-Based Voltage Regulation; DERC, Distributed Energy Resource Coordination; SBCM, Sensitivity-Based Congestion Management. Please click here to view a larger version of this figure.
Figure 7 presents Convergence Speed (CS). CVC increased from 42% to 67% after 20 training episodes. CMAC and DERC reached approximately 74% and 79%, respectively. RLVR reached 87%, and SBCM reached approximately 90%. The proposed framework increased from 58% in the first episode to 98.5% upon convergence, exceeding 93% by the tenth episode. The proposed framework improved final convergence performance by 31.5% over CVC, 24.5% over CMAC, 11.5% over RLVR, 19.5% over DERC, and 8.5% over SBCM. These results showed that the proposed policy reached stable orchestration performance more rapidly than the comparison methods.
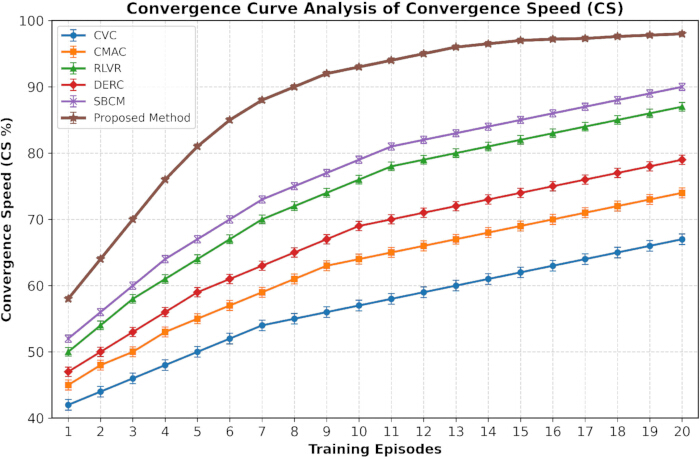
Figure 7: Convergence Speed (CS). Convergence curves showing adaptive learning efficiency and the speed of orchestration convergence across the evaluated methods. Abbreviations: CS, Convergence Speed; CVC, Centralized Voltage Control; CMAC, Conventional Multi-Agent Control; RLVR, Reinforcement Learning-Based Voltage Regulation; DERC, Distributed Energy Resource Coordination; SBCM, Sensitivity-Based Congestion Management. Please click here to view a larger version of this figure.
Collaborative acceptance orchestration and low-latency adaptive decision optimization
Figure 8 presents Decentralized Coordination Efficiency (DCE). CVC produced the lowest DCE at 68%. CMAC reached 75%, DERC reached 79%, RLVR reached 84%, and SBCM reached 88%. The proposed framework achieved a DCE of 97%. The proposed framework exceeded CVC by 29 Percentage points, CMAC by 22 Percentage points, RLVR by 13 Percentage points, DERC by 18 Percentage points, and SBCM by 9 Percentage points. This result showed that local information exchange, neighboring-agent coordination, and decentralized policy optimization supported more effective coordination than the comparison methods.
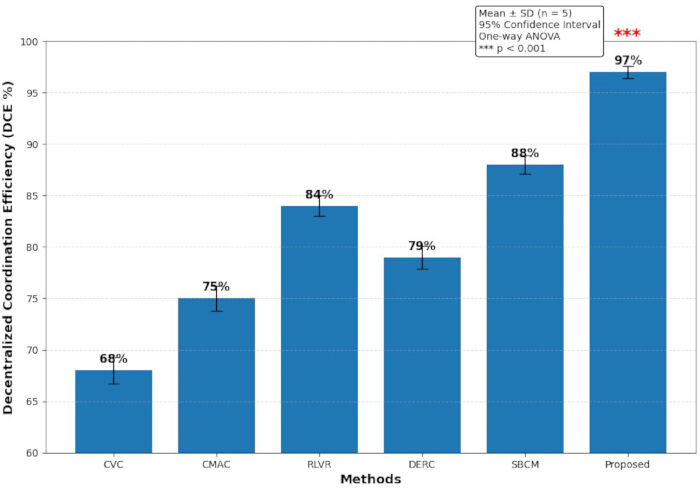
Figure 8: Decentralized Coordination Efficiency (DCE). Comparative analysis of DCE during collaboration among intelligent agents. Values are presented as mean ± SD by comparing the proposed framework with each baseline method across five independent simulation runs, with 95% confidence intervals and statistical significance evaluated at p < 0.001. Abbreviations: DCE, Decentralized Coordination Efficiency; CVC, Centralized Voltage Control; CMAC, Conventional Multi-Agent Control; RLVR, Reinforcement Learning-Based Voltage Regulation; DERC, Distributed Energy Resource Coordination; SBCM, Sensitivity-Based Congestion Management. Please click here to view a larger version of this figure.
Figure 9 and Table 6 present Renewable Accommodation Capability (RAC). CVC increased from 52% to 63%. CMAC and DERC reached approximately 72% and 76%, respectively. RLVR reached approximately 83%, and SBCM reached 86%. The proposed framework increased from 70% at the beginning of learning to 97% at convergence. The proposed framework exceeded CVC by 34 Percentage points, CMAC by 25 Percentage points, RLVR by 14 Percentage points, DERC by 21 Percentage points, and SBCM by 11 Percentage points. These results showed that the proposed orchestration approach accommodated a greater proportion of renewable generation while maintaining feeder operation, voltage performance, and congestion awareness.
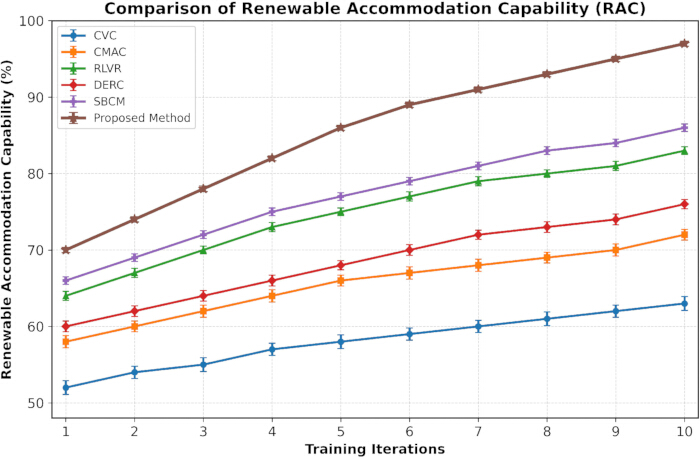
Figure 9: Renewable Accommodation Capability (RAC). Comparative analysis of RAC in renewable-rich feeder systems. Values are presented as mean ± SD by comparing the proposed framework with each baseline method across five independent simulation runs, with 95% confidence intervals and statistical significance evaluated at p < 0.001. Abbreviations: RAC, Renewable Accommodation Capability; CVC, Centralized Voltage Control; CMAC, Conventional Multi-Agent Control; RLVR, Reinforcement Learning-Based Voltage Regulation; DERC, Distributed Energy Resource Coordination; SBCM, Sensitivity-Based Congestion Management. Please click here to view a larger version of this figure.
| Training Iteration | CVC (%) (Mean ± SD) | CMAC (%) (Mean ± SD) | RLVR (%) (Mean ± SD) | DERC (%) (Mean ± SD) | SBCM (%) (Mean ± SD) | Proposed Method (%) (Mean ± SD) |
| 1 | 52.0 ± 0.5 | 58.0 ± 0.5 | 64.0 ± 0.4 | 60.0 ± 0.5 | 66.0 ± 0.4 | 70.0 ± 0.3 |
| 2 | 54.0 ± 0.5 | 60.0 ± 0.5 | 67.0 ± 0.4 | 62.0 ± 0.5 | 69.0 ± 0.4 | 74.0 ± 0.3 |
| 3 | 55.0 ± 0.4 | 62.0 ± 0.4 | 70.0 ± 0.4 | 64.0 ± 0.4 | 72.0 ± 0.4 | 78.0 ± 0.3 |
| 4 | 57.0 ± 0.4 | 64.0 ± 0.4 | 73.0 ± 0.3 | 66.0 ± 0.4 | 75.0 ± 0.3 | 82.0 ± 0.2 |
| 5 | 58.0 ± 0.4 | 66.0 ± 0.4 | 75.0 ± 0.3 | 68.0 ± 0.4 | 77.0 ± 0.3 | 86.0 ± 0.2 |
| 6 | 59.0 ± 0.4 | 67.0 ± 0.4 | 77.0 ± 0.3 | 70.0 ± 0.3 | 79.0 ± 0.3 | 89.0 ± 0.2 |
| 7 | 60.0 ± 0.4 | 68.0 ± 0.3 | 79.0 ± 0.3 | 72.0 ± 0.3 | 81.0 ± 0.3 | 91.0 ± 0.2 |
| 8 | 61.0 ± 0.4 | 69.0 ± 0.3 | 80.0 ± 0.3 | 73.0 ± 0.3 | 83.0 ± 0.3 | 93.0 ± 0.2 |
| 9 | 62.0 ± 0.4 | 70.0 ± 0.3 | 81.0 ± 0.3 | 74.0 ± 0.3 | 84.0 ± 0.3 | 95.0 ± 0.2 |
| 10 | 63.0 ± 0.4 | 72.0 ± 0.3 | 83.0 ± 0.3 | 76.0 ± 0.3 | 86.0 ± 0.3 | 97.0 ± 0.2 |
Table 6: Renewable Accommodation Capability (RAC): Mean ± SD of Renewable Accommodation Capability (RAC) from five independent simulation runs comparing the proposed framework with the baseline feeder-orchestration methods. Abbreviations: RAC, Renewable Accommodation Capability; CVC, Centralized Voltage Control; CMAC, Conventional Multi-Agent Control; RLVR, Reinforcement Learning-Based Voltage Regulation; DERC, Distributed Energy Resource Coordination; SBCM, Sensitivity-Based Congestion Management.
Voltage and congestion sensitivity evaluation
Figure 10 presents Voltage Sensitivity Stability (VSS). CVC increased from 60% to 69%. CMAC and DERC reached approximately 76% and 78%, respectively, whereas RLVR reached 84%. The proposed framework increased from 74% during early training to 98% after convergence. The proposed framework exceeded CVC by 29 Percentage points, CMAC by 22 Percentage points, RLVR by 14 Percentage points, DERC by 20 Percentage points, and SBCM by 12 Percentage points. These results showed that the sensitivity-aware framework maintained stronger voltage-sensitive feeder performance under renewable intermittency, variable load demand, and dynamic congestion.
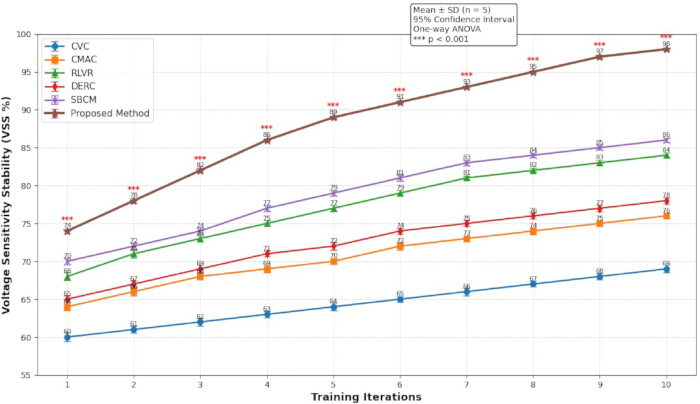
Figure 10: Voltage Sensitivity Stability (VSS). Comparative analysis of voltage-sensitivity stability during adaptive voltage-aware feeder orchestration. Values are presented as mean ± SD by comparing the proposed framework with each baseline method across five independent simulation runs, with 95% confidence intervals and statistical significance evaluated at p < 0.001. Abbreviations: VSS, Voltage Sensitivity Stability; CVC, Centralized Voltage Control; CMAC, Conventional Multi-Agent Control; RLVR, Reinforcement Learning-Based Voltage Regulation; DERC, Distributed Energy Resource Coordination; SBCM, Sensitivity-Based Congestion Management. Please click here to view a larger version of this figure.
Figure 11 presents the Congestion Sensitivity Index (CSI). CVC increased from 52% to 63%. CMAC and DERC reached 72% and 76%, respectively. RLVR reached approximately 83%, and SBCM reached approximately 86%. The proposed framework increased from 72% during early training to approximately 98% at the end of training. The proposed framework exceeded CVC by approximately 35 percentage points, CMAC by 26 percentage points, RLVR by 15 percentage points, DERC by 22 percentage points, and SBCM by 12 percentage points. The heatmap showed that the proposed approach maintained the highest congestion-sensitivity performance during the later training episodes.
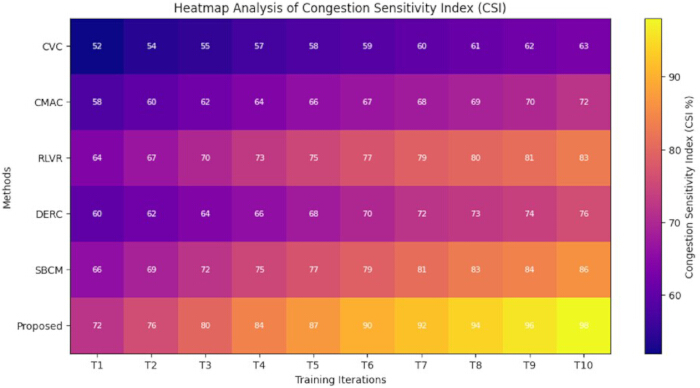
Figure 11: Congestion Sensitivity Index (CSI) heatmap. Heatmap showing congestion-sensitivity performance across training stages and feeder-coordination methods. The color scale represents the magnitude of the Congestion Sensitivity Index, with lighter colors indicating lower CSI values and darker colors indicating higher CSI values. Abbreviations: CSI, Congestion Sensitivity Index; CVC, Centralized Voltage Control; CMAC, Conventional Multi-Agent Control; RLVR, Reinforcement Learning-Based Voltage Regulation; DERC, Distributed Energy Resource Coordination; SBCM, Sensitivity-Based Congestion Management. Please click here to view a larger version of this figure.
Large-scale validation
Figure 12 and Table 7 present the Feeder Stability Index (FSI). CVC produced an average FSI of 64.7%, whereas CMAC and DERC produced averages of 72.5% and 76.0%, respectively. RLVR produced an average FSI of 81.5%. The proposed framework achieved 97% voltage stability, 96% congestion control, 95% renewable-integration capacity, 94% load-balancing efficiency, 98% coordination efficiency, and 97% response speed. These component values produced an average FSI of approximately 96.2%. The proposed framework improved the average FSI by approximately 31.5 Percentage points over CVC, 23.7 Percentage points over CMAC, 14.7 Percentage points over RLVR, 20.2 Percentage points over DERC, and 11.7 Percentage points over SBCM. The balanced component values showed that the framework maintained performance across voltage stability, congestion management, renewable integration, load balancing, coordination efficiency, and response speed. For every simulation run, the arithmetic mean of the six performance components—Voltage Stability, Congestion Control, Renewable Integration, Load Balancing, Coordination Efficiency, and Response Speed—was used to determine the overall FSI. The five separate simulation runs were used to calculate the stated mean and standard deviation.
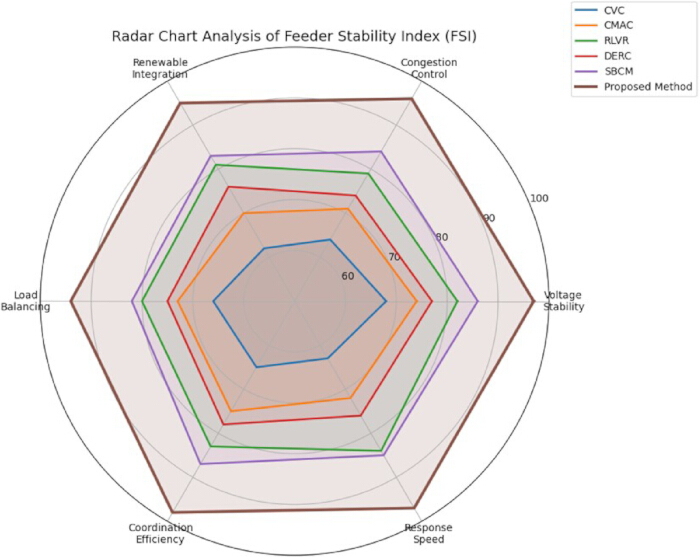
Figure 12: Feeder Stability Index (FSI). Radar-chart comparison of the Feeder Stability Index for the proposed framework and the baseline methods across six performance components: Voltage Stability, Congestion Control, Renewable Integration, Load Balancing, Coordination Efficiency, and Response Speed. Higher values indicate better performance for each component. Abbreviations: FSI, Feeder Stability Index; CVC, Centralized Voltage Control; CMAC, Conventional Multi-Agent Control; RLVR, Reinforcement Learning-Based Voltage Regulation; DERC, Distributed Energy Resource Coordination; SBCM, Sensitivity-Based Congestion Management. Please click here to view a larger version of this figure.
| Evaluation Parameter | CVC (%) (Mean ± SD) | CMAC (%) (Mean ± SD) | RLVR (%) (Mean ± SD) | DERC (%) (Mean ± SD) | SBCM (%) (Mean ± SD) | Proposed Method (%) (Mean ± SD) |
| Voltage Stability | 68.0 ± 0.6 | 74.0 ± 0.5 | 82.0 ± 0.4 | 77.0 ± 0.5 | 86.0 ± 0.3 | 97.0 ± 0.2 |
| Congestion Control | 64.0 ± 0.6 | 71.0 ± 0.5 | 79.0 ± 0.4 | 74.0 ± 0.5 | 84.0 ± 0.3 | 96.0 ± 0.2 |
| Renewable Integration | 62.0 ± 0.5 | 70.0 ± 0.5 | 81.0 ± 0.4 | 76.0 ± 0.4 | 83.0 ± 0.3 | 95.0 ± 0.2 |
| Load Balancing | 66.0 ± 0.5 | 73.0 ± 0.4 | 80.0 ± 0.4 | 75.0 ± 0.4 | 82.0 ± 0.3 | 94.0 ± 0.2 |
| Coordination Efficiency | 65.0 ± 0.5 | 75.0 ± 0.4 | 83.0 ± 0.3 | 78.0 ± 0.4 | 87.0 ± 0.3 | 98.0 ± 0.2 |
| Response Speed | 63.0 ± 0.5 | 72.0 ± 0.4 | 84.0 ± 0.3 | 76.0 ± 0.4 | 85.0 ± 0.3 | 97.0 ± 0.2 |
| Average FSI Score | 64.7 ± 0.5 | 72.5 ± 0.5 | 81.5 ± 0.4 | 76.0 ± 0.4 | 84.5 ± 0.3 | 96.2 ± 0.2 |
Table 7: Feeder Stability Index (FSI): Mean ± SD of Feeder Stability Index (FSI) from five independent simulation runs based on Voltage Stability, Congestion Control, Renewable Integration, Load Balancing, Coordination Efficiency, and Response Speed. Abbreviations: FSI, Feeder Stability Index; CVC, Centralized Voltage Control; CMAC, Conventional Multi-Agent Control; RLVR, Reinforcement Learning-Based Voltage Regulation; DERC, Distributed Energy Resource Coordination; SBCM, Sensitivity-Based Congestion Management.
Figure 13 presents Load Balancing Efficiency (LBE). CVC achieved an overall LBE of approximately 68%, comprising 42% balanced load distribution, 18% moderate load stability, and 8% dynamic adaptive balancing. CMAC and DERC achieved overall values of approximately 80% and 86%, respectively. RLVR reached approximately 92%, and SBCM reached approximately 96%. The proposed framework achieved an overall LBE of approximately 98%, comprising 72% balanced load distribution, 20% moderate load stability, and 6% dynamic adaptive balancing. This result showed that the proposed approach maintained the highest overall load-balancing performance among the evaluated methods.
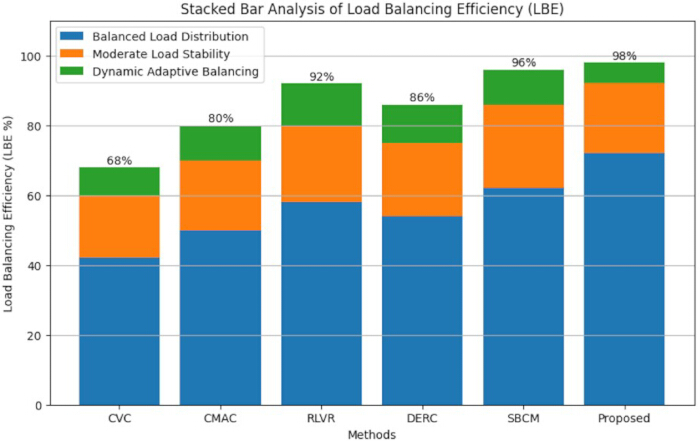
Figure 13: Load Balancing Efficiency (LBE). Stacked-bar comparison of Load Balancing Efficiency for the proposed framework and the baseline methods. Each stacked bar consists of three performance components: Balanced Load Distribution, Moderate Load Stability, and Dynamic Adaptive Balancing, whose combined values represent the overall LBE for each method. Higher total values indicate better load-balancing performance. Abbreviations: LBE, Load Balancing Efficiency; CVC, Centralized Voltage Control; CMAC, Conventional Multi-Agent Control; RLVR, Reinforcement Learning-Based Voltage Regulation; DERC, Distributed Energy Resource Coordination; SBCM, Sensitivity-Based Congestion Management. Please click here to view a larger version of this figure.
Figure 14 presents Renewable Utilization Efficiency (RUE). CVC increased from 50% to 61%. CMAC and DERC reached 70% and 75%, respectively. RLVR reached 82%, and SBCM reached 86%. The proposed framework increased from 72% during early training to approximately 98% at convergence. The proposed framework exceeded CVC by approximately 37 Percentage points, CMAC by 28 Percentage points, RLVR by 16 Percentage points, DERC by 23 Percentage points, and SBCM by 12 Percentage points. The higher RUE showed that the proposed orchestration policy used a greater proportion of available renewable generation under changing load and congestion conditions.
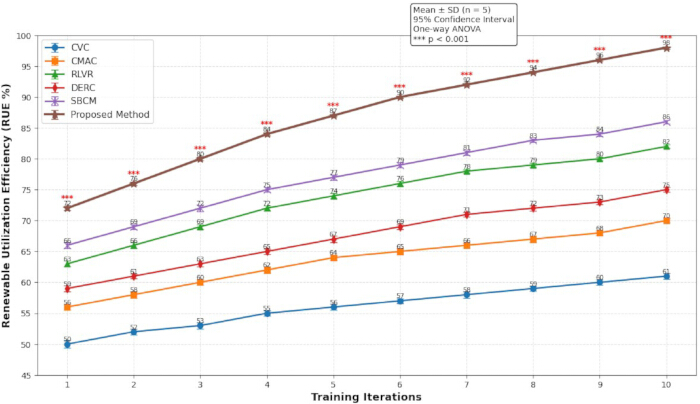
Figure 14: Renewable Utilization Efficiency (RUE). Comparative analysis of RUE during low-voltage feeder orchestration. Values are presented as mean ± SD by comparing the proposed framework with each baseline method across five independent simulation runs, with 95% confidence intervals and statistical significance evaluated at p < 0.001. Abbreviations: RUE, Renewable Utilization Efficiency; CVC, Centralized Voltage Control; CMAC, Conventional Multi-Agent Control; RLVR, Reinforcement Learning-Based Voltage Regulation; DERC, Distributed Energy Resource Coordination; SBCM, Sensitivity-Based Congestion Management. Please click here to view a larger version of this figure.
Figure 15 and Table 8 present Adaptive Decision Accuracy (ADA). The proposed framework increased from 78% to 99%. CVC, CMAC, RLVR, DERC, and SBCM converged to 68%, 76%, 86%, 79%, and 88%, respectively. The proposed framework exceeded CVC by approximately 31 Percentage points, CMAC by 23 Percentage points, RLVR by 13 Percentage points, DERC by 20 Percentage points, and SBCM by 11 Percentage points. The higher ADA indicated that the collaborative agents selected more accurate orchestration decisions under renewable-rich LV operating conditions.
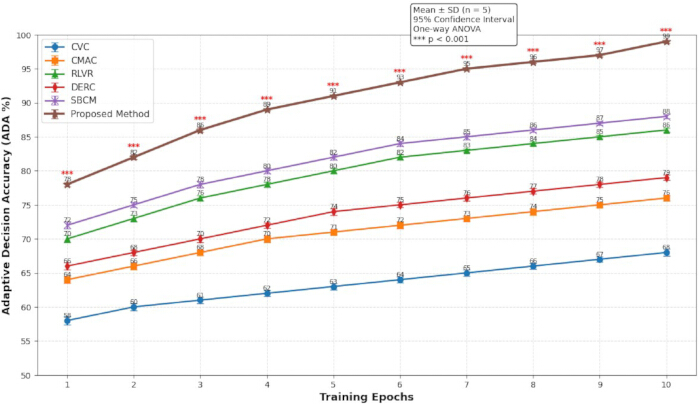
Figure 15: Adaptive Decision Accuracy (ADA). Comparative analysis of ADA for the proposed orchestration framework and the baseline methods. Values are presented as mean ± SD by comparing the proposed framework with each baseline method across five independent simulation runs, with 95% confidence intervals and statistical significance evaluated at p < 0.001. Abbreviations: ADA, Adaptive Decision Accuracy; CVC, Centralized Voltage Control; CMAC, Conventional Multi-Agent Control; RLVR, Reinforcement Learning-Based Voltage Regulation; DERC, Distributed Energy Resource Coordination; SBCM, Sensitivity-Based Congestion Management. Please click here to view a larger version of this figure.
| Training Epoch | CVC (%) (Mean ± SD) | CMAC (%) (Mean ± SD) | RLVR (%) (Mean ± SD) | DERC (%) (Mean ± SD) | SBCM (%) (Mean ± SD) | Proposed Method (%) (Mean ± SD) |
| 1 | 58.0 ± 0.5 | 64.0 ± 0.5 | 70.0 ± 0.4 | 66.0 ± 0.5 | 72.0 ± 0.4 | 78.0 ± 0.3 |
| 2 | 60.0 ± 0.5 | 66.0 ± 0.5 | 73.0 ± 0.4 | 68.0 ± 0.5 | 75.0 ± 0.4 | 82.0 ± 0.3 |
| 3 | 61.0 ± 0.4 | 68.0 ± 0.4 | 76.0 ± 0.4 | 70.0 ± 0.4 | 78.0 ± 0.4 | 86.0 ± 0.2 |
| 4 | 62.0 ± 0.4 | 70.0 ± 0.4 | 78.0 ± 0.3 | 72.0 ± 0.4 | 80.0 ± 0.3 | 89.0 ± 0.2 |
| 5 | 63.0 ± 0.4 | 71.0 ± 0.4 | 80.0 ± 0.3 | 74.0 ± 0.4 | 82.0 ± 0.3 | 91.0 ± 0.2 |
| 6 | 64.0 ± 0.4 | 72.0 ± 0.4 | 82.0 ± 0.3 | 75.0 ± 0.3 | 84.0 ± 0.3 | 93.0 ± 0.2 |
| 7 | 65.0 ± 0.4 | 73.0 ± 0.3 | 83.0 ± 0.3 | 76.0 ± 0.3 | 85.0 ± 0.3 | 95.0 ± 0.2 |
| 8 | 66.0 ± 0.4 | 74.0 ± 0.3 | 84.0 ± 0.3 | 77.0 ± 0.3 | 86.0 ± 0.3 | 96.0 ± 0.2 |
| 9 | 67.0 ± 0.4 | 75.0 ± 0.3 | 85.0 ± 0.3 | 78.0 ± 0.3 | 87.0 ± 0.3 | 97.0 ± 0.2 |
| 10 | 68.0 ± 0.4 | 76.0 ± 0.3 | 86.0 ± 0.3 | 79.0 ± 0.3 | 88.0 ± 0.3 | 99.0 ± 0.2 |
Table 8: Adaptive Decision Accuracy (ADA): Mean ± SD of Adaptive Decision Accuracy (ADA) from five independent simulation runs comparing the proposed intelligent feeder-orchestration framework with the baseline methods. Abbreviations: ADA, Adaptive Decision Accuracy; CVC, Centralized Voltage Control; CMAC, Conventional Multi-Agent Control; RLVR, Reinforcement Learning-Based Voltage Regulation; DERC, Distributed Energy Resource Coordination; SBCM, Sensitivity-Based Congestion Management.
Table 9 presents System Reliability Improvement (SRI). CVC increased from 60% to 69%. CMAC reached approximately 78%, DERC approximately 81%, RLVR approximately 86%, and SBCM approximately 88%. The proposed framework increased from 80% during early learning to approximately 99% at convergence. The proposed framework exceeded CVC by approximately 30 Percentage points, CMAC by 21 Percentage points, RLVR by 13 Percentage points, DERC by 18 Percentage points, and SBCM by 11 Percentage points. The higher SRI showed that the proposed framework maintained feeder continuity, voltage stability, congestion control, and adaptive renewable integration more effectively than the comparison methods.
| Training Iteration | CVC (%) (Mean ± SD) | CMAC (%) (Mean ± SD) | RLVR (%) (Mean ± SD) | DERC (%) (Mean ± SD) | SBCM (%) (Mean ± SD) | Proposed Method (%) (Mean ± SD) |
| 1 | 60.0 ± 0.5 | 66.0 ± 0.5 | 72.0 ± 0.4 | 68.0 ± 0.5 | 75.0 ± 0.4 | 80.0 ± 0.3 |
| 2 | 61.0 ± 0.5 | 68.0 ± 0.5 | 74.0 ± 0.4 | 70.0 ± 0.5 | 77.0 ± 0.4 | 84.0 ± 0.3 |
| 3 | 62.0 ± 0.4 | 70.0 ± 0.4 | 76.0 ± 0.4 | 72.0 ± 0.4 | 79.0 ± 0.4 | 87.0 ± 0.2 |
| 4 | 63.0 ± 0.4 | 72.0 ± 0.4 | 78.0 ± 0.3 | 74.0 ± 0.4 | 81.0 ± 0.3 | 90.0 ± 0.2 |
| 5 | 64.0 ± 0.4 | 73.0 ± 0.4 | 80.0 ± 0.3 | 76.0 ± 0.4 | 83.0 ± 0.3 | 92.0 ± 0.2 |
| 6 | 65.0 ± 0.4 | 74.0 ± 0.4 | 82.0 ± 0.3 | 77.0 ± 0.3 | 84.0 ± 0.3 | 94.0 ± 0.2 |
| 7 | 66.0 ± 0.4 | 75.0 ± 0.3 | 83.0 ± 0.3 | 78.0 ± 0.3 | 85.0 ± 0.3 | 95.0 ± 0.2 |
| 8 | 67.0 ± 0.4 | 76.0 ± 0.3 | 84.0 ± 0.3 | 79.0 ± 0.3 | 86.0 ± 0.3 | 96.0 ± 0.2 |
| 9 | 68.0 ± 0.4 | 77.0 ± 0.3 | 85.0 ± 0.3 | 80.0 ± 0.3 | 87.0 ± 0.3 | 97.0 ± 0.2 |
| 10 | 69.0 ± 0.4 | 78.0 ± 0.3 | 86.0 ± 0.3 | 81.0 ± 0.3 | 88.0 ± 0.3 | 99.0 ± 0.2 |
Table 9: System Reliability Improvement (SRI): Mean ± SD of System Reliability Improvement (SRI) from five independent simulation runs under renewable-rich low-voltage distribution conditions. Abbreviations: SRI, System Reliability Improvement; CVC, Centralized Voltage Control; CMAC, Conventional Multi-Agent Control; RLVR, Reinforcement Learning-Based Voltage Regulation; DERC, Distributed Energy Resource Coordination; SBCM, Sensitivity-Based Congestion Management.
The proposed framework was evaluated under varied conditions of renewable generation, load demand, voltage, and congestion using the FeederBW and 236-bus LV datasets. Feeder acceptance, voltage compliance, congestion reduction, orchestration latency, convergence speed, decentralized coordination, renewable accommodation, voltage sensitivity, congestion sensitivity, feeder stability, load balancing, renewable utilization, decision accuracy, and system reliability were assessed.
Across these measures, the proposed framework produced the highest final values for FAR, VCI, CRR, CS, DCE, RAC, VSS, CSI, FSI, LBE, RUE, ADA, and SRI, and the lowest OL. Because the baseline methods were evaluated on the same datasets, operating scenarios, simulation environment, stopping criteria, and evaluation metrics, these comparisons supported the hypothesis that collaborative multi-agent reinforcement learning, combined with voltage- and congestion-sensitivity evaluation, improved adaptive feeder acceptance relative to the evaluated centralized and distributed comparison methods.
The results showed that the Dynamic Orchestration Strategy improved feeder acceptance, voltage compliance, congestion reduction, renewable accommodation, load balancing, decentralized coordination, decision accuracy, and system reliability while reducing orchestration latency. The framework also converged more rapidly than the comparison methods. Under the evaluated simulation conditions, these findings supported the proposed hypothesis that collaborative, sensitivity-aware, decentralized reinforcement learning could improve low-voltage feeder orchestration under renewable-generation uncertainty and changing load and congestion conditions.
DATA AVAILABILITY:
The FeederBW dataset is publicly available at https://doi.org/10.5281/zenodo.17831177, and the 236-Bus Low-Voltage Distribution Network dataset is publicly available at https://doi.org/10.5281/zenodo.8274780. The Python implementation developed for this study, together with the simulation framework, preprocessing modules, multi-agent reinforcement learning environment, model training and evaluation scripts, configuration files, and input data formats required to reproduce the proposed methodology, has been deposited in Zenodo and is publicly available at https://doi.org/10.5281/zenodo.21423239. The repository supports reproducibility of the methodology and experiments reported in this study.
Supplementary File 1. Mathematical derivations, algorithm, and implementation details of the proposed Dynamic Orchestration Strategy. This supplementary file provides the mathematical formulations supporting each stage of the proposed framework, including data preprocessing, dynamic low-voltage network modeling, multi-agent environment initialization, reinforcement-driven agent learning, voltage- and congestion-sensitivity evaluation, collaborative feeder acceptance orchestration, and performance evaluation metrics. It also includes Algorithm 1, which describes the collaborative feeder acceptance orchestration procedure, together with the mathematical definitions of the evaluation metrics used in this study.Please click here to download this file.
Discussion
The experimental findings showed that the proposed Dynamic Orchestration Strategy improved decentralized feeder coordination, renewable energy integration, voltage stability, congestion management, and low-latency orchestration compared with Centralized Voltage Control (CVC)33, Conventional Multi-Agent Control (CMAC)21, Reinforcement Learning-Based Voltage Regulation (RLVR)20, Distributed Energy Resource Coordination (DERC)26, and Sensitivity-Based Congestion Management (SBCM)34. Across the evaluated Feeder Acceptance Rate (FAR), Voltage Compliance Index (VCI), Congestion Reduction Rate (CRR), Decentralized Coordination Efficiency (DCE), Renewable Utilization Efficiency (RUE), Adaptive Decision Accuracy (ADA), and System Reliability Improvement (SRI), the proposed framework achieved higher performance under the tested conditions. Results obtained using the FeederBW and 236-bus low-voltage (LV) datasets indicated that combining collaborative multi-agent reinforcement learning with voltage- and congestion-sensitivity assessment improved the efficiency and speed of adaptive feeder orchestration.
The comparative analysis also showed that centralized and rule-based coordination methods had slower orchestration responses, lower renewable accommodation capability, reduced adaptive coordination efficiency, and more limited scalability under changing feeder conditions33,34. Although RLVR and SBCM performed better than other comparison methods because of their reinforcement-learning and sensitivity-aware congestion-management components, they did not provide a collaborative and decentralized feeder-acceptance orchestration mechanism. By contrast, the proposed framework combined collaborative intelligent agents, sensitivity-aware feeder prioritization, adaptive orchestration optimization, and decentralized policy learning. Its faster convergence and higher stability indicators suggested that this combined structure supported feeder operation under variable renewable-generation, load, voltage, and congestion conditions.
The decentralized multi-agent reinforcement learning architecture distributed decision-making among feeder-level agents rather than relying on a single centralized controller. As the distribution network increased in size, individual agents performed local computations and exchanged only the coordination information required by neighboring agents. This arrangement reduced centralized computational bottlenecks and communication overhead and thereby supported scalability35. The framework may therefore be applicable to larger networks with higher renewable penetration, additional feeder segments, and greater operational complexity. However, very large-scale deployment would require further optimization of distributed computing resources and communication protocols.
The study also contributed a decentralized learning-based approach to low-voltage feeder management. Unlike conventional voltage-control and congestion-management methods based mainly on static operating rules or centralized optimization33, the proposed strategy integrated voltage-sensitivity assessment, congestion-aware orchestration, reinforcement-driven policy optimization, dynamic feeder-acceptance ranking, and communication among collaborative agents. This integration extended the use of multi-agent reinforcement learning from voltage regulation and resource coordination to adaptive feeder-acceptance orchestration in renewable-rich LV distribution networks.
The proposed method may support feeder-acceptance management for utilities, smart-grid operators, and renewable-energy management systems. Nevertheless, several challenges must be addressed before practical implementation. Communication delays may affect the speed of information exchange and coordination among distributed agents, particularly in large-scale networks. Secure communication and cybersecurity measures will also be required to protect agent interactions and operational data from unauthorized access and cyberattacks. Integration with existing Distribution Management Systems will require interoperability with utility communication protocols, supervisory-control architectures, and operational procedures. Practical implementation will therefore depend on low-latency communication structures, secure data transmission, standardized interfaces, and field validation36,37.
The study was limited by its reliance on the FeederBW and 236-bus LV datasets and by simulation-based validation under predefined operating and communication conditions. These settings may not fully represent the topology, disturbances, communication failures, or cyber-physical events encountered in real utility networks. Computational complexity may also become more significant under very large-scale or highly renewable operating conditions. Future work should therefore evaluate the framework using additional utility-scale datasets, real distribution networks, hardware-in-the-loop platforms, and field-scale pilot installations. It will focus on validating the proposed framework using hardware-in-the-loop platforms, real utility networks, and larger distribution systems. In addition, future studies will investigate advanced reinforcement-learning architectures and improved distributed coordination strategies to further enhance scalability and operational robustness. Overall, the simulation results showed that collaborative multi-agent reinforcement learning combined with voltage- and congestion-sensitivity evaluation could improve feeder acceptance, voltage compliance, congestion mitigation, renewable integration, decentralized coordination, convergence, latency, and adaptive decision-making. Additional testing with real utility data, realistic communication delays, cyber-physical disruptions, and hardware-in-the-loop or field-test conditions is required to confirm practical scalability and operational reliability.
Disclosures
The authors declare that they have no competing interests.
Acknowledgements
This research was supported by the Guangzhou Power Supply Bureau of Guangdong Power Grid Company through the project “Research on Automation Acceptance Technology of Low Voltage Metering Equipment Based on Process Automation” (Project Code: 030100KC24120100).
Materials
| Name | Company | Catalog Number | Comments |
|---|---|---|---|
| 236-Bus Low-Voltage Distribution Network Dataset | Canizes et al. | DOI: 10.5281/zenodo.8274780 | Public benchmark dataset used for scalability analysis and large-scale validation of the proposed framework |
| Central Processing Unit (CPU) | Intel Corporation | Intel Core i9-12900K (16-Core) | Used for simulation management and environment execution |
| Congestion Sensitivity Analysis Module | Custom-developed Module | Zenodo DOI: 10.5281/zenodo.21423239 | Performs real-time congestion sensitivity computation and feeder prioritization |
| CUDA Toolkit | NVIDIA Corporation | CUDA 12.1 | GPU computing platform used for accelerated PyTorch model training |
| cuDNN Library | NVIDIA Corporation | cuDNN 9.3.0 | Deep neural network acceleration library used with CUDA |
| Custom Dynamic LV Network Simulator | Custom-developed Module | Version 1.0 | Author-developed simulation platform implemented using Python and PyTorch for dynamic feeder orchestration experiments. Implementation details are provided in the Methods and Data Availability sections. |
| Data Processing Library | pandas Development Team | pandas 2.2.2 | Used for preprocessing, feature extraction, normalization, and time-series data management |
| Deep Learning Framework | PyTorch Foundation | PyTorch 2.3.1 | Used for multi-agent reinforcement learning (MARL) model implementation, neural network training, and policy optimization |
| Distributed Agent Communication Module | Custom-developed Framework | Zenodo DOI: 10.5281/zenodo.21423239 | Enables decentralized communication and collaborative policy exchange among intelligent agents |
| FeederBW Dataset | Treutlein et al. | DOI: 10.5281/zenodo.17831177 | Public dataset containing real-world low-voltage feeder measurements, renewable generation, and operating profiles |
| Graphics Processing Unit (GPU) | NVIDIA Corporation | GeForce RTX 3090, 24 GB GDDR6X | Hardware accelerator used for neural network training and parallel computation |
| Multi-Agent Reinforcement Learning Environment | Farama Foundation | Gym 0.26.2 | Customized reinforcement learning environment for collaborative intelligent-agent interaction and training |
| Numerical Computing Library | NumPy Developers | NumPy 1.26.4 | Used for numerical computations, tensor manipulation, and matrix operations |
| Operating System | Canonical Ltd. | Ubuntu 22.04.5 LTS (64-bit) | Operating system used for all simulations and reinforcement learning experiments |
| Python Programming Language | Python Software Foundation | Python 3.11.9 | Primary programming language used for algorithm implementation, simulation, and model development |
| System Memory | Lenovo | 64 GB DDR5 RAM | Installed system memory used for large-scale MARL simulation and data processing. |
| Voltage Stability Monitoring Module | Custom-developed Module | Zenodo DOI: 10.5281/zenodo.21423239 | Continuously evaluates voltage stability and compliance during feeder orchestration |
References
- Ahmed F, et al. A multi-agent reinforcement learning framework for voltage-constrained incentive demand response in PV-rich low-voltage distribution systems. IEEE Access. 2026;14:45410–22.
- Lamsal D, Sreeram V, Mishra Y, Kumar DS. Smoothing control strategy of wind and photovoltaic output power fluctuation by considering the state of health of battery energy storage system. IET Renew Power Gener. 2019;13:578–86.
- Allahmoradi S, et al. Data-driven Volt/VAR optimization for modern distribution networks: A review. IEEE Access. 2024;12:71184–204.
- O'Connell N, Pinson P, Madsen H, O'Malley M. Benefits and challenges of electrical demand response: A critical review. Renew Sustain Energy Rev. 2014;39:686–99.
- Hossain MS, Madlool NA, Al-Fatlawi AW, El Haj Assad M. High penetration of solar photovoltaic structure on the grid system disruption: An overview of technology advancement. Sustainability. 2023;15:1174. https://doi.org/10.3390/su15021174
- Rahmouni A. Impact of static reactive power compensator (SVC) on the power grid. WSEAS Trans Electron. 2020;11:96–104.
- Chandran CV, et al. Application of demand response to improve voltage regulation with high DG penetration. Electr Power Syst Res. 2020;189:106722. https://doi.org/10.1016/j.epsr.2020.106722
- Wang Q, et al. A demand response strategy in high photovoltaic penetration power systems considering the thermal ramp rate limitation. IEEE Access. 2019;7:163814–22.
- Wang Z, et al. How to effectively implement an incentive-based residential electricity demand response policy? Experience from large-scale trials and matching questionnaires. Energy Policy. 2020;141:111450. https://doi.org/10.1016/j.enpol.2020.111450
- van Tilburg J, Siebert LC, Cremer JL. MARL-iDR: Multi-agent reinforcement learning for incentive-based residential demand response. arXiv. 2023. https://arxiv.org/abs/2304.04086
- Bahrami S, Chen YC, Wong VWS. Deep reinforcement learning for demand response in distribution networks. IEEE Trans Smart Grid. 2021;12:1496–506.
- Li J, et al. Model-free reinforcement learning economic dispatch algorithms for price-based residential demand response management system. IEEE Trans Ind Cyber-Phys Syst. 2023;1:123–35.
- Zheng S, et al. Incentive-based integrated demand response for multiple energy carriers under complex uncertainties and double coupling effects. Appl Energy. 2021;283:116254. https://doi.org/10.1016/j.apenergy.2020.116254
- Nainar K, Pillai JR, Bak-Jensen B. Incentive price-based demand response in active distribution grids. Appl Sci. 2020;11:1–17.
- Nguyen Duc T, et al. Impact of renewable energy integration on a novel method for pricing incentive payments of incentive-based demand response program. IET Gener Transm Distrib. 2022;16:1648–67.
- Pourramezan A, Samadi M. A novel approach for incorporating incentive-based and price-based demand response programs in long-term generation investment planning. Int J Electr Power Energy Syst. 2022;142:108315. https://doi.org/10.1016/j.ijepes.2022.108315
- Mathew A, Roy A, Mathew J. Intelligent residential energy management system using deep reinforcement learning. IEEE Syst J. 2020;14:5362–72.
- Khan DA, Arshad A, Lehtonen M, Mahmoud K. Combined DR pricing and voltage control using reinforcement learning based multi-agents and load forecasting. IEEE Access. 2022;10:130839-49.
- Zhang X, et al. An edge-cloud integrated solution for buildings demand response using reinforcement learning. IEEE Trans Smart Grid. 2021;12:420–31.
- Duan J, et al. Deep-reinforcement-learning-based autonomous voltage control for power grid operations. IEEE Trans Power Syst. 2020;35:814–7.
- Wang S, et al. A data-driven multi-agent autonomous voltage control framework using deep reinforcement learning. IEEE Trans Power Syst. 2020;35:4644–54.
- Turitsyn K, Sulc P, Backhaus S, Chertkov M. Options for control of reactive power by distributed photovoltaic generators. Proc IEEE. 2011;99:1063–73.
- Bedawy A, et al. Optimal voltage control strategy for voltage regulators in active unbalanced distribution systems using multi-agents. IEEE Trans Power Syst. 2020;35:1023–35.
- Bedawy A, Yorino N, Mahmoud K. Management of voltage regulators in unbalanced distribution networks using voltage/tap sensitivity analysis. Presented at: International Conference on Innovative Trends in Computer Engineering (ITCE); Aswan, Egypt; 2018. https://doi.org/10.1109/itce.2018.8316651
- Smith O, et al. The effect of renewable energy incorporation on power grid stability and resilience. Sci Adv. 2022;8:eabj6734. https://doi.org/10.1126/sciadv.abj6734
- Charbonnier F, Morstyn T, McCulloch MD. Scalable multi-agent reinforcement learning for distributed control of residential energy flexibility. Applied Energy. 2022;314:118825. doi:10.1016/j.apenergy.2022.118825
- Dugan J, Mohagheghi S, Kroposki B. Application of mobile energy storage for enhancing power grid resilience: A review. Energies. 2021;14:6476. https://doi.org/10.3390/en14206476
- Panossian N, et al. Challenges and opportunities of integrating electric vehicles in electricity distribution systems. Curr Sustain Renew Energy Rep. 2022;9:27–40.
- Guan Q, et al. Dynamic-aware deep reinforcement learning for heterogeneous fleet-based capacitated electric vehicle routing problems. Applied Energy. 2026;413:127757. https://doi.org/10.1016/j.apenergy.2026.127757
- Guan Q, et al. Heterogeneous attention-driven deep reinforcement learning for solving EVRPs with pickup-delivery and time windows. Applied Energy. 2026;407:127355. https://doi.org/10.1016/j.apenergy.2026.127355
- Treutlein M, et al. Real-world energy data of 200 feeders from low-voltage grids with metadata in Germany over two years (Version v1.0) [Data set]. Zenodo; 2025. https://doi.org/10.5281/zenodo.17831177
- Canizes B, Castro F, Silveira V, Vale Z. 236-Bus Low Voltage Distribution Network Data [Data set]. Zenodo; 2023. https://doi.org/10.5281/zenodo.8274780
- Xi, Haikuo & Chen, Can & Bai, Xuesong & Ma, Yuan & Ding, Jiachao & Chen, Qifang. (2024). Centralized and decentralized combined voltage control for distribution network with high penetration PV connected. Journal of Physics: Conference Series. 2771. 012040. 10.1088/1742-6596/2771/1/012040.
- Singh AK, Parida SK. Congestion management with distributed generation and its impact on electricity market. International Journal of Electrical Power & Energy Systems. 2013;48:39–47. doi:10.1016/j.ijepes.2012.11.025.
- Gooi HB, Wang T, Tang Y. Edge intelligence for smart grid: A survey on application potentials. CSEE Journal of Power and Energy Systems. 2023;9(5):1623–1640. https://doi.org/10.17775/CSEEJPES.2022.02210
- Molokomme DN, Onumanyi AJ, Abu-Mahfouz AM. Edge intelligence in smart grids: A survey on architectures, offloading models, cyber security measures, and challenges. Journal of Sensor and Actuator Networks. 2022;11(3):47. https://doi.org/10.3390/jsan11030047
- Chang Z, Liu S, Xiong X, Cai Z, Tu G. A survey of recent advances in edge-computing-powered artificial intelligence of things. IEEE Internet of Things Journal. 2021;8(18):13849–13875.