This study evaluates a large-space co-located collaborative virtual reality training protocol by comparing spatial presence, team coordination, learning engagement, cognitive load, safety, and short-term learning outcomes across three training conditions.
Research Article
Comparative Evaluation of Desktop, Room-Scale, and Large-Space Co-Located Collaborative Virtual Reality in Immersive Training
In This Article
Summary
Abstract
Large-space co-located collaborative virtual reality provides a training environment in which participants can move, communicate, and coordinate actions within a shared immersive space. However, evidence remains limited on whether this configuration improves spatial presence, team coordination, and learning engagement beyond desktop-based collaboration or distributed room-scale virtual reality. This study evaluated a single-center, three-arm experimental protocol involving 126 participants assigned to 42 three-person teams. Teams were randomized to desktop collaborative simulation, room-scale distributed collaborative virtual reality, or large-space co-located collaborative virtual reality. All teams completed an 8-min orientation, a 20 min collaborative emergency logistics and spatial navigation task, immediate post-training assessments, and a 2-week retention test. Primary outcomes were spatial presence, self-rated team coordination, observer-rated team coordination, and learning engagement. Secondary outcomes included knowledge scores, cognitive load, simulator discomfort, and task-process indicators. The large-space co-located collaborative virtual reality group showed higher spatial presence, team coordination, and learning engagement than the comparison groups. Knowledge gain favored the large-space condition, whereas adjusted post-training knowledge and 2-week retention knowledge did not differ significantly across conditions. Cognitive load did not significantly increase, and simulator discomfort remained mild on average. These findings indicate that large-space co-located collaborative virtual reality may be most useful for training tasks that require spatial orientation, role-based coordination, and active team engagement, rather than for short-term knowledge acquisition alone.
Introduction
Immersive virtual reality facilitates simulation-based training in environments that are otherwise hazardous or inaccessible by linking visual attention and body movement to situated practice1. Recent research has moved beyond novelty demonstrations toward evidence-based implementation2, yet an important question remains regarding which hardware and spatial configurations best support collaborative learning behaviors. Spatial presence influences attention and embodiment3,4, whereas subjective immersion alone may be insufficient for complex team-based operations. Productive collaboration requires shared objectives, task interdependence, and mutual real-time monitoring5.
Recent scholarship has advanced the understanding of co-located virtual reality and embodied collaboration in supporting teamwork. However, empirical evidence remains uneven regarding the pedagogical effects of different spatial structures6. The primary contribution of this study is the systematic evaluation of three functionally distinct collaborative environments: desktop collaborative simulation, room-scale distributed virtual reality, and large-space co-located collaborative virtual reality. These conditions represent distinct configurations of team-based simulation and enable comparison of visual immersion and shared physical locomotion across collaborative training environments. The physical layouts of the three configurations are illustrated in Figure 1.
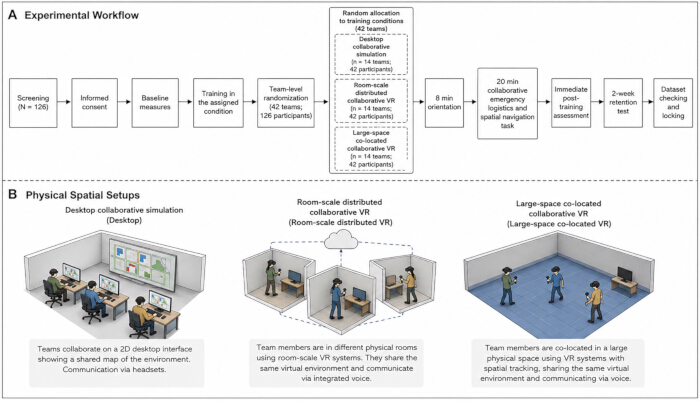
Figure 1: Experimental workflow and physical spatial setups of the three collaborative training conditions. (A) Overview of the experimental workflow, from participant screening and team-level randomization (N = 126 participants; 42 teams) to the 2-week retention test. (B) Schematic illustration of the three training environments. Left: Desktop collaborative simulation, in which team members navigate using separate workstations and communicate through assigned audio channels without immersive visual exposure. Center: Room-scale distributed collaborative virtual reality, in which participants experience visual immersion and live team communication while remaining within separate 3 m × 3 m physical tracking areas. Right: Large-space co-located collaborative virtual reality, in which team members share an unobstructed 8 m × 8 m space, allowing synchronized physical locomotion, embodied spatial referencing, and real-time co-navigation. Please click here to view a larger version of this figure.
The training protocol used a collaborative emergency logistics and spatial navigation scenario. Unlike individual procedural training, this scenario requires shared physical orientation, real-time verbal coordination, and embodied spatial action. These characteristics provide a structured setting for evaluating the affordances of large-space co-located collaborative virtual reality. Figure 2 illustrates the interfaces and interaction modes used in the virtual reality and desktop conditions. Embodied learning theory indicates that spatial manipulation can support agency when aligned with task demands7, while cognitive load theory indicates that effective group work depends on distributing cognitive demands without introducing unnecessary coordination burden8.
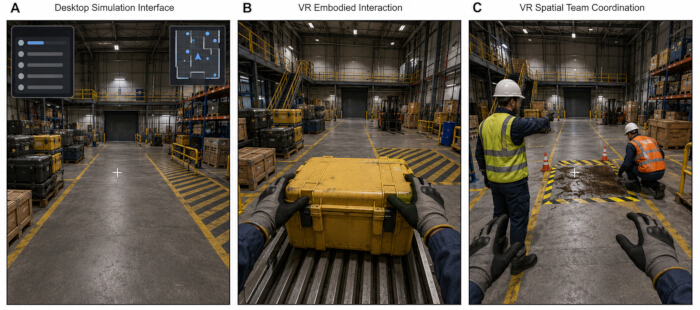
Figure 2: Interface comparison and task execution paradigms across training conditions. The collaborative emergency logistics and spatial navigation scenario was standardized across all groups, with interaction modality as the primary difference. (A) Desktop collaborative simulation interface, first-person view. Participants navigate the industrial environment using keyboard and mouse inputs and rely on a central crosshair and two-dimensional graphical user interface elements, including a minimap and task list, for spatial orientation. (B) Immersive virtual reality embodied interaction. In the immersive conditions, participants execute tasks, including resource collection and handling, through direct physical manipulation using tracked hand gestures rather than mouse clicks. (C) Spatial team coordination in the large-space co-located collaborative virtual reality condition. Team members coordinate role-specific actions, including those of the navigator, resource manager, and safety checker, through real-time avatar visibility, spatial pointing gestures, and shared physical orientation around hazard zones. Please click here to view a larger version of this figure.
Accordingly, the effects of the three training configurations were evaluated for spatial presence, team coordination, and learning engagement. Because immersive environments can generate strong subjective involvement9, these outcomes were considered alongside post-training knowledge acquisition and short-term retention to distinguish immediate engagement from retained learning. Because locomotion and immersive exposure also introduce physical demands, simulator discomfort was monitored as an implementation outcome10.
Protocol
This study involving human participants was conducted in accordance with the Declaration of Helsinki and institutional requirements for behavioral and educational research. The study protocol was approved by the Human Research Ethics Committee of Shenyang City University (Approval No. SU1992837; Approval Date: January 18, 2025). All participants provided written informed consent before enrollment. Participants were informed that the study involved immersive virtual reality exposure, team-based task performance, questionnaire completion, behavioral observation, and short-term follow-up testing. Participation was voluntary, and withdrawal was permitted at any time without academic, employment, or institutional penalty. All study records were de-identified before analysis. Each participant was assigned a numerical participant code, and each team was assigned a separate team code. No names, student numbers, phone numbers, facial images, or directly identifiable audio recordings were included in the analytical dataset. Equipment categories, software versions, and associated replication resources are listed in the Table of Materials.
1. Study design and setting
This completed study used a single-center, three-arm, parallel-group experimental design to examine whether large-space co-located collaborative virtual reality was associated with stronger spatial presence, team coordination, and learning engagement during immersive training. The three training conditions were desktop collaborative simulation, room-scale distributed collaborative virtual reality, and large-space co-located collaborative virtual reality.
The conditions were designed as functional comparators rather than as a full factorial decomposition of immersion, collaboration, and walking space. The desktop condition represented collaboration without exposure to an immersive head-mounted display. The room-scale distributed collaborative virtual reality condition represented immersive team collaboration in separate small tracking areas. The large-space co-located collaborative virtual reality condition combined an immersive visual experience, shared physical movement, and real-time embodied team interaction within a single tracked training space. Group differences were therefore interpreted as differences among the complete training configurations rather than as effects attributable to any single component. This structure was selected because research on immersive learning treats spatial presence, agency, and engagement as mechanisms by which virtual environments may influence learning behavior11.
The study was conducted in the Immersive Learning and Human-Computer Interaction Laboratory at the participating institution from March 3, 2025–July 18, 2025. Recruitment and baseline testing were conducted from March 3–April 25, 2025. Intervention sessions were conducted from March 10–May 30, 2025. The 2-week retention assessments were completed between March 24–June 16, 2025. Data checking, observer scoring, and dataset locking were completed by July 18, 2025.
All sessions were conducted in the same laboratory complex to control lighting, temperature, internet connectivity, task instructions, and researcher supervision. The large-space co-located collaborative virtual reality condition used an unobstructed tracking area of 8 m × 8 m. The room-scale distributed collaborative virtual reality condition used three separated 3 m × 3 m marked areas. The desktop collaborative simulation condition used individual computer workstations separated by acoustic partitions so that participants could communicate only through the assigned communication channel.
Participants were assigned to three-person teams before randomization. The team was used as the training unit because the task required distributed role execution, verbal coordination, shared situational awareness, and joint problem-solving. Randomization was conducted at the team level to avoid contamination between participants within the same session. The overall study workflow and physical configuration of the three conditions are shown in Figure 1.
2. Participants and eligibility screening
Participants were recruited from undergraduate and postgraduate programs at the participating institution. Recruitment notices described the study as an immersive training study involving virtual reality, team coordination, and learning assessment. The notices did not state the expected superiority of any training condition. Interested participants completed an online screening form before laboratory scheduling.
Participants were eligible if they were 18–35 years old, had normal or corrected-to-normal vision, could understand the training language, had no prior participation in the same virtual training scenario, and could stand and move safely for at least 30 min. Participants were excluded if they reported severe motion sickness, uncontrolled epilepsy, recent musculoskeletal injury affecting walking or balance, uncorrected visual impairment, severe vertigo, severe uncorrected hearing impairment, current acute illness, or any medical condition that made immersive virtual reality exposure unsafe. Participants were also excluded if they had extensive prior experience with the exact training scenario or had previously participated in pilot testing of the same system.
Eligibility was verified in two steps. A research assistant first reviewed the online screening form. The session researcher then confirmed eligibility verbally on the day of testing before consent. Participants reporting mild prior motion discomfort were not automatically excluded but were monitored more closely and reminded that participation could be stopped immediately if discomfort occurred. The complete screening form, eligibility items, baseline questionnaire, response formats, and coding rules are provided in Supplementary File 1.
An a priori power calculation was conducted using G-Power software to determine the required sample size for the experimental design. Assuming a medium expected effect size of f = 0.25 based on previous immersive collaborative learning literature, an alpha level of 0.05, and statistical power of 0.80 for a three-group analysis, a minimum of 111 participants was required. To accommodate the three-person team structure and maintain balanced group allocation across conditions, the final sample was expanded to 126 participants comprising 42 independent teams. Because the intervention was delivered at the team level, team identifiers were retained for clustering adjustment, observer-rated coordination scoring, and sensitivity checks.
3. Randomization, allocation concealment, and blinding
After all members of a three-person team had completed eligibility confirmation, the team was randomly assigned to one of the three training conditions using a computer-generated block-randomization list with a fixed block size of six teams. The allocation sequence was generated before data collection using a randomization package in the statistical computing environment, with a reproducible seed of 20250301.
Allocation concealment was maintained using sequentially numbered, opaque, tamper-evident envelopes prepared by a researcher independent of participant recruitment and intervention delivery. The randomization file was stored in a password-protected spreadsheet and was not accessible to the outcome assessors.
Allocation was revealed only after completion of the baseline questionnaire and pre-training knowledge test. The session researcher opened the next sealed allocation envelope immediately before equipment setup. Blinding of participants to the physical training format was not possible because the three conditions were visibly different. Participants were not informed which condition was expected to perform better.
Two observers rated team coordination from standardized screen recordings. The observers were blinded to the study hypotheses, training condition labels, and questionnaire results and were not involved in training delivery. Video files were renamed using neutral team codes before scoring. Condition-identifying interface labels were cropped or masked where possible before observer scoring.
4. Training scenario and task structure
The training scenario was designed as a collaborative emergency logistics and spatial navigation task in a simulated industrial training environment. Each three-person team was required to locate virtual resources, interpret spatial cues, communicate route information, coordinate role-specific actions, and complete a sequence of mission steps within a fixed time window.
Each participant held one of three roles: navigator, resource manager, or safety checker. The navigator interpreted the route direction and destination sequence. The resource manager identified and collected task-relevant virtual items. The safety checker monitored hazards, confirmed procedural order, and prompted the team before final submission.
The scenario contained four zones: orientation zone, resource zone, hazard zone, and completion zone. Each team completed eight required subtasks: identifying the target location, selecting three correct resources from six possible resources, avoiding two incorrect route branches, responding to three hazard prompts, transferring information between team members, and submitting the final task sequence. The maximum task time was 20 min. Teams that did not complete all required subtasks within 20 min were stopped at the time limit, and the number of completed subtasks was recorded.
Before the main task, all participants completed a standardized 8 min orientation. The first 3 min introduced the study rules and safety procedures. The next 3 min introduced the interface controls. The final 2 min allowed participants to practice movement, selection, and communication in a neutral practice environment that did not contain objects, routes, hazards, or answers used in the main scenario. No performance data from the practice environment were analyzed.
The same learning content, task sequence, target answers, route structure, hazard prompts, and scoring criteria were used across all three conditions. The conditions differed in interaction modality, degree of immersion, physical movement, and spatial configuration. The immersive environments were developed using a commercial real-time three-dimensional development platform. Multiplayer networking and spatial state synchronization were implemented using a dedicated multiplayer synchronization framework operating over a local gigabit Ethernet architecture. Participants assigned to the immersive virtual reality conditions used high-resolution head-mounted displays with integrated headphones and microphones. Spatial tracking used an infrared laser-based tracking system with four base stations. Avatar implementation used inverse kinematics algorithms to map real-time head and hand controller telemetry to articulated worker avatars.
5. Pre-study procedure checking and measurement refinement
Before formal data collection, all questionnaire items, knowledge test items, observer-rating rules, and task procedures were reviewed by two researchers with experience in immersive learning and one researcher with experience in educational measurement. The review focused on item clarity, role-task alignment, scoring consistency, safety wording, and construct alignment.
A pilot procedure check was conducted from February 17–February 21, 2025, with six participants who met the same eligibility criteria as the formal sample. The pilot examined task timing, headset comfort, movement safety, instruction clarity, questionnaire completion time, data export accuracy, and observer-rating feasibility. Pilot data were used only to refine wording, setup timing, safety instructions, and log-export procedures. These participants were not included in the final sample, and their data were not included in formal analysis.
6. Desktop collaborative simulation condition
In the desktop collaborative simulation condition, each participant used an individual workstation connected to a 24-inch 1080p monitor. Input devices consisted of a computer mouse and keyboard, and audio communication was provided through a USB headset and microphone. Participants were seated at separate workstations and were instructed not to communicate outside the system.
The desktop simulation used the same virtual environment, task objects, route sequence, hazard prompts, and scoring logic as the virtual reality conditions. The camera view was first-person. As illustrated in Figure 2A, participants in the desktop group navigated using keyboard inputs and interacted with virtual resources using mouse clicks through a fixed two-dimensional monitor field of view. Field of view, movement speed, interaction distance, and audio settings were fixed before data collection and were not changed between sessions. One researcher monitored technical stability during each session but did not provide task advice after the main scenario began.
7. Room-scale distributed collaborative virtual reality condition
In the room-scale distributed collaborative virtual reality condition, the three participants entered the same virtual scenario from separate 3 m × 3 m marked tracking areas. Each participant used a head-mounted display and handheld controllers. Team members communicated through the assigned voice channel and completed the same role-based team task but could not physically co-navigate in a shared large tracking space.
Before the main task, headset fit, interpupillary distance, the boundary system, and controller straps were adjusted. Participants were instructed to stop immediately if dizziness, nausea, eye strain, headache, loss of balance, or anxiety occurred. A researcher remained within 2 m of each active tracking area throughout the session and monitored safety without providing task guidance.
If a participant crossed the marked boundary, the session was paused, and the participant was repositioned. If moderate discomfort occurred, defined as a self-rated discomfort score of 5 or higher on any 0–10 discomfort item, the session was paused and the participant was seated for recovery. If any discomfort item reached 7 or higher, the session was stopped.
8. Large-space co-located collaborative virtual reality condition
In the large-space co-located collaborative virtual reality condition, each three-person team entered the same 8 m × 8 m tracked training area. Each participant wore a head-mounted display, held two controllers, and was represented by a role-specific avatar visible to the other team members. Team members communicated verbally in real time while physically moving through the shared training space. The system synchronized participant location, hand movement, object selection, and task-state changes. As shown in Figure 2B and Figure 2C, participants in the immersive conditions executed tasks using three-dimensional spatial hand gestures with tracked controllers and physical head rotation for a 360° field of view.
The large-space condition used the same task content and 20 min time limit as the other conditions. Physical movement was calibrated so that the virtual route remained within the marked safety area. A safety boundary appeared in the headset when participants approached the edge of the tracking zone. Before the main task, floor clearance, cable-free movement, headset fit, tracking stability, audio input, and controller response were checked. Participants were instructed to use natural physical walking rather than artificial locomotion techniques to navigate the virtual environment. Physical contact between team members was prohibited. If two participants approached within 0.5 m of each other, a neutral safety reminder was provided without task information.
Each large-space session was supervised by two researchers. One researcher monitored the system dashboard and recording status. The second researcher stood outside the active tracking area and monitored participant safety. The task was paused if tracking was lost for more than 10 s, if a participant reported discomfort, or if a participant crossed the safety boundary. If the interruption lasted less than 2 min and the participant wished to continue, the task resumed from the last saved state. If the interruption exceeded 2 min, the session was recorded as incomplete and retained in the intention-to-treat dataset.
9. Outcome measures and assessment timing
Assessments were completed at baseline, immediately after training, and 2 weeks after training. Baseline measures included demographics, prior virtual reality and team-training experience, gaming familiarity, and a 30-point knowledge pretest. Immediate post-training measures included spatial presence, self-rated and observer-rated team coordination, learning engagement, cognitive load, simulator discomfort, post-training knowledge, and task-performance indicators. The 2-week follow-up used the same 30-point knowledge test with reordered items and minor wording variation. The assessment schedule is shown in Table 1.
Table 1: Summary of primary and secondary measures. This table summarizes the variables, measurement scales, assessment timing, and data sources for the primary outcomes, secondary learning outcomes, and safety and process measures evaluated throughout the experimental protocol. Please click here to download this Table.
Spatial presence was measured immediately after training using an 8-item, 7-point scale adapted from established presence dimensions12. Scores were averaged when at least 80% of items were completed; otherwise, the score was coded as missing. Full items and scoring rules are provided in Supplementary File 1.
Self-rated team coordination was measured using a customized six-item, 7-point scale covering communication clarity, role awareness, mutual monitoring, assistance timing, shared task comprehension, and error recovery. Pilot testing with 20 participants assessed item clarity and structure, and exploratory factor analysis identified a single dominant factor. Internal consistency in the main sample was Cronbach’s α = 0.88. Participant scores were calculated as the mean of completed items, and team-level scores as the mean of the three participant scores. Full items and scoring criteria are provided in Supplementary File 1.
Observer-rated team coordination was assessed using a customized rubric covering communication timing, role execution, mutual support, spatial coordination, and error recovery. Each domain was scored from 0–20, yielding a total score from 0–100. The rubric underwent expert review, and two observers completed 10 h of training before formal scoring. Inter-rater reliability was evaluated using a two-way random-effects intraclass correlation coefficient (ICC) for absolute agreement, with ICC ≥ 0.75 required before final scoring. Total-score differences greater than 12 points were resolved by consensus; otherwise, the mean of the two scores was used. The complete rubric and reconciliation procedure are provided in Supplementary File 1.
Learning engagement was measured immediately after training using a 12-item, 7-point short-form scale13. Scores were averaged across completed items, with higher values indicating stronger engagement. Internal consistency was assessed using Cronbach’s alpha. Cognitive load was assessed using five 1–7 ratings of mental demand, physical demand, time pressure, effort, and frustration14. Full items and scoring rules are provided in Supplementary File 1.
Knowledge acquisition was assessed using a 30-point test comprising 20 single-best-answer items and five short scenario judgment items. The same blueprint was used for pretest, post-test, and 2-week retention testing, with reordered items and equivalent wording changes. A gain of at least 3 points from pretest to post-test was defined as a practically meaningful descriptive improvement. The test blueprint, scoring rules, and judgment rubric are provided in Supplementary File 1.
Simulator discomfort was assessed before exposure, after orientation, and after the main task using five 0–10 symptom ratings. The mean of the five items formed the discomfort index. Sessions were stopped if any item reached 7 or higher. Post-task indices above 6 required at least 15 min of monitoring, and indices of 5 or higher required 24 h follow-up. Full safety-scoring rules are provided in Supplementary File 1.
Task-performance indicators included completion status, completion time, correct resources selected, hazard prompts correctly handled, route errors, and safety interruptions. Incomplete teams were assigned 1,200 s for completion time. Outcome definitions, timing, score ranges, data sources, and analysis levels are summarized in Table 1 and detailed in Supplementary File 1.
10. Data collection procedure
Each session followed the same sequence. Participants arrived 15 min before the scheduled training time. Identity was confirmed using the appointment list, eligibility was checked again, the consent form was explained, and procedural questions were answered. Participants then signed the consent form and received participant codes. The expected superiority of any condition was not discussed.
Participants completed the baseline questionnaire and pre-training knowledge test on a laboratory tablet. The baseline phase lasted approximately 12 min. After baseline completion, team allocation was revealed, and the assigned training setup was prepared. Equipment preparation lasted approximately 5 min for the desktop condition, 8 min for the room-scale distributed collaborative virtual reality condition, and 10 min for the large-space co-located collaborative virtual reality condition. Equipment preparation was not counted as training exposure.
All participants then completed the standardized 8 min orientation. The main task started immediately after orientation and lasted up to 20 min. No teaching, hints, or corrective feedback were provided during the main task. Technical assistance was limited to restoring system function, adjusting headset fit, repositioning participants within the safety boundary, or repeating previously stated safety instructions. After the task, participants removed the equipment and completed the post-training questionnaire and post-training knowledge test at individual stations. The post-training assessment lasted approximately 15 min.
The 2-week retention test was administered online 14 days after the training session, with an acceptable completion window from day 13–day 16. Participants received one reminder 24 h before the due time and one reminder on day 15 if the test had not been completed. Responses submitted after day 16 were retained in the raw dataset but excluded from the primary retention analysis. The actual number of days between training and follow-up was recorded for sensitivity analysis.
11. Data quality control
Electronic questionnaires included range checks for key outcomes, while demographic items could be skipped. Submission times were recorded, and questionnaires completed in less than one-third of the median completion time were flagged for review. System logs were exported after each session and matched against session records within 48 h; discrepancies were resolved using timestamped recordings.
Observer-rated coordination scores were entered independently by two observers. Total-score differences greater than 12 points were flagged for consensus review, and final scores were locked before group-level analysis. Multi-item scale scores were calculated when at least 80% of items were completed; otherwise, scores were coded as missing. Unanswered single-best-answer knowledge items were scored as 0. Short scenario judgment items were scored independently by two raters, with disagreements greater than 1 point reviewed by a third rater.
The final dataset was locked after verification of eligibility records, participant and team codes, questionnaire ranges, knowledge scores, observer ratings, system logs, retention-test validity, data merges, and missingness. Detailed rules for scoring, cleaning, and dataset locking are provided in Supplementary File 1.
12. Safety monitoring and stopping criteria
Safety monitoring was conducted throughout all training sessions. Before exposure, participants were reminded that discomfort could occur during virtual reality training and that withdrawal was allowed at any time. During the task, posture, balance, movement speed, and verbal signs of discomfort were monitored. The task was stopped immediately if a participant reported severe dizziness, nausea, visual discomfort, headache, anxiety, loss of balance, or a wish to stop.
Predefined stopping criteria were applied consistently. The session was stopped if any discomfort item reached 7 or higher on the 0–10 scale, if a participant crossed the safety boundary twice in one session, if tracking loss lasted more than 2 min, if equipment malfunction prevented normal interaction, or if continued participation was judged to create a safety risk. Stopped sessions were documented using a session interruption form. Participants were seated after stopping and monitored until symptoms returned to a mild level, defined as all discomfort items below 3. No participant was allowed to leave the laboratory while reporting moderate or severe discomfort.
13. Data management and confidentiality
All data were stored in a de-identified project folder on an encrypted institutional drive. The linkage file connecting participant identities to participant codes was stored separately and was accessible only to the principal investigator. Questionnaire data, task logs, observer ratings, and knowledge test scores were merged using participant and team codes only, and the analytical dataset contained no personal identifiers.
Data were organized at participant and team levels. Participant-level files contained identifiers, condition assignment, demographic variables, questionnaire outcomes, knowledge outcomes, and task-related variables. Team-level files contained team identifiers, condition assignment, observer-rated coordination, task completion, completion time, resource selection, hazard handling, route errors, and safety interruptions. Raw observer scores were retained separately before averaging or consensus resolution. Variable definitions, coding ranges, and dataset structure are provided in Supplementary File 1.
14. Statistical analysis
Primary outcomes were spatial presence, self-rated team coordination, observer-rated team coordination, and learning engagement. Secondary outcomes included post-training knowledge, 2-week retention, cognitive load, simulator discomfort, task completion, completion time, and task-process indicators. Training conditions comprised desktop collaborative simulation, room-scale distributed collaborative virtual reality, and large-space co-located collaborative virtual reality.
Participant- and team-level variables were summarized using appropriate descriptive statistics. Baseline characteristics included age, gender, prior virtual reality experience, gaming familiarity, prior team-based training experience, and pre-training knowledge. Because randomization occurred at the team level, intraclass correlation coefficients were calculated to assess within-team dependence. Participant-level primary outcomes were analyzed using linear mixed-effects models with training condition as a fixed effect and team identifier as a random intercept. Models used restricted maximum likelihood estimation and included available data under the missing-at-random assumption. No imputation was applied to primary questionnaire outcomes. Estimated marginal means were compared using Tukey-adjusted pairwise contrasts. Observer-rated coordination was analyzed at the team level.
The Benjamini-Hochberg false discovery rate procedure was applied across the four primary outcomes as a sensitivity analysis. All randomized teams and participants were analyzed according to original allocation. Multi-item scale scores were calculated when at least 80% of items were completed; otherwise, scores were coded as missing. Residual normality was assessed using Q-Q plots and Shapiro-Wilk tests, and homogeneity of variance was assessed using Levene’s test. Strongly non-normal distributions were examined using the Kruskal-Wallis test as a sensitivity analysis.
Effect sizes were reported with p values. Analysis of variance results included eta squared and partial eta squared; pairwise comparisons included Cohen’s d with 95% confidence intervals; and mixed-effects models reported estimated mean differences with 95% confidence intervals. Statistical significance was defined as two-sided p < 0.05. Associations among spatial presence, team coordination, learning engagement, and knowledge outcomes were examined using Pearson or Spearman correlations, as appropriate. Statistical syntax for descriptive analyses, mixed-effects models, team-level coordination analysis, multiple-outcome adjustment, assumption checks, knowledge analyses, and correlation analyses is provided in Supplementary File 1.
Results
Participant flow and analysis populations
A total of 126 participants were enrolled and assigned to 42 three-person teams. Fourteen teams were allocated to each training condition, resulting in 42 participants in the desktop collaborative simulation group, 42 in the room-scale distributed collaborative virtual reality group, and 42 in the large-space co-located collaborative virtual reality group. All teams completed the assigned training session and were retained in the intention-to-treat dataset.
Missingness was low and was not concentrated in any condition. Spatial presence scores were available for 124 participants, including 41 in the desktop group, 42 in the room-scale group, and 41 in the large-space group. Self-rated team coordination scores were available for 123 participants, with 41 participants in each group. Learning engagement scores were available for 122 participants, including 40 in the desktop group, 41 in the room-scale group, and 41 in the large-space group. Simulator discomfort scores were available for 124 participants, including 42 in the desktop group, 41 in the room-scale group, and 41 in the large-space group. Valid 2-week retention knowledge scores were available for 122 participants, including 40 in the desktop group, 41 in the room-scale group, and 41 in the large-space group. Observer-rated team coordination was available for all 42 teams. Participant flow, allocation, immediate assessment, and follow-up completion are summarized in Figure 3.
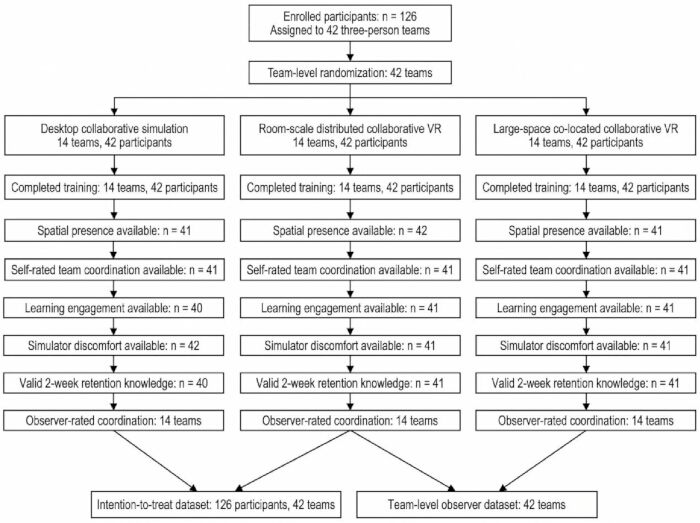
Figure 3: Participant flow and analysis populations. The flow diagram shows enrollment, allocation of 126 participants into 42 three-person teams, training completion, immediate assessment, observer-rated coordination scoring, and valid 2-week follow-up data across the three training conditions. Please click here to view a larger version of this figure.
Baseline characteristics
Baseline demographic and training-related characteristics were broadly comparable across the three conditions. The final sample consisted of young adult undergraduate and postgraduate participants. The three groups were similar in age, prior virtual reality exposure, familiarity with gaming or simulation, prior team-based training experience, and prior emergency logistics, navigation, or industrial safety training.
Pre-training knowledge scores were also comparable across groups. Mean pre-training knowledge scores were 16.17 ± 3.09 in the desktop collaborative simulation group, 16.10 ± 3.61 in the room-scale distributed collaborative virtual reality group, and 15.55 ± 3.23 in the large-space co-located collaborative virtual reality group. The unadjusted between-group comparison was not statistically significant, F(2, 123) = 0.44, p = 0.647, η2 = 0.007.
Baseline characteristics and pre-training measures are shown in Table 2. Before inferential hypothesis testing, diagnostic evaluations indicated that the primary continuous variables met the assumptions of residual normality and homogeneity of variance. Internal consistency was high across the psychometric instruments, with Cronbach’s alpha coefficients of 0.86 for spatial presence, 0.88 for self-rated team coordination, and 0.91 for learning engagement. All statistically significant group differences across the primary outcomes remained significant after Benjamini-Hochberg false discovery rate adjustment.
Table 2: Baseline characteristics and pre-training measures. This table reports participant demographics, prior virtual reality and training experience, gaming or simulation familiarity, prior related training history, and pre-training knowledge scores across the three experimental conditions. Please click here to download this Table.
Spatial presence
Spatial presence was analyzed using a linear mixed-effects model with training condition as a fixed effect and team code as a random intercept. Mixed-effects model tests used Satterthwaite-adjusted degrees of freedom. The model showed a significant effect of training condition on spatial presence, F(2, 39) = 23.91, p < 0.001. Estimated marginal means were 4.13 for the desktop collaborative simulation group, 5.00 for the room-scale distributed collaborative virtual reality group, and 5.42 for the large-space co-located collaborative virtual reality group.
Tukey-adjusted pairwise comparisons showed that spatial presence was higher in the large-space group than in the desktop group, estimated mean difference = 1.29, 95% CI: 0.86 – 1.72, p < 0.001. Spatial presence was also higher in the large-space group than in the room-scale group, estimated mean difference = 0.42, 95% CI: 0.04 – 0.80, p = 0.027. The room-scale group scored higher than the desktop group, estimated mean difference = 0.87, 95% CI: 0.45 – 1.29, p < 0.001.
For descriptive comparison, the unadjusted mean ± standard deviation (SD) scores were 4.13 ± 0.91 in the desktop group, 5.00 ± 0.79 in the room-scale group, and 5.42 ± 0.80 in the large-space group. The unadjusted analysis of variance (ANOVA) showed the same pattern, F(2, 121) = 25.68, p < 0.001, η2 = 0.298. Primary outcome distributions are shown in Figure 4, and the corresponding mixed-effects and descriptive statistics are summarized in Table 3.
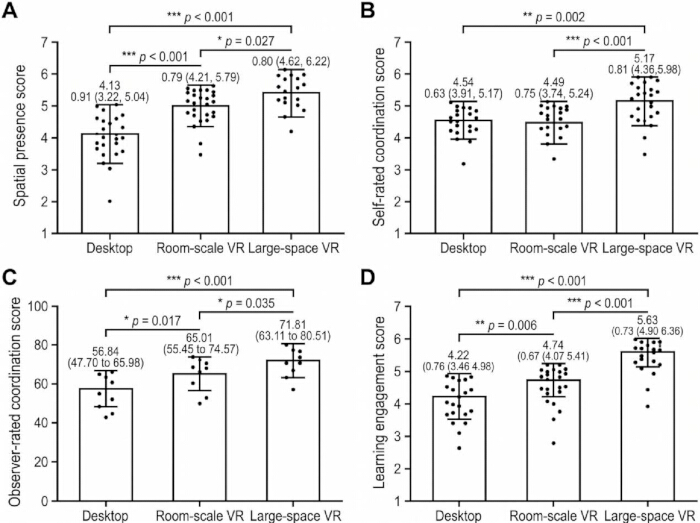
Figure 4: Primary outcomes across training conditions. (A) Spatial presence. (B) Self-rated team coordination. (C) Observer-rated team coordination. (D) Learning engagement. Spatial presence, self-rated team coordination, and learning engagement were participant-level outcomes; observer-rated team coordination was analyzed at the team level. Error bars indicate standard deviation. Please click here to view a larger version of this figure.
Table 3: Primary outcomes. This table summarizes spatial presence, self-rated team coordination, observer-rated team coordination, and learning engagement across the three training conditions. Corresponding inferential statistical models and false discovery rate sensitivity checks are also presented. Please click here to download this Table.
Team coordination
Self-rated team coordination was analyzed at the participant level using a linear mixed-effects model with training condition as a fixed effect and team code as a random intercept. The model showed a significant effect of training condition, F(2, 39) = 9.96, p < 0.001. Estimated marginal means were 4.54 in the desktop group, 4.49 in the room-scale group, and 5.17 in the large-space group.
Tukey-adjusted comparisons showed that self-rated team coordination was higher in the large-space group than in the desktop group, estimated mean difference = 0.63, 95% CI: 0.25 – 1.01, p = 0.002. The large-space group also scored higher than the room-scale group, estimated mean difference = 0.68, 95% CI: 0.29 – 1.07, p < 0.001. The desktop and room-scale groups did not differ significantly, estimated mean difference = 0.05, 95% CI: −0.33 – 0.43, p = 0.942. For descriptive comparison, the unadjusted mean ± SD scores were 4.54 ± 0.63 in the desktop group, 4.49 ± 0.75 in the room-scale group, and 5.17 ± 0.81 in the large-space group. The unadjusted ANOVA produced the same directional pattern, F(2, 120) = 10.84, p < 0.001, η2 = 0.153.
Observer-rated team coordination was analyzed at the team level, as prespecified. Inter-rater reliability exceeded the predefined threshold, with a two-way random-effects intraclass correlation coefficient of ICC = 0.84. Three team recordings had observer total-score differences greater than 12 points and were resolved through consensus review. Observer-rated coordination differed significantly across conditions, F(2, 39) = 10.92, p < 0.001, η2 = 0.359. Mean team-level scores were 56.84 ± 9.14 in the desktop group, 65.01 ± 9.56 in the room-scale group, and 71.81 ± 8.70 in the large-space group. Tukey-adjusted comparisons showed higher observer-rated coordination in the large-space group than in the desktop group, mean difference = 14.97, 95% CI: 7.33 – 22.61, p < 0.001. The large-space group also scored higher than the room-scale group, mean difference = 6.80, 95% CI: 0.42 – 13.18, p = 0.035. The room-scale group scored higher than the desktop group, mean difference = 8.17, 95% CI: 1.31 – 15.03, p = 0.017. Self-rated and observer-rated coordination showed the same group ordering, with the large-space group having the highest coordination scores on both measures.
Learning engagement
Learning engagement was analyzed using a linear mixed-effects model with training condition as a fixed effect and team code as a random intercept. The model showed a significant effect of training condition, F(2, 39) = 37.46, p < 0.001. Estimated marginal means were 4.22 in the desktop group, 4.74 in the room-scale group, and 5.63 in the large-space group. Tukey-adjusted pairwise comparisons showed that engagement was higher in the large-space group than in the desktop group, estimated mean difference = 1.41, 95% CI: 1.03 – 1.79, p < 0.001. Engagement was also higher in the large-space group than in the room-scale group, estimated mean difference = 0.89, 95% CI: 0.53 – 1.25, p < 0.001. The room-scale group scored higher than the desktop group, estimated mean difference = 0.52, 95% CI: 0.15 – 0.89, p = 0.006.
For descriptive comparison, the unadjusted mean ± SD scores were 4.22 ± 0.76 in the desktop group, 4.74 ± 0.67 in the room-scale group, and 5.63 ± 0.73 in the large-space group. The unadjusted ANOVA showed the same pattern, F(2, 119) = 40.00, p < 0.001, η2 = 0.402.
False discovery rate sensitivity checks for primary outcomes
The Benjamini-Hochberg false discovery rate procedure was applied across the four prespecified primary outcomes: spatial presence, self-rated team coordination, observer-rated team coordination, and learning engagement. All four primary outcomes remained statistically significant after adjustment. The false discovery rate sensitivity check produced the same primary outcome pattern as the main analyses.
Knowledge outcomes and retention
Immediate post-training knowledge was analyzed using a mixed-effects model with training condition as a fixed effect, pre-training knowledge as a covariate, and team code as a random intercept. The adjusted model showed a non-significant group effect for post-training knowledge, F(2, 39) = 2.14, p = 0.131. Estimated marginal means were 20.12 for the desktop group, 20.96 for the room-scale group, and 21.85 for the large-space group. For descriptive comparison, mean post-training knowledge scores were 20.09 ± 4.04 in the desktop group, 21.00 ± 4.57 in the room-scale group, and 21.84 ± 3.95 in the large-space group. The unadjusted between-group comparison was not statistically significant, F(2, 123) = 1.83, p = 0.165, η2 = 0.029.
Knowledge gain from baseline to immediate post-training assessment was evaluated as a secondary exploratory inferential outcome. Mean gains were 3.93 ± 2.88 points in the desktop group, 4.91 ± 2.12 points in the room-scale group, and 6.30 ± 2.75 points in the large-space group. The unadjusted group effect was significant, F(2, 123) = 8.77, p < 0.001, η2 = 0.125. Tukey-adjusted comparisons showed greater knowledge gain in the large-space group than in the desktop group, mean difference = 2.37, 95% CI: 0.96 – 3.78, p < 0.001. The large-space group also showed greater gain than the room-scale group, mean difference = 1.39, 95% CI: 0.14 – 2.64, p = 0.026. The room-scale and desktop groups did not differ significantly, mean difference = 0.98, 95% CI: −0.31 – 2.27, p = 0.171.
At the 2-week follow-up, retention knowledge was analyzed among participants with valid retention responses within the predefined day 13–day 16 window. The adjusted mixed-effects model, controlling for pre-training knowledge and including team code as a random intercept, showed a non-significant group effect, F(2, 39) = 1.68, p = 0.199. Mean retention scores were 18.70 ± 4.55 in the desktop group, 19.62 ± 4.37 in the room-scale group, and 20.42 ± 4.38 in the large-space group. The unadjusted group comparison was also not statistically significant, F(2, 119) = 1.53, p = 0.220, η2 = 0.025. Secondary learning outcomes are summarized in Table 4.
Table 4: Secondary learning outcomes across training conditions. This table reports pre-training knowledge, immediate post-training knowledge, knowledge gain, and 2-week knowledge retention across the three training conditions. Adjusted mixed-effects models are presented for the secondary learning outcomes. Please click here to download this Table.
Cognitive load and simulator discomfort
Cognitive load was analyzed as a secondary outcome. Mean cognitive load was 4.22 ± 0.69 in the desktop group, 4.49 ± 0.62 in the room-scale group, and 4.13 ± 0.82 in the large-space group. The unadjusted group effect was F(2, 123) = 2.92, p = 0.058, η2 = 0.045. This result did not reach the predefined significance threshold.
Simulator discomfort differed across conditions. Mean post-task discomfort index was 1.37 ± 0.71 in the desktop group, 2.18 ± 0.79 in the room-scale group, and 2.42 ± 0.58 in the large-space group. The unadjusted group effect was significant, F(2, 121) = 25.72, p < 0.001, η2 = 0.298. Discomfort scores were higher in the two virtual reality groups than in the desktop group, while average values remained in the mild range. No participant met the predefined stopping criterion of any discomfort item ≥7. Seven participants had a post-task discomfort index ≥5 and received 24 h symptom-resolution contact. Among these participants, four had a post-task discomfort index >6 and were also monitored in the laboratory for at least 15 min before leaving. All seven participants reported symptom resolution without medical referral. No session was terminated because of simulator discomfort, and no adverse event requiring clinical care was recorded. Cognitive load and simulator discomfort are shown in Figure 5.
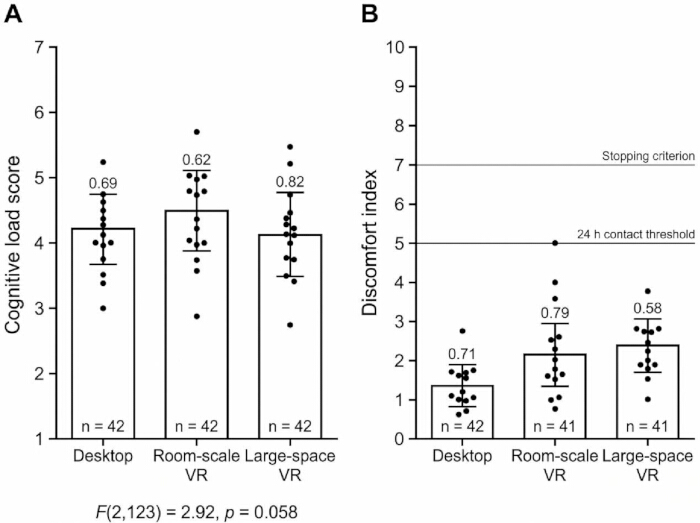
Figure 5: Cognitive load and simulator discomfort across training conditions. (A) Cognitive load, scored from 1 – 7, with higher scores indicating greater perceived workload. (B) Post-task simulator discomfort, scored from 0 – 10 and based on nausea, dizziness, eye strain, headache, and balance discomfort. Error bars indicate standard deviation. Please click here to view a larger version of this figure.
Task process indicators
Task-process indicators were used to describe team performance during the 20 min collaborative training task. Task completion was 71.4% in the desktop group, 78.6% in the room-scale group, and 85.7% in the large-space group. Mean completion time was 1,041.6 ± 162.4 s in the desktop group, 984.3 ± 151.8 s in the room-scale group, and 931.7 ± 139.6 s in the large-space group. Because incomplete teams were assigned a time limit of 1,200 s, completion time was interpreted descriptively.
The mean number of correct resources selected was 2.21 ± 0.70 in the desktop group, 2.43 ± 0.65 in the room-scale group, and 2.64 ± 0.50 in the large-space group. Mean correctly handled hazard prompts were 1.93 ± 0.83, 2.21 ± 0.70, and 2.50 ± 0.65, respectively. Mean route errors were 2.07 ± 1.14 in the desktop group, 1.50 ± 0.94 in the room-scale group, and 1.00 ± 0.78 in the large-space group. Safety interruptions were infrequent across all conditions, with means of 0.21 ± 0.43, 0.29 ± 0.47, and 0.36 ± 0.50, respectively. Task completion status, completion time, correct resource selection, hazard prompts handled correctly, route errors, and safety interruptions are summarized in Table 5.
Table 5: Task process indicators and safety events. This table summarizes objective task-performance measures, including completion rates, route navigation errors, and hazard handling. Simulator discomfort monitoring and recorded adverse clinical events are also reported. Please click here to download this Table.
Associations among presence, coordination, engagement, and learning
Participant-level psychometric responses were aggregated into team-level cluster means before integration with observer-rated coordination measures. Team-level correlation analysis showed positive associations between spatial presence and learning engagement (r = 0.57), self-rated team coordination (r = 0.26), and observer-rated coordination (r = 0.32).
The correlation pattern indicated moderate overlap among presence, coordination, and engagement, while correlations with knowledge gain were smaller. The correlation pattern indicated overlap among presence, coordination, and engagement, while associations with knowledge gain were smaller. These analyses were exploratory and do not establish causal pathways among the measured outcomes. The correlation matrix is shown in Figure 6.
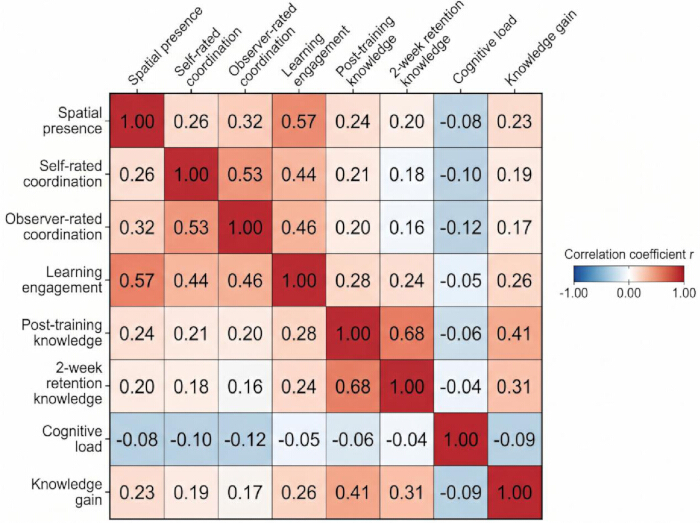
Figure 6: Correlation matrix for presence, coordination, engagement, and learning outcomes. The heatmap shows Pearson correlation coefficients among spatial presence, self-rated team coordination, observer-rated team coordination, learning engagement, post-training knowledge, 2-week retention knowledge, cognitive load, and knowledge gain. Please click here to view a larger version of this figure.
The large-space co-located collaborative virtual reality group had higher spatial presence, self-rated team coordination, observer-rated team coordination, and learning engagement than the comparison groups. These primary outcome findings remained significant after accounting for team clustering and after false discovery rate adjustment. For secondary outcomes, knowledge gain favored the large-space group, whereas adjusted post-training knowledge and 2-week retention knowledge did not differ significantly across conditions. Cognitive load did not differ significantly across groups, and simulator discomfort remained mild on average despite higher scores in the virtual reality conditions.
DATA AVAILABILITY:
The de-identified analytical dataset, data dictionary, scoring rubrics, and statistical syntax used to support reproducibility are publicly available in the Zenodo repository - https://zenodo.org/records/21991446. Additional reporting checklists, instrument blueprints, scoring rules, and dataset documentation are provided in Supplementary File 1.
Supplementary File 1: Reproducibility Materials for the Large-Space Collaborative Virtual Reality Training Study. This file contains the participant questionnaire, knowledge test blueprint, observer-rated coordination rubric, data dictionary, scoring and cleaning rules, statistical syntax outline, de-identified analytical dataset structure, and reporting checklist. Please click here to download this file.
Discussion
This study examined whether a large-space co-located collaborative virtual reality configuration produced different training experiences from desktop collaboration and room-scale distributed collaborative virtual reality. The strongest and most consistent findings were observed for spatial presence, team coordination, and learning engagement. These outcomes are distinct: spatial presence reflects the extent to which participants perceived themselves as being located within the training space; coordination reflects information exchange, role execution, and error recovery; and engagement reflects cognitive and behavioral involvement in the task. The large-space condition produced higher scores across all three domains after accounting for team clustering and false discovery rate adjustment. This pattern is consistent with the broader view that collaborative virtual reality functions not only as a display technology but also as a task ecology in which shared action, communication, and environmental structure jointly shape learning behavior15.
The spatial presence finding is relevant because the three training conditions differed in the organization of movement and co-presence. The desktop condition supported collaboration without immersive bodily placement. The room-scale distributed condition provided immersive visual experience and live team communication, but participants remained in separate small tracking areas. The large-space condition added shared physical co-navigation, allowing participants to move, orient, and act within the same tracked environment. The observed increase in spatial presence therefore should not be attributed to walking space alone, but rather to the complete training configuration combining bodily movement, shared spatial reference, and real-time team visibility. This interpretation aligns with presence research showing that immersive systems can strengthen presence when sensorimotor contingencies, spatial updating, and environmental coherence support the sense of being located within the mediated environment16. The coordination results showed a similar pattern. The large-space group demonstrated higher self-rated and observer-rated coordination. Self-rated coordination may be influenced by enjoyment or novelty, whereas observer-rated coordination was based on visible communication timing, role execution, mutual support, spatial coordination, and error recovery. Shared spatial information may therefore have provided a common reference field for organizing team action. This pattern is consistent with computer-supported collaborative learning research indicating that collaboration depends on communication channels, shared representations, task interdependence, and monitoring of team progress17.
Learning engagement also increased in the large-space group, although this finding requires cautious interpretation in relation to learning effectiveness. The combination of higher immediate knowledge gain with non-significant adjusted post-training and retention outcomes indicates that stronger experiential engagement did not correspond to consistently stronger retained knowledge. A single exposure may therefore produce greater immersion and behavioral involvement without necessarily producing durable differences in knowledge acquisition. The advantages of large-space collaborative environments were most evident in spatial coordination and active situational involvement rather than sustained cognitive retention. Engagement remains a condition for learning rather than a guarantee of retention. Immersive learning research similarly indicates that presence and involvement may support attention and task participation, whereas durable learning also depends on instructional design, feedback, prior knowledge, and opportunities for repeated practice18. Cognitive load did not significantly increase in the large-space group despite the physical movement and live team coordination required by that condition. The room-scale distributed condition showed the highest mean cognitive load, although the group difference did not reach the predefined significance threshold. Distributed collaboration required participants to coordinate through voice while acting in separate small spaces, potentially maintaining coordination demands without the shared physical reference available in the large-space condition. Cognitive load theory similarly indicates that collaborative learning is most effective when task structure distributes cognitive work without adding unnecessary communication burden19.
Simulator discomfort was higher in the two virtual reality conditions than in the desktop condition, although average scores remained mild. No participant met the stopping criterion of any discomfort item reaching 7, and no adverse event required clinical care. Large-space co-located collaborative virtual reality presents safety considerations because it combines head-mounted display exposure, bodily movement, and team proximity. The implemented safeguards did not eliminate discomfort but maintained symptoms within a manageable range in this sample. For broader institutional implementation, standardized troubleshooting procedures are required. Headset fit and interpupillary distance calibration are important for reducing ocular strain. Spatial tracking loss or increased network latency requires immediate pausing of the simulation, while audio-channel failures require localized hardware reset procedures. Co-located movement safety also requires walking-only instructions and physical boundary constraints to reduce collision risk. These procedures are consistent with the view that cybersickness and discomfort should be treated as design and monitoring considerations in virtual reality training rather than as incidental adverse effects20.
The study also has methodological value because the comparison extended beyond a simple virtual reality versus non-virtual reality contrast. Desktop collaboration, distributed immersive collaboration, and co-located large-space collaboration were evaluated as distinct configurations. This design enabled examination of the changes associated with spatially shared immersive collaboration rather than visual immersion or verbal coordination alone. The observed differences were strongest for presence, coordination, and engagement and weaker for retained knowledge. This pattern does not support a general conclusion that larger or more immersive systems improve all learning outcomes. Large-space co-located collaborative virtual reality may therefore be most applicable when training requires spatial orientation, role distribution, real-time mutual monitoring, and coordinated movement rather than simple factual recall21.
Several limitations should be considered. The study was conducted at a single institution with young adult undergraduate and postgraduate participants, limiting generalizability to older trainees, professional emergency teams, and learners with limited technology familiarity. The task involved structured emergency logistics and spatial navigation, and different patterns may occur in domains with lower spatial dependence. Performance evaluation relied on subjective questionnaires, human observer ratings, and basic system logs. Granular behavioral telemetry, including communication frequency, cumulative speaking time, movement synchronization, and targeted gaze behavior, was not recorded, limiting quantification of the detailed mechanisms of team interaction and coordination efficiency. Future investigations should incorporate physiological measures, including continuous heart rate variability and electrodermal activity, together with comprehensive spatial telemetry. Independent non-collaborative physical-movement control groups are also needed to distinguish effects associated with interpersonal collaboration from those associated with increased physical locomotion. The participant cohort was feasibility-based and drawn from a single academic institution, and the psychometric instruments and observational rubrics were developed or adapted for this immersive paradigm. Although internal reliability and construct validity were evaluated, self-report measures remain susceptible to novelty effects. Integration of participant-level questionnaire data with team-level observer scores also introduced structural complexity; cluster-mean aggregation and mixed-effects modeling were used to align analytical levels, but future studies should prioritize parallel multimodal data collection at the same operational unit of analysis. The 2-week follow-up period does not establish whether effects persist over longer periods or transfer to real-world performance. In addition, the three training configurations were holistic environmental comparators rather than components of a fully factorial design. Visual immersion, physical locomotion, body awareness, and shared physical co-location therefore remained confounded, preventing attribution of the observed differences to any single component. Future studies should separate these factors through factorial manipulation and incorporate repeated training exposures and operational transfer tasks to determine whether coordination improvements persist in clinical or industrial settings22.
Disclosures
The authors have no conflicts of interest.
AUTHOR CONTRIBUTIONS:
Fu Bo conceptualized the study, developed the experimental protocols, managed data collection, and wrote the initial draft of the manuscript. Meng Na supervised the technical implementation of the virtual reality simulation platforms, contributed to statistical programming, and co-revised the manuscript for critical intellectual content. Both authors approved the final version for submission
Acknowledgements
The authors would like to thank the School of Intelligence and Engineering at Shenyang City University for supporting this research. Special appreciation is extended to the Key Laboratory of Virtual- Real Interaction and Digital Twin Technology Innovation for providing the equipment and spatial facilities necessary to conduct the large-space co-located collaborative virtual reality experiments. They also express their sincere gratitude to all undergraduate and postgraduate students who volunteered to participate in the immersive training sessions. Their engagement and cooperation were essential to the successful completion of this study. This work was supported by the Liaoning Applied Basic Research Program 2025 (Grant No. 2025JH2/101330049); the Natural Science Foundation of Liaoning Province 2024 (Grant No. 2024-MS-255); the Fundamental Research Funds for Universities of Liaoning Provincial Department of Education 2025 (Grant No. LJ212513220006); and the Fundamental Research Funds for Universities of Liaoning Provincial Department of Education 2024 (Grant No. LJ212413220001).
Materials
| Name | Company | Catalog Number | Comments |
|---|---|---|---|
| 24 h symptom-resolution contact form | Study-developed follow-up form | Version 1.0 | Used to document symptom resolution for participants with post-task discomfort index ≥5 |
| Acoustic partition panels | Generic laboratory furniture supplier | Standard portable acoustic partition, approximately 160–180 cm height | Used to separate desktop participants and prevent off-channel communication |
| Alcohol-free disinfectant wipes | Generic laboratory hygiene supplier | Device-safe disinfectant wipes | Used to clean head-mounted displays, controllers, microphones, keyboards, mice, and shared surfaces between sessions |
| Analytical dataset | Study-generated file | analytical_dataset.csv | De-identified participant-level dataset with one row per participant |
| Baseline questionnaire | Study-developed questionnaire | Version 1.0, finalized February 2025 | Used to collect demographic information, prior virtual reality experience, gaming familiarity, and prior team-training experience |
| Boundary marking tape | Generic laboratory safety supplier | Non-slip floor marking tape | Used to mark 3 m × 3 m room-scale areas and the 8 m × 8 m large-space training area |
| Cognitive load scale | Study-adapted workload rating form | 5-item version | Used immediately after training; items cover mental demand, physical demand, time pressure, effort, and frustration |
| Computer mouse | Generic computer equipment supplier | Standard wired or wireless mouse | Used for interaction in the desktop collaborative simulation condition |
| Data cleaning log | Study-generated file | data_cleaning_log.xlsx | Records score corrections, missingness checks, observer-score reconciliation, and dataset-lock decisions |
| Data dictionary | Study-generated file | Version 1.0 | Defines variable names, labels, coding rules, score ranges, missing-value rules, and analysis levels |
| Desktop monitor | Generic computer equipment supplier | 24-inch monitor, minimum 1,920 × 1,080 resolution | Used in the desktop collaborative simulation condition |
| Desktop workstation | Generic computer equipment supplier | Minimum configuration: Intel i5 or equivalent processor, 16 GB RAM, dedicated graphics card, Windows 10 or later | Used for desktop simulation, local monitoring, questionnaire administration, and data processing |
| Disposable headset face covers | Generic hygiene supplier | Standard disposable head-mounted display face covers | Used for participant hygiene during virtual reality sessions |
| Emergency stop checklist | Study-developed safety form | Version 1.0 | Used to document stopping criteria, discomfort events, safety interruptions, and symptom-resolution follow-up |
| Encrypted institutional storage | Participating institution | Access-controlled encrypted project folder | Used to store de-identified datasets, scoring files, recordings, and syntax files |
| Observer-rated coordination rubric | Study-developed rating rubric | 5-domain, 100-point version | Used by two blinded observers to rate communication timing, role execution, mutual support, spatial coordination, and error recovery |
| Observer-score dataset | Study-generated file | observer_scores.csv | Contains domain-level observer scores before averaging or consensus review |
| Online questionnaire platform | Institutional or licensed survey system | Version active during 2025 data collection | Used for screening, baseline questionnaire, post-training questionnaire, and 2-week retention test |
| Pairwise comparison package | R package | emmeans version current with R 4.3.2 | Used for estimated marginal means and Tukey-adjusted pairwise comparisons |
| Participant consent form | Study-approved document | Ethics-approved version | Used before baseline assessment and randomization |
| Participant questionnaire | Study-developed questionnaire | Version 1.0 | Includes screening items, baseline items, spatial presence, self-rated team coordination, learning engagement, cognitive load, and discomfort scales |
| Portable chairs | Generic laboratory furniture supplier | Standard laboratory chair | Used for participant seating during consent, questionnaires, recovery, and post-task monitoring |
| R statistical software | R Foundation for Statistical Computing | R version 4.3.2 | Used for data cleaning, reliability analysis, mixed-effects models, correlation analysis, and figure preparation |
| Reliability analysis package | R package | psych version current with R 4.3.2 | Used to calculate Cronbach’s alpha and intraclass correlation coefficient |
| Room-scale tracking areas | Participating institution laboratory | Three separated 3 m × 3 m marked spaces | Used for the room-scale distributed collaborative virtual reality condition |
| Safety monitoring form | Study-developed form | Version 1.0 | Used to record discomfort scores, boundary crossings, tracking interruptions, and recovery status |
| Screen recording software | Generic commercial or open-source screen recording software | Version active during 2025 data collection | Used to generate standardized recordings for observer-rated coordination |
| Session checklist | Study-developed checklist | Version 1.0 | Used to document attendance, eligibility confirmation, equipment setup, safety checks, task completion, and interruptions |
| Simulator discomfort scale | Study-developed symptom checklist | 5-item, 0–10 version | Used before exposure, after orientation, and immediately after training |
| Spatial presence scale | Study-adapted questionnaire | 8-item version | Used immediately after training; response range 1–7 |
| SPSS statistical software | IBM Corp. | IBM SPSS Statistics version 29.0 | Used for descriptive statistics, ANOVA, Welch ANOVA, chi-square tests, and assumption checks |
| Statistical syntax file | Study-generated file | R syntax file, Version 1.0 | Used to reproduce data cleaning, mixed-effects models, ANOVA, correlation analysis, and output generation |
| System-log export module | Study-developed export function | Version 1.0, locked before formal data collection | Exported task start time, task end time, completion status, object selections, hazard responses, route errors, and interruptions |
| Team-level dataset | Study-generated file | team_level_dataset.csv | Contains observer-rated coordination scores and task-process indicators at team level |
| Virtual reality tracking system | Commercial virtual reality hardware supplier | Compatible with selected headset and controllers | Used to track participant position and hand movement |
| Virtual training environment | Custom-built training software | Version 1.0, locked before formal data collection | Delivered the collaborative emergency logistics and spatial navigation scenario |
| Voice communication module | Built-in or integrated communication module | Version locked before formal data collection | Used for assigned team voice communication channels |
References
- Dede C. Immersive interfaces for engagement and learning. Science. 2009;323(5910):66-69.
- Radianti J, Majchrzak TA, Fromm J, Wohlgenannt I. A systematic review of immersive virtual reality applications for higher education: Design elements, lessons learned, and research agenda. Comput Educ. 2020;147:103778. https://doi.org/10.1016/j.compedu.2019.103778
- Cummings JJ, Bailenson JN. How immersive is enough A meta-analysis of the effect of immersive technology on user presence. Media Psychol. 2016;19(2):272-309.
- Makransky G, Petersen GB. The Cognitive Affective Model of Immersive Learning (CAMIL): A theoretical research-based model of learning in immersive virtual reality. Educ Psychol Rev. 2021;33(4):937-958.
- Dillenbourg P. What do you mean by collaborative learning In: Dillenbourg P, editor. Collaborative-learning: Cognitive and computational approaches. Oxford: Elsevier; 1999. p. 1-19.
- van der Meer N, van der Werf V, Brinkman WP, Specht M. Virtual reality and collaborative learning: A systematic literature review. Front Virtual Real. 2023;4:1159905. https://doi.org/10.3389/frvir.2023.1159905
- Johnson-Glenberg MC. Immersive VR and education: Embodied design principles that include gesture and hand controls. Front Robot AI. 2018;5:81. https://doi.org/10.3389/frobt.2018.00081
- Kirschner F, Paas F, Kirschner PA. A cognitive load approach to collaborative learning: United brains for complex tasks. Educ Psychol Rev. 2009;21(1):31-42.
- Fredricks JA, Blumenfeld PC, Paris AH. School engagement: Potential of the concept, state of the evidence. Rev Educ Res. 2004;74(1):59-109.
- Kourtesis P, Linnell J, Amir R, Argelaguet F, MacPherson SE. Cybersickness in virtual reality: The role of individual differences, cognitive functions, and virtual reality locomotion. Virtual Worlds. 2024;3(1):62-93.
- Dalgarno B, Lee MJW. What are the learning affordances of 3-D virtual environments Br J Educ Technol. 2010;41(1):10-32.
- Schubert T, Friedmann F, Regenbrecht H. The experience of presence: Factor analytic insights. Presence Teleoper Virtual Environ. 2001;10(3):266-281.
- O’Brien HL, Cairns P, Hall M. A practical approach to measuring user engagement with the refined User Engagement Scale (UES) and new User Engagement Scale Short Form (UES-SF). Int J Hum-Comput Stud. 2018;112:28-39.
- Hart SG, Staveland LE. Development of NASA-TLX (Task Load Index): Results of empirical and theoretical research. In: Hancock PA, Meshkati N, editors. Human mental workload. Amsterdam: North-Holland; 1988. p. 139-183.
- De Back TT, Tinga AM, Nguyen P, Louwerse MM. Learning in immersed collaborative virtual environments: Design and implementation. Interact Learn Environ. 2023;31(8):5364-5382.
- Slater M, Sanchez-Vives MV. Enhancing our lives with immersive virtual reality. Front Robot AI. 2016;3:74. https://doi.org/10.3389/frobt.2016.00074
- Roschelle J, Teasley SD. The construction of shared knowledge in collaborative problem solving. In: O’Malley C, editor. Computer supported collaborative learning. Berlin: Springer; 1995. p. 69-97.
- Merchant Z, Goetz ET, Cifuentes L, Keeney-Kennicutt W, Davis TJ. Effectiveness of virtual reality-based instruction on students' learning outcomes in K-12 and higher education: A meta-analysis. Comput Educ. 2014;70:29-40.
- Sweller J. Cognitive load during problem solving: Effects on learning. Cogn Sci. 1988;12(2):257-285.
- Stanney KM, Kennedy RS, Drexler JM, editors. Cybersickness is not simulator sickness. Proceedings of the Human Factors and Ergonomics Society Annual Meeting; 1997.
- Lindgren R, Johnson-Glenberg M. Emboldened by embodiment: Six precepts for research on embodied learning and mixed reality. Educ Res. 2013;42(8):445-452.
- Howard MC. A meta-analysis and systematic literature review of virtual reality rehabilitation programs. Comput Hum Behav. 2017;70:317-327.