This protocol describes flow cytometric detection of intracellular proteins in K562 human erythroleukemia cells using unconjugated primary polyclonal antibodies. Antibody specificity is demonstrated by dose-dependent inhibition of staining through peptide competition.
Method Article
Flow Cytometric Detection of Intracellular Proteins in K562 Human Erythroleukemia Cells Using Unconjugated Primary Antibodies
In This Article
Summary
Abstract
Flow cytometry is a powerful technique for quantitative analysis of protein expression at single-cell resolution. This protocol describes a workflow for detecting intracellular proteins in K562 human erythroleukemia cells using unconjugated primary polyclonal antibodies and fluorophore-conjugated secondary antibodies. Cells are sequentially fixed, permeabilized, and blocked before antibody staining. By varying the order of antibody incubation relative to fixation and permeabilization, the protocol enables assessment of proteins with surface or intracellular localization using separate staining workflows. Nuclear staining of splicing factor 3a subunit 1 (SF3A1) is demonstrated using an affinity-purified rabbit anti-SF3A1 polyclonal antibody, and antibody specificity is evaluated by dose-dependent inhibition of staining with the corresponding antigenic peptide. In addition, staining conditions are used to assess reactivity of an antibody targeting the intracellular domain of erythropoietin receptor. This standardized workflow expands the use of unconjugated primary antibodies in flow cytometry and provides a practical approach for evaluating protein expression and localization, as well as antibody specificity in K562 human erythroleukemia cells.
Introduction
Flow cytometry is a powerful and widely used analytical tool that allows quantitative assessment of protein expression at single-cell resolution, thereby facilitating examination of heterogeneous and rare cell populations1,2,3. While conventional flow cytometry approaches primarily employ antibodies targeting cell surface antigens, many functionally important proteins, such as transcription factors, RNA-processing regulators, and receptors that undergo ligand-induced internalization, are localized within intracellular compartments. Consequently, these cytoplasmic and nuclear proteins are inaccessible using standard surface staining protocols. The incorporation of intracellular staining methods, which involve fixation and permeabilization of cellular membranes, has substantially expanded the utility of flow cytometry by allowing quantitative assessment of intracellular proteins, cytokines, and signaling intermediates while preserving the high-throughput and multiparametric capabilities of conventional flow cytometry analysis4,5,6,7.
A key limitation in detecting both surface-associated and intracellular proteins by flow cytometry is the availability of suitable antibodies and, in many cases, incomplete knowledge of epitope or immunogen sequences8,9. Since immunophenotyping strategies are largely based on cell surface markers, most commercially available antibodies validated for flow cytometry are monoclonal, recognize single extracellular epitopes, and are preconjugated to fluorophores. In contrast, polyclonal antibodies are capable of recognizing multiple epitopes within a target protein and are commonly used for western blotting, immunohistochemistry, or immunofluorescence. However, these antibodies are typically unconjugated and therefore not directly compatible with standard flow cytometry workflows. The use of unconjugated primary antibodies in combination with fluorophore-conjugated secondary antibodies provides a flexible alternative that expands the range of detectable targets and may enable signal amplification, which can be advantageous for low-abundance proteins.
To address these limitations, we optimized a protocol for staining proteins in K562 human erythroleukemia cells10. Intracellular staining requires fixation to preserve cellular structure and state, as well as permeabilization to allow antibodies to access intracellular compartments. In this protocol, cells are fixed with paraformaldehyde (PFA), a commonly used crosslinking fixative that maintains cellular morphology and may increase cell membrane permeability under specific conditions11,12,13,14. Permeabilization with ethanol (EtOH) allows antibody entry into intracellular compartments, including access to nuclear targets5,13,15. Permeabilization is followed by staining with unconjugated primary polyclonal antibodies and fluorophore-conjugated secondary antibodies. Using this workflow, PFA treatment alone is used for detection of non-surface immunoreactivity, whereas an additional EtOH permeabilization step is used for nuclear target detection. Assessment of nuclear staining specificity by peptide competition showed dose-dependent inhibition of antibody binding by the cognate peptide and not by a nonspecific control. Overall, the use of unconjugated primary polyclonal antibodies extends the applicability of flow cytometry beyond conventional surface marker analysis with fluorophore-conjugated antibodies and provides a flexible approach for assessing intracellular protein expression at single-cell resolution.
Protocol
K562 cells were obtained commercially and were periodically authenticated and tested for mycoplasma by the University of Arizona Genetics Core. No human participants or vertebrate animals were involved in this study.
1. Prepare reagents
- Culture cells under sterile conditions. Use the K562 human myelogenous leukemia cell line for this protocol.
- Thaw and maintain K562 cells in Roswell Park Memorial Institute (RPMI) medium supplemented with 10% fetal bovine serum and 1% penicillin-streptomycin at 37°C in 5% CO₂16. For propagation, seed cells at a density of approximately 1 × 10⁵ cells/mL, harvest when cultures reach 75%–95% of the recommended maximum cell density, and do not culture beyond 20 passages. For staining, harvest cells at 50%–75% of the recommended maximum cell density.
- Prepare sterile 10× phosphate-buffered saline (PBS) inside a class II biosafety cabinet.
- Add 80 g sodium chloride (NaCl), 2 g potassium chloride (KCl), 2.4 g potassium phosphate monobasic (KH₂PO₄), and 14.4 g sodium phosphate dibasic (Na₂HPO₄) to 800 mL autoclaved water in a 1 L graduated cylinder.
- Add a stir bar and stir the solution on a magnetic stir plate until all powder has dissolved.
- Use a pH probe to adjust the pH to 7.2–7.4. Bring the final volume to 1 L with autoclaved water. Filter-sterilize the solution using a bottle-top filter fitted with a 0.2 µm pore-size nylon membrane.
- Dilute 10× PBS to 1× PBS by adding 100 mL sterile 10× PBS to 900 mL autoclaved water inside a class II biosafety cabinet.
- Prepare the fixable viability dye according to the manufacturer's instructions. For this protocol, add 50 µL dimethyl sulfoxide (DMSO) to one tube of lyophilized dye and vortex until the dye is completely dissolved.
- Store the reconstituted dye at −20°C, protected from light, for up to 1 year. Store the dye in small aliquots to avoid repeated freeze-thaw cycles.
- Prepare fluorescence-activated cell sorting (FACS) buffer by combining 10% 10× PBS, 86% water, and 4% fetal bovine serum (FBS). For example, combine 10 mL 10× PBS, 86 mL water, and 4 mL FBS to prepare 100 mL FACS buffer.
- Prepare only the volume of FACS buffer needed for approximately 2 weeks.
- Store FACS buffer at 4°C.
- Prepare 1% paraformaldehyde (PFA).
CAUTION: Handle PFA as a flammable, reactive carcinogen. Wear appropriate personal protective equipment and prepare PFA inside a certified chemical fume hood.- Mix 350 mL water and 50 mL 10× PBS, place the solution on a heated stir plate, and heat it to 65°C. Gradually add 20 g PFA powder to the heated solution to prepare 4% PFA (weight/volume).
- Add 1–3 drops of 5 M sodium hydroxide (NaOH) to facilitate dissolution of the PFA. Stir the solution on a heated stir plate for approximately 20 min. Use a pH meter to adjust the pH to 7.4.
- Bring the final volume to 500 mL with water.
- Aliquot the 4% PFA into 50 mL volumes and store at −20°C for up to 1 year. After thawing, store the 4% PFA at 4°C for up to 2 months. Discard any remaining thawed 4% PFA after 2 months.
- Dilute the 4% PFA to 1% PFA using 1× PBS and store the diluted solution at 4°C for up to 4 weeks17.
- Prepare cold 70% ethanol (EtOH) by combining 70 mL of 200-proof ethanol with 30 mL of Type I ultrapure water.
- Store the 70% EtOH at −20°C for up to 1 year. Keep the solution ice cold immediately before addition to cells for permeabilization.
2. Collect and count cells
- Transfer cells from a 10 cm tissue culture plate into a 15 mL centrifuge tube.
- Centrifuge the cells at 600 × g for 5 min at 4°C with the brake on to pellet the cells.
- Remove the culture medium and wash the cells by resuspending them in 5 mL of 1× PBS. Centrifuge again at 600 × g for 5 min at 4°C with the brake on, then aspirate the supernatant, leaving the cell pellet.
- Resuspend the cell pellet in 1× PBS. Count the cells using a hemocytometer or an automated cell counter by mixing 10 µL of cell suspension with 10 µL trypan blue, loading the sample onto a cell counting slide, and determining the cell concentration.
NOTE: Proceed only if cell viability is >90% to ensure reliable results. - Centrifuge the cell suspension at 600 × g for 5 min at 4°C with brake on and aspirate the supernatant, leaving the cell pellet. Resuspend the cells to a density of 2 × 10⁵ viable cells/mL (minimum 0.5 × 10⁵ viable cells/mL).
- Dispense 1 mL of cell suspension into the required number of sample and control flow tubes.
- Prepare separate sample tubes for each target protein and staining workflow. Surface (Pre-PFA), Post-PFA, Pre-EtOH, and Post-EtOH staining conditions are performed using independent sample tubes rather than sequential staining of the same cells. For example, when assessing two target proteins, prepare eight tubes: Tube 1 (primary antibody A, Pre-PFA), Tube 2 (primary antibody B, Pre-PFA), Tube 3 (primary antibody A, Post-PFA), Tube 4 (primary antibody B, Post-PFA), Tube 5 (primary antibody A, Pre-EtOH), Tube 6 (primary antibody B, Pre-EtOH), Tube 7 (primary antibody A, Post-EtOH), and Tube 8 (primary antibody B, Post-EtOH).
NOTE: As shown in the staining workflow (Figure 1), perform primary and secondary antibody staining for the Pre-PFA and Pre-EtOH samples on Day 1. Perform primary and secondary antibody staining for the Post-PFA and Post-EtOH samples on Day 2. - Prepare unstained and single-stained control tubes for each treatment condition. If assessing viability and two target proteins, prepare one unstained control, one viability dye-only control, and one secondary antibody-only control for each treatment condition.
NOTE: Although the primary antibody is unconjugated, a primary antibody-only control may be included during assay validation or when evaluating nonspecific primary antibody binding. - Subject all unstained and single-stained control tubes to the same treatments as the sample tubes. If samples are fixed with 1% PFA and permeabilized with 70% EtOH, process the control tubes identically.
- Prepare separate sample tubes for each target protein and staining workflow. Surface (Pre-PFA), Post-PFA, Pre-EtOH, and Post-EtOH staining conditions are performed using independent sample tubes rather than sequential staining of the same cells. For example, when assessing two target proteins, prepare eight tubes: Tube 1 (primary antibody A, Pre-PFA), Tube 2 (primary antibody B, Pre-PFA), Tube 3 (primary antibody A, Post-PFA), Tube 4 (primary antibody B, Post-PFA), Tube 5 (primary antibody A, Pre-EtOH), Tube 6 (primary antibody B, Pre-EtOH), Tube 7 (primary antibody A, Post-EtOH), and Tube 8 (primary antibody B, Post-EtOH).
- Prepare single-stained compensation controls using compensation beads.
NOTE: Beads may be used instead of cells to prepare compensation controls.- Label one compensation control tube for each fluorophore and one unstained control tube. If using a viability dye and two secondary antibodies labeled with different fluorophores, prepare four tubes: one unstained control, one viability dye control (fluorophore 1), one secondary antibody A control (fluorophore 2), and one secondary antibody B control (fluorophore 3).
NOTE: If using an amine-reactive viability dye, use amine-reactive compensation beads for the viability dye control. - Add only one dye or antibody to each compensation control tube so that each control is positive for a single fluorophore during flow cytometric compensation.
- Label one compensation control tube for each fluorophore and one unstained control tube. If using a viability dye and two secondary antibodies labeled with different fluorophores, prepare four tubes: one unstained control, one viability dye control (fluorophore 1), one secondary antibody A control (fluorophore 2), and one secondary antibody B control (fluorophore 3).
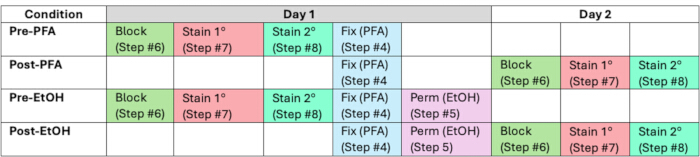
Figure 1. Optimized staining workflow for surface-associated and intracellular target detection. The workflow illustrates the sequence and timing of fixation, permeabilization, blocking, primary antibody staining, and secondary antibody staining following fixable viability dye staining. Separate workflows are shown for the Pre-PFA, Post-PFA, Pre-EtOH, and Post-EtOH conditions. Primary and secondary antibody staining are performed on Day 1 for the Pre-PFA and Pre-EtOH workflows and on Day 2 for the Post-PFA and Post-EtOH workflows. PFA, paraformaldehyde; EtOH, ethanol. Please click here to view a larger version of this figure.
3. Stain cells with a fixable viability dye
- Stain the cells with a fixable viability dye according to the manufacturer’s instructions. Add 1 µL of viability dye stock solution (prepared in Step 1.4) directly to each sample tube and the corresponding viability dye single-stained control tube containing 1 × 10⁶ cells in 1 mL of 1× PBS.
- Vortex gently for 3 s and incubate the samples at room temperature for 30 min, protected from light.
NOTE: Protect the cells from light during this and all subsequent steps. - Centrifuge the cell suspension at 600 × g for 5 min at 4°C with the brake on, then aspirate the supernatant, leaving the cell pellet.
- Wash the cells twice with 1 mL of 1× PBS and resuspend the final cell pellet in 100 µL of 1× PBS.
NOTE: If staining cell surface targets with fluorophore-conjugated primary antibodies, perform surface staining at this stage according to the manufacturer's instructions before proceeding to fixation.
4. Treat cells with 1% PFA
NOTE: For Pre-PFA samples (see Step 2.6.1 and Figure 1), perform Steps 6, 7, and 8 before proceeding with this section.
- To the cells resuspended in 100 µL of 1× PBS, add 1 mL of 1% PFA to each sample tube, including all single-stained control tubes. Vortex gently for 3 s and incubate the samples at room temperature for 15–20 min, protected from light.
- Centrifuge the cell suspension at 600 × g for 5 min at 4°C with the brake on. Aspirate and discard the supernatant, leaving the cell pellet.
- Wash the cell pellet twice by resuspending it in 1 mL of FACS buffer, followed by centrifugation at 600 × g for 5 min at 4°C with the brake on.
- Resuspend the final cell pellet in 100 µL of FACS buffer.
NOTE: Fixed cells (stained or unstained) may be stored in 1 mL of FACS buffer at 4°C for 12–48 h. To resume the protocol, centrifuge the cell suspension at 600 × g for 5 min at 4°C with the brake on, aspirate the supernatant, and resuspend the cell pellet in 100 µL of FACS buffer.
5. Permeabilize cells with EtOH
NOTE: For Pre-EtOH samples (see Step 2.6.1 and Figure 1), perform Steps 6, 7, and 8 before proceeding with this section.
- Gently add 1 mL of ice-cold 70% EtOH to the inside wall of each sample tube containing 100 µL of cell suspension, then immediately vortex at approximately 50% power for 5 s. Repeat this procedure for all remaining sample tubes and single-stained control tubes.
- Incubate the tubes at −20°C for at least 2 h, protected from light.
NOTE: Cells may be stored in 1 mL of 70% EtOH at −20°C for 12–48 h before continuing the protocol. - Centrifuge the cell suspension at 600 × g for 5 min at 4°C with the brake on, then aspirate the supernatant, leaving the cell pellet.
- Wash the cells three times with 1 mL of FACS buffer, centrifuging at 600 × g for 5 min at 4°C with the brake on between washes.
- Resuspend the final cell pellet in 100 µL of FACS buffer.
6. Block cells
- Add 820 µL of FACS buffer and 80 µL of normal goat serum (NGS) to each tube to prepare a final blocking solution containing 92% FACS buffer and 8% NGS. Vortex gently for 3 s and incubate the samples at room temperature for 30 min, stationary and protected from light.
- Centrifuge the cell suspension at 600 × g for 5 min at 4°C with the brake on, then aspirate the supernatant, leaving the cell pellet.
- Wash the cells twice by resuspending the pellet in 1 mL of FACS buffer followed by centrifugation as described in Step 6.2.
- Resuspend the final cell pellet in 100 µL of FACS buffer.
7. Stain cells with an unconjugated primary antibody
- Add 0.5 µL of the unconjugated primary antibody to 100 µL of cell suspension (1:200 dilution). Incubate the samples at room temperature for 1 h, protected from light.
NOTE: The 1:200 dilution is a recommended starting concentration and may require optimization for other antibodies.- If performing peptide competition, add the peptide immediately before adding the primary antibody. In this protocol, peptides were titrated at peptide-to-antibody molar ratios ranging from 50 to 0.625, calculated relative to the antibody concentration (4.3 nM) in the reaction mixture. Optimization may be required for individual peptide–antibody pairs.
- Add 1 mL of FACS buffer and centrifuge the cell suspension at 600 × g for 5 min at 4°C with the brake on. Aspirate the supernatant, leaving the cell pellet.
- Wash the cells twice more with 1 mL of FACS buffer, centrifuging as described in Step 7.2.
- Resuspend the final cell pellet in 100 µL of FACS buffer.
8. Stain cells with a fluorophore-conjugated secondary antibody
- Add a 1:200 dilution of the fluorophore-conjugated secondary antibody (0.5 µL antibody in 100 µL of cell suspension) to each sample tube and the corresponding control tube.
NOTE: Goat anti-rabbit DyLight 488 secondary antibody was used in this protocol. - Incubate the samples at room temperature for 1 h, protected from light.
- Add 1 mL of FACS buffer. Centrifuge the cell suspension at 600 × g for 5 min at 4°C with the brake on, then aspirate the supernatant, leaving the cell pellet.
- Wash the cells twice with 1 mL of FACS buffer by repeating the centrifugation described in Step 8.3.
- Resuspend the cells in 300–500 µL of FACS buffer.
NOTE: Cells may be stored in FACS buffer at 4°C, protected from light, for 1–3 days before flow cytometric analysis.
9. Analyze samples by flow cytometry
- Perform fluorescence compensation using the appropriate single-stained controls. Acquire the samples on a flow cytometer and collect at least 5,000–10,000 live single-cell events for analysis. For this protocol, FACSDiva software was used for data acquisition.
- Analyze the data by first excluding debris using forward scatter area (FSC-A) versus side scatter area (SSC-A), followed by exclusion of doublets using FSC-height (FSC-H) versus FSC-width (FSC-W) and SSC-height (SSC-H) versus SSC-width (SSC-W). Exclude dead cells using the viability dye channel.
- Analyze the percentage of the remaining live single cells that are positive or negative for the selected target proteins (see Representative Results). Establish positive gates using the unstained and secondary antibody-only controls, and apply identical gating criteria to all comparable samples within the same acquisition batch.
Results
The protocol described here enables intracellular staining of protein targets for which commercial antibodies validated for flow cytometry are unavailable. As a representative example, staining of splicing factor 3a subunit 1 (SF3A1), a ubiquitously expressed splicing protein that localizes to the nucleus, was evaluated using a rabbit polyclonal antibody raised against a peptide corresponding to amino acids 18–37 of SF3A1 (SF3A118–37; EPKQPTEEEASSKEDSAPSK)18,19.
To evaluate the staining workflow, cells were stained with the unconjugated anti-SF3A118–37 primary polyclonal antibody either before or after treatment with paraformaldehyde (PFA) alone or sequential PFA + EtOH treatment (Figures 1 and 2). As expected, no SF3A1-positive population was detected in samples stained before PFA treatment (Pre-PFA) or before sequential PFA and EtOH treatment (Pre-EtOH) (Figure 2A). Staining performed after PFA treatment alone (Post-PFA) identified a small SF3A1-positive population (Figure 2B). In contrast, a distinct SF3A1-positive population was observed only when staining was performed after EtOH permeabilization (Post-EtOH) (Figure 2B). These findings indicate that the workflow detects substantially greater SF3A1 staining following EtOH permeabilization than following PFA treatment alone.
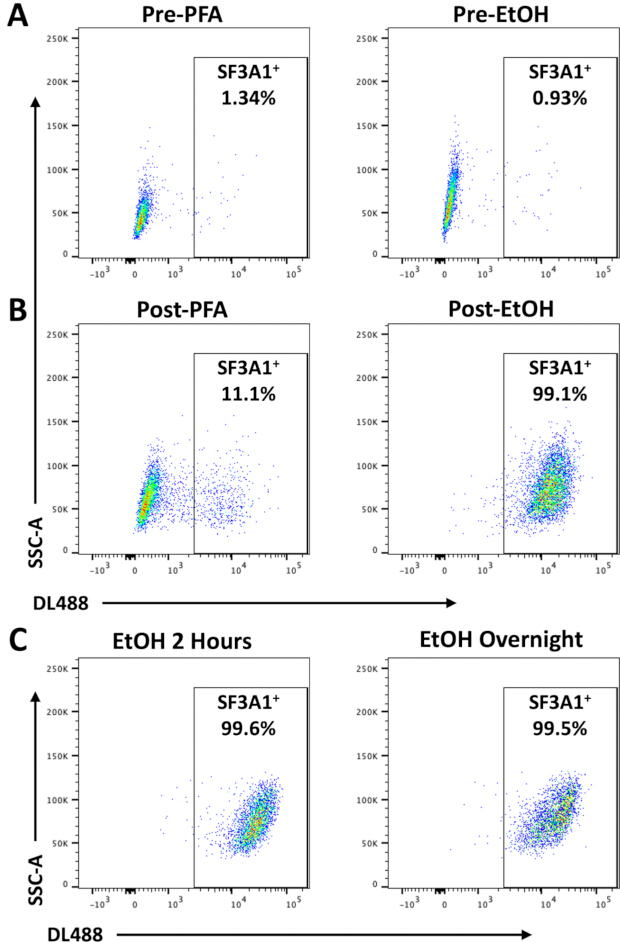
Figure 2. Assessment of SF3A1 staining following paraformaldehyde fixation and ethanol permeabilization. Representative flow cytometry plots of live, viability dye-negative K562 cells showing DyLight 488 (DL488) fluorescence versus side scatter area (SSC-A). The boxed region indicates the SF3A1-positive (SF3A1⁺) population. SF3A1, splicing factor 3a subunit 1; PFA, paraformaldehyde; EtOH, ethanol. (A) SF3A1 antibody staining performed before PFA fixation (Pre-PFA; left) or before sequential PFA fixation and EtOH permeabilization (Pre-EtOH; right). (B) SF3A1 antibody staining performed after PFA fixation (Post-PFA; left) or after sequential PFA fixation and EtOH permeabilization (Post-EtOH; right). (C) Comparison of SF3A1 staining following EtOH permeabilization for 2 h or overnight. Please click here to view a larger version of this figure.
To determine whether the duration of EtOH exposure affected staining or cell integrity, cells were treated with EtOH for either 2 h or overnight. Flow cytometric analysis showed no appreciable differences in staining intensity or apparent cell integrity between the two conditions (Figure 2C). These findings indicate that 2 h of EtOH permeabilization produced staining comparable to overnight incubation under the conditions tested.
After confirming that EtOH permeabilization produced detectable SF3A1 staining (Figure 2B) and establishing baseline SF3A1 staining in the absence of competing peptide (Figure 3A), antibody specificity was evaluated by peptide competition. Cells were incubated with either SF3A118–37 or a nonspecific control peptide corresponding to amino acids 778–793 of SF3A1 (SF3A1778–793; GAVIHLALKERGGRKK). Peptides were added together with the primary antibody (Protocol, Step 7). Incubation with an excess of the specific peptide SF3A118–37 reduced the percentage of SF3A1-positive cells to a level comparable to the unstained control, whereas the nonspecific peptide SF3A1778–793 did not measurably alter the staining profile (Figure 3B,C). Peptide titration experiments demonstrated dose-dependent inhibition of antibody binding by the cognate peptide SF3A118–37 (IC50 = 21.6 nM), whereas no inhibition was observed with up to a 50-fold molar excess of the nonspecific peptide SF3A1778–793 (Figure 3D). These results demonstrate that the peptide competition assay can be used to evaluate inhibition of antibody binding by flow cytometry.
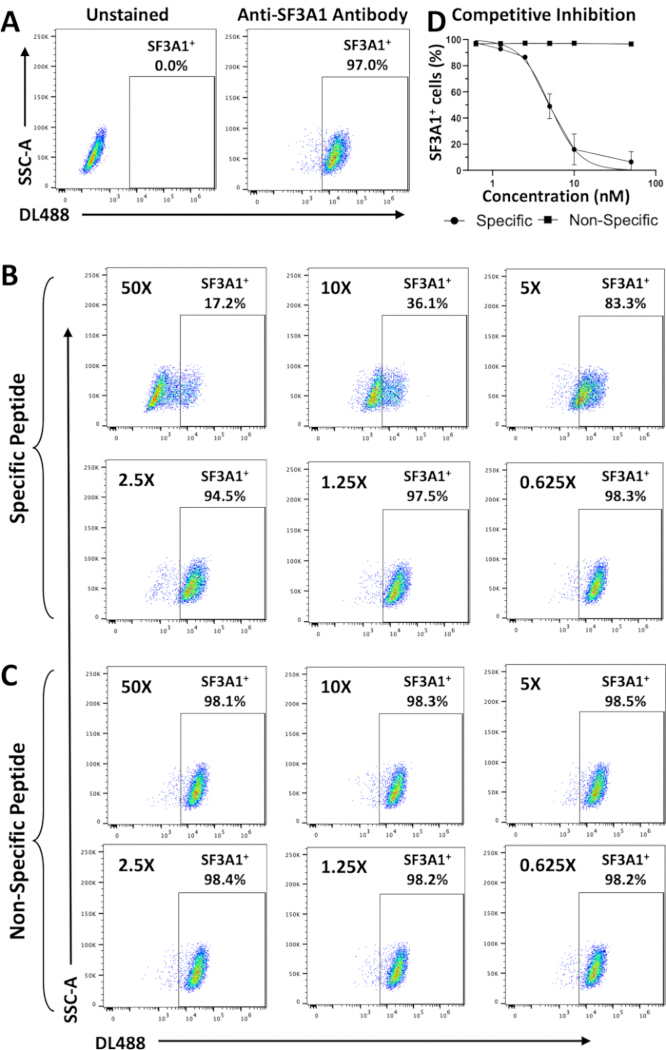
Figure 3. Dose-dependent competitive inhibition of SF3A1 antibody staining by a cognate peptide. Representative flow cytometry plots of live, viability dye-negative K562 cells showing DyLight 488 (DL488) fluorescence versus side scatter area (SSC-A). The boxed region indicates the SF3A1-positive (SF3A1⁺) population. SF3A1, splicing factor 3a subunit 1. (A) Unstained control and anti-SF3A1 antibody staining. (B) SF3A1 staining following dose-dependent addition of the cognate SF3A1(18–37) peptide. (C) SF3A1 staining following dose-dependent addition of the nonspecific SF3A1(778–793) peptide. Peptide concentrations were 216, 43.3, 21.7, 10.8, 5.4, and 2.7 nM, the corresponding peptide-to-antibody molar ratios shown in the figure were calculated relative to a 4.33 nM SF3A1 antibody concentration. (D) Competitive inhibition curve showing the percentage of SF3A1-positive cells as a function of peptide concentration. The cognate SF3A1(18–37) peptide inhibited antibody binding in a dose-dependent manner, whereas the SF3A1(778–793) peptide did not. The half-maximal inhibitory concentration (IC₅₀) for the cognate peptide was 21.6 nM, determined using a best-fit nonlinear inhibitor-versus-normalized-response model with a variable slope. Please click here to view a larger version of this figure.
Finally, the protocol was evaluated for detection of erythropoietin receptor (EpoR), a cell-surface receptor that is also present intracellularly during receptor biosynthesis and following ligand-induced internalization20,21. EpoR is a 508-amino-acid protein consisting of an extracellular N-terminal domain, a single transmembrane region spanning amino acids 251–273, and an intracellular C-terminal domain. An unconjugated rabbit polyclonal anti-EpoR antibody (BS-1424R), previously validated for western blotting, immunohistochemistry, and immunofluorescence but not for flow cytometry22,23,24,25,26, was applied using the staining workflow described above. According to the manufacturer, BS-1424R was raised against amino acids 330–365 within the intracellular domain of EpoR.
When cells were stained before PFA treatment (Pre-PFA), <10% of K562 cells were positive for EpoR staining (Figure 4A). In contrast, approximately 77% and 84% of K562 cells were positive following PFA treatment alone (Post-PFA) and sequential PFA plus EtOH treatment (Post-EtOH), respectively (Figure 4B–D). In contrast with SF3A1 staining, increased EpoR staining was observed following both the Post-PFA and Post-EtOH workflows (compare Figures 2B and 4D). These findings are consistent with the location of the BS-1424R epitope within the intracellular domain of EpoR. Detection of EpoR immunoreactivity under both staining conditions indicates that PFA treatment sufficiently permeabilizes the plasma membrane of K562 cells to permit antibody binding to the intracellular epitope. In this workflow, use of a single secondary antibody requires assessment of surface and intracellular EpoR pools using separately treated and stained samples. This limitation may be overcome by using primary antibodies raised in different host species to enable multiplex detection with species-specific secondary antibodies.
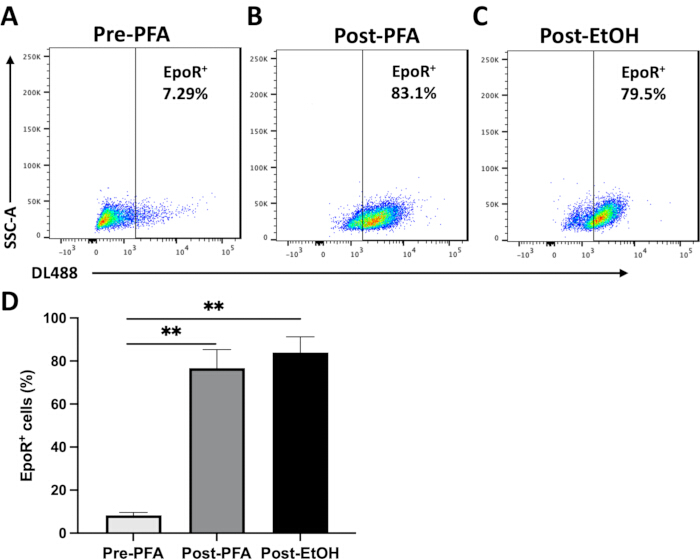
Figure 4. Detection of erythropoietin receptor (EpoR) in K562 cells following different fixation and permeabilization conditions. Representative flow cytometry plots of live, viability dye-negative K562 cells showing DyLight 488 (DL488) fluorescence versus side scatter area (SSC-A). The boxed region indicates the EpoR-positive (EpoR⁺) population. EpoR staining was performed using the BS-1424R polyclonal antibody raised against amino acids 330–365 within the intracellular domain of EpoR. (A) EpoR staining before PFA fixation (Pre-PFA). (B) EpoR staining after PFA fixation (Post-PFA). (C) EpoR staining after sequential PFA fixation and EtOH permeabilization (Post-EtOH). (D) Quantification of EpoR-positive cells under each staining condition. Data are presented as the mean ± standard error of the mean (SEM) from three independent experiments (n = 3). Statistical significance was determined using Student's t-test. P < 0.01 is indicated by **. Comparisons shown are Pre-PFA versus Post-PFA and Pre-PFA versus Post-EtOH. Ab, antibody; EpoR, erythropoietin receptor; PFA, paraformaldehyde; EtOH, ethanol. Please click here to view a larger version of this figure.
Discussion
The results presented here highlight several critical parameters for the detection of proteins by intracellular flow cytometry using unconjugated primary antibodies. An important consideration is the permeabilization strategy, which should be selected according to the intracellular localization of the target protein. In the workflow described here, PFA fixation followed by EtOH permeabilization enabled detection of the nuclear protein SF3A1, whereas EpoR immunoreactivity was detected using both the Post-PFA and Post-EtOH workflows. When assessing surface proteins, staining should be performed before PFA treatment, whereas intracellular staining can be performed after PFA treatment and, where required, followed by additional EtOH permeabilization. This workflow enables assessment of surface-associated and intracellular proteins within immunophenotypically defined cell populations using separate staining conditions.
Although PFA is generally used as a cell fixative, treatment with 1% PFA sufficiently permeabilized the plasma membrane of K562 cells to allow binding of the EpoR antibody to an intracellular epitope. PFA-mediated permeabilization has also been shown to permit antibody entry in other cell lines, including HEK293T and HeLa cells; however, this was achieved using a higher PFA concentration (4%)11. These differences suggest cell type-specific effects of PFA; therefore, optimization of fixation conditions may be required to maximize epitope detection. Alternative cell permeabilization reagents include the detergents saponin, digitonin, and Triton X-100, which act through different mechanisms. Whereas Triton X-100 nonspecifically permeabilizes cellular membranes, saponin and digitonin permeabilize cells by binding cholesterol and other membrane sterols27. Studies have demonstrated that low concentrations of digitonin selectively permeabilize the plasma membrane while preserving the integrity of mitochondrial and nuclear membranes28,29,30. Thus, appropriate combinations of these reagents may be used to distinguish protein localization within different subcellular compartments, although one limitation of these approaches is the potential loss of intracellular antigens and epitope integrity13,31.
The protocol is readily adaptable and can be modified according to experimental requirements. For example, the duration of EtOH treatment can be adjusted without an apparent loss of staining performance or cell integrity, providing flexibility for multi-day workflows, particularly when pre- and post-permeabilization staining conditions are performed in parallel (Figure 1). The protocol may also be applied to other cell types, including primary human hematopoietic cells; however, fixation, permeabilization, and centrifugation conditions may require optimization because these treatments can influence epitope accessibility, antibody binding efficiency, cellular integrity, and fluorescence signal intensity14,32,33. Additionally, optimization of PFA and EtOH exposure times, as well as centrifugation conditions, may help maintain cell viability and minimize excessive cell loss. Detection of additional protein targets is likewise possible following optimization of antibody concentration and incubation conditions.
Potential limitations include weak signal intensity, which may be improved by increasing the primary antibody concentration or by using secondary antibody amplification. Nonspecific staining may be reduced through optimization of blocking conditions or by peptide competition. The use of polyclonal antibodies may also introduce batch-to-batch variability and increase the potential for off-target binding; therefore, antibody specificity should be carefully validated for each application. Furthermore, peptide competition demonstrates dependence on the immunizing peptide but does not independently establish antibody specificity. In the case of the anti-SF3A1 antibody, previous immunoprecipitation studies have established antibody specificity19. Additional complementary approaches for validating antibody specificity include antigen depletion, gene knockdown, gene knockout, or the use of antigen-negative cell models. In addition, this approach is not inherently compatible with all multicolor panels because the use of multiple secondary antibodies may introduce cross-reactivity and limit multiplexing unless appropriate controls are implemented. Careful selection of secondary antibodies and fluorophores is therefore important to minimize background staining and maximize signal resolution.
The protocol described here provides a workflow for flow cytometric assessment of intracellular proteins in K562 human erythroleukemia cells. It also supports evaluation of antibody performance by peptide competition and assessment of receptor-associated immunoreactivity under different staining conditions. The approach may be useful for investigating changes in protein expression during cellular differentiation or in response to extracellular stimuli, including studies of transcription factors, RNA-processing proteins, and receptor biology within immunophenotypically defined cell populations. In a separate study, this workflow was used to investigate erythropoietin-mediated changes in intracellular lipid metabolic enzymes in human hematopoietic stem and progenitor cells undergoing erythroid differentiation34, demonstrating the adaptability of the protocol to primary cells. Overall, this protocol expands the application of unconjugated primary antibodies in flow cytometry and provides a flexible workflow for evaluating protein expression in cultured cells.
Disclosures
The authors have nothing to disclose.
Acknowledgements
The authors acknowledge funding support to SS from the National Institute of General Medical Sciences (R01GM127464) and the National Cancer Institute (P30CA023074), both of the National Institutes of Health, the Valley Research Partnership Program (VRP P1-4009 and VRP77), and the Arizona Biomedical Research Center (ABRC: RFGA2022-010-30). The content is solely the responsibility of the authors and does not necessarily represent the official views of the National Institutes of Health. The authors also acknowledge the support of Dr. Mrinalini Kala, Director of the Flow Cytometry Core Facility, College of Medicine–Phoenix, University of Arizona.
Materials
| Name | Company | Catalog Number | Comments |
|---|---|---|---|
| 10× Phosphate-buffered saline (PBS) | In-house | N/A | Alternative: Commercially available PBS |
| 15 mL centrifuge tubes | VWR | 89039-664 | Alternative: Any sterile centrifuge tube of appropriate size |
| 5 mL round-bottom polystyrene tubes | Corning | 352052 | Alternative: Any flow cytometry tube compatible with the available cytometer |
| Anti-rabbit DyLight 488 secondary antibody | Thermo Fisher Scientific | PI35553 | Alternative: Secondary antibody compatible with the primary antibody host species |
| Automated cell counter | Thermo Fisher Scientific | AMQAF2000 | Alternative to hemocytometer |
| ArC Amine Reactive Compensation Bead Kit | Thermo Fisher Scientific | A10628 | Alternative: Cells; if using cells for single-stain controls, process all control tubes identically to sample tubes |
| Bottle-top filter | Thermo Fisher Scientific | 595-4520 | Nylon membrane; 0.2 µm |
| Cell counting slides | Thermo Fisher Scientific | C10228 | Required only when using an automated cell counter |
| Dimethyl sulfoxide (DMSO) | Supplied with viability dye kit | N/A | Used to reconstitute the lyophilized viability dye |
| Ethanol, 200 proof | Thermo Fisher Scientific | BP28184 | Molecular biology grade; used to prepare ice-cold 70% ethanol |
| Erythropoietin Receptor Primary Polyclonal Antibody | Bioss | BS-1424R | |
| Fetal bovine serum (FBS) | Omega Scientific | FB-12 | Alternative: Any FBS validated for the target cell line |
| Flow cytometer | BD Biosciences | BD Canto II | Alternative: Any suitable flow cytometer |
| Hemocytometer | Hausser Scientific | HS3200 | Alternative: Automated cell counter |
| Heated magnetic stir plate | Thermo Fisher Scientific | SP88857100 | Used for preparation of PBS and paraformaldehyde |
| K562 human myelogenous leukemia cells | ATCC | CCL-243 | Can purchase from any other authenticated source |
| Live-or-Dye fixable viability dye (405/545) | Biotium | 32009 | Alternative: Any compatible fixable viability dye. Non-fixable dyes (e.g., 7-AAD) are not suitable |
| Normal goat serum | Thermo Fisher Scientific | 16210064 | Used for blocking |
| Paraformaldehyde powder | Sigma-Aldrich | P6148 | Alternative: Commercially available paraformaldehyde solution |
| pH meter/probe | Accumet | AB15 | Used to adjust buffer pH |
| Potassium chloride (KCl) | Thermo Fisher Scientific | BP366-1 | |
| Potassium phosphate monobasic (KH2PO4) | Thermo Fisher Scientific | BP362-1 | |
| SF3A1 Primary Polyclonal Antibody | In-house | N/A | |
| Sodium chloride (NaCl) | Thermo Fisher Scientific | BP358-1 | |
| Sodium hydroxide solution (5 M) | MilliporeSigma | S8263 | Alternative: Prepare a 5 M solution from sodium hydroxide pellets |
| Sodium phosphate dibasic (Na2HPO4) | Thermo Fisher Scientific | BP332-1 | |
| Stir bar | VWR | 74950-286 | Used with the magnetic stir plate |
| Trypan Blue, 0.4% | Thermo Fisher Scientific | 15250061 | Used for cell viability counting |
| UltraComp eBeads Compensation Beads | Thermo Fisher Scientific | 01-2222-42 | Alternative: Cells; if using cells for single-stain controls, process all control tubes identically to sample tubes |
References
- Schippel N, Sharma S. Dynamics of human hematopoietic stem and progenitor cell differentiation to the erythroid lineage. Exp Hematol. 2023;123:1-17. DOI:10.1016/j.exphem.2023.05.001.
- Schippel N, Kala M, Sharma S. Erythropoietin-dependent acquisition of CD71hiCD105hi phenotype within CD235a- early erythroid progenitors. Stem Cells. 2025;43(12). DOI:10.1093/stmcls/sxaf061.
- Robinson JP. Flow cytometry: past and future. BioTechniques. 2022;72(4):159-169. DOI:10.2144/btn-2022-0005.
- Freer G, Rindi L. Intracellular cytokine detection by fluorescence-activated flow cytometry: basic principles and recent advances. Methods. 2013;61(1):30-38. DOI:10.1016/j.ymeth.2013.03.035.
- Krutzik PO, Nolan GP. Intracellular phospho-protein staining techniques for flow cytometry: monitoring single-cell signaling events. Cytometry A. 2003;55(2):61-70. DOI:10.1002/cyto.a.10072.
- Manso BA, Medina KL. Standardized flow-cytometry-based protocol to simultaneously measure transcription factor levels. STAR Protoc. 2021;2(2):100485. DOI:10.1016/j.xpro.2021.100485.
- Hallden G, Andersson U, Hed J, Johansson SG. A new membrane permeabilization method for the detection of intracellular antigens by flow cytometry. J Immunol Methods. 1989;124(1):103-109. DOI:10.1016/0022-1759(89)90191-9.
- Kalina T, Lundsten K, Engel P. Relevance of antibody validation for flow cytometry. Cytometry A. 2020;97(2):126-136. DOI:10.1002/cyto.a.23895.
- Voskuil JL. The challenges with the validation of research antibodies. F1000Res. 2017;6:161. DOI:10.12688/f1000research.10851.1.
- Koeffler HP, Golde DW. Human myeloid leukemia cell lines: a review. Blood. 1980;56(3):344-350.
- Bernard E, et al. Assessing the limitations of paraformaldehyde fixation for accurate cell surface receptor measurement. Front Pharmacol. 2026;17:1727410. DOI:10.3389/fphar.2026.1727410.
- Jamur MC, Oliver C. Permeabilization of cell membranes. Methods Mol Biol. 2010;588:63-66. DOI:10.1007/978-1-59745-324-0_9.
- Cheng R, et al. Influence of fixation and permeabilization on the mass density of single cells: a surface plasmon resonance imaging study. Front Chem. 2019;7:588. DOI:10.3389/fchem.2019.00588.
- Hobro AJ, Smith NI. An evaluation of fixation methods: spatial and compositional cellular changes observed by Raman imaging. Vib Spectrosc. 2017;91:31-45. DOI:10.1016/j.vibspec.2016.10.012.
- Schimenti KJ, Jacobberger JW. Fixation of mammalian cells for flow cytometric evaluation of DNA content and nuclear immunofluorescence. Cytometry. 1992;13(1):48-59. DOI:10.1002/cyto.990130109.
- Kandarian F, Sunga GM, Arango-Saenz D, Rossetti M. A flow cytometry-based cytotoxicity assay for the assessment of human NK cell activity. J Vis Exp. 2017;(126). DOI:10.3791/56191.
- Bapat A, Keita N, Sharma S. Pan-myeloid differentiation of human cord blood derived CD34+ hematopoietic stem and progenitor cells. J Vis Exp. 2019;(150). DOI:10.3791/59836.
- Martelly W, et al. Identification of a noncanonical RNA binding domain in the U2 snRNP protein SF3A1. RNA. 2019;25(11):1509-1521. DOI:10.1261/rna.072256.119.
- Sharma S, et al. Stem-loop 4 of U1 snRNA is essential for splicing and interacts with the U2 snRNP-specific SF3A1 protein during spliceosome assembly. Genes Dev. 2014;28(22):2518-2531. DOI:10.1101/gad.248625.114.
- Sulahian R, Cleaver O, Huang LJ. Ligand-induced EpoR internalization is mediated by JAK2 and p85 and is impaired by mutations responsible for primary familial and congenital polycythemia. Blood. 2009;113(21):5287-5297. DOI:10.1182/blood-2008-09-179572.
- Sinclair AM, et al. Erythropoietin receptor transcription is neither elevated nor predictive of surface expression in human tumour cells. Br J Cancer. 2008;98(6):1059-1067. DOI:10.1038/sj.bjc.6604220.
- Li X, et al. Oxidative stress induces the decline of brain EPO expression in aging rats. Exp Gerontol. 2016;83:89-93. DOI:10.1016/j.exger.2016.07.012.
- Liu T, et al. Multifaceted roles of a bioengineered nanoreactor in repressing radiation-induced lung injury. Biomaterials. 2021;277:121103. DOI:10.1016/j.biomaterials.2021.121103.
- Zhang Y, et al. Erythropoietin receptor is a risk factor for prognosis: a potential biomarker in lung adenocarcinoma. Pathol Res Pract. 2023;251:154891. DOI:10.1016/j.prp.2023.154891.
- Liu J, et al. Lithium chloride promotes endogenous synthesis of CLA in bovine mammary epithelial cells. Biol Trace Elem Res. 2024;202(2):513-526. DOI:10.1007/s12011-023-03679-z.
- Wu G, et al. EPO promotes the progression of rheumatoid arthritis by inducing desialylation via increasing the expression of neuraminidase 3. Ann Rheum Dis. 2024;83(5):564-575. DOI:10.1136/ard-2023-224852.
- Sudji IR, et al. Membrane disintegration caused by the steroid saponin digitonin is related to the presence of cholesterol. Molecules. 2015;20(11):20146-20160. DOI:10.3390/molecules201119682.
- Niklas J, Melnyk A, Yuan Y, Heinzle E. Selective permeabilization for the high-throughput measurement of compartmented enzyme activities in mammalian cells. Anal Biochem. 2011;416(2):218-227. DOI:10.1016/j.ab.2011.05.039.
- Liu J, Xiao N, DeFranco DB. Use of digitonin-permeabilized cells in studies of steroid receptor subnuclear trafficking. Methods. 1999;19(3):403-409. DOI:10.1006/meth.1999.0876.
- Krawczyk E, Suprynowicz FA, Sudarshan SR, Schlegel R. Membrane orientation of the human papillomavirus type 16 E5 oncoprotein. J Virol. 2010;84(4):1696-1703. DOI:10.1128/JVI.01968-09.
- Goldenthal KL, et al. Postfixation detergent treatment for immunofluorescence suppresses localization of some integral membrane proteins. J Histochem Cytochem. 1985;33(8):813-820. DOI:10.1177/33.8.3894499.
- Fahlberg MD, et al. Overcoming fixation and permeabilization challenges in flow cytometry by optical barcoding and multi-pass acquisition. Cytometry A. 2024;105(11):838-848. DOI:10.1002/cyto.a.24904.
- Law JP, et al. The importance of Foxp3 antibody and fixation/permeabilization buffer combinations in identifying CD4+CD25+Foxp3+ regulatory T cells. Cytometry A. 2009;75(12):1040-1050. DOI:10.1002/cyto.a.20815.
- Schippel N, et al. Erythropoietin mediates glycerophospholipid remodeling during human early erythropoiesis. bioRxiv. 2026. DOI:10.64898/2026.02.20.707106.
Reprints and Permissions
This article has been published
Video Coming Soon