Functional near-infrared spectroscopy data from two task paradigms were evaluated using seven machine-learning classifiers under fold-specific preprocessing and leave-one-out cross-validation; observed performance was modest and did not exceed chance in permutation testing.
Research Article
Functional Near-Infrared Spectroscopy Combined with Machine Learning for Exploratory Classification of Autism Spectrum Disorder in Young Children
In This Article
Summary
Abstract
Early identification of autism spectrum disorder (ASD) may facilitate timely intervention, while diagnosis remains clinically based. This exploratory study evaluated fNIRS-derived features using multiple machine-learning algorithms to compare observed classification performance between young children aged 2–6 years with ASD and typically developing (TD) children. β-activation values from eight channels were used as features to differentiate the ASD and TD groups. Two paradigm-specific analytic datasets were analyzed. Paradigm 1 comprised three tasks and included 60 participants (29 children with ASD and 31 TD children), with 24 β features per participant. Paradigm 2 comprised two tasks and included 58 participants (28 children with ASD and 30 TD children), with 16 β features per participant. Leave-one-out cross-validation was used to partition the data, and normalization and principal component analysis were applied for feature extraction. Seven classifiers—K-nearest neighbors (KNN), logistic regression (LR), support vector machine (SVM), decision tree (DT), random forest (RF), gradient boosting decision trees (GBDT), and XGBoost—were evaluated using accuracy, specificity, sensitivity, and area under the curve (AUC), and permutation testing was used to assess whether the observed classification performance exceeded that expected by chance. In Paradigm 1, KNN yielded the highest observed accuracy (0.567), whereas DT yielded the highest observed AUC (0.582). Paradigm 2 yielded numerically higher observed performance for several metrics, but no classifier significantly exceeded chance. These findings demonstrate the procedural feasibility of acquiring and analyzing task-based fNIRS data; however, independent diagnostic value beyond age and sex was not established and requires validation in larger, sex-balanced external cohorts. Overall classification performance was modest; none of the evaluated classifiers demonstrated statistically significant above-chance performance in the permutation tests, and the fNIRS features did not demonstrate statistically significant incremental predictive value beyond age and sex.
Introduction
Autism spectrum disorder (ASD) is a neurodevelopmental condition characterized by persistent impairments in social communication and social interaction, accompanied by restricted and repetitive behaviors, interests, or activities1. The global prevalence of ASD has risen steadily over recent years, highlighting an increasing public health concern. Globally, the prevalence of ASD is estimated at 0.02%–3.66% of the population2. In the United States, one in every 36 eight-year-old children was diagnosed with ASD3. A 2024 systematic review and meta-analysis estimated that the prevalence of ASD among children in mainland China from 2017 to 2023 was 7 per 1,000, compared with 26.5 per 10,000 before 20174. Early identification can facilitate timely access to intervention in early childhood, with the potential to improve developmental outcomes 1,2. However, current early-identification methods predominantly rely on subjective assessments or experiential judgments. Given the heterogeneity of ASD manifestations and its detrimental impact on children’s health, there is a pressing need for objective and reliable early-identification approaches.
ASD diagnosis is primarily based on standardized behavioral observations, developmental history, interviews, and questionnaires5,6. In recent decades, the development of brain imaging techniques such as electroencephalography (EEG), magnetoencephalography (MEG), functional magnetic resonance imaging (fMRI), positron emission tomography (PET), and functional near-infrared spectroscopy (fNIRS) has provided more technical methods to study the neural mechanisms of the brain in patients with ASD and to identify objective neuroimaging indicators7,8,9. Functional near-infrared spectroscopy (fNIRS) is a non-invasive neuroimaging modality that uses near-infrared light to monitor cerebral hemodynamics. By measuring changes in the concentrations of oxygenated hemoglobin (HbO) and deoxygenated hemoglobin (HbR) within cortical tissue, fNIRS enables quantitative assessment of brain activity in specific brain regions10.
In addition, owing to the technical difficulties of brain observation in infants and children, the populations in national and international studies of brain function in patients with ASD are dominated by adult and adolescent patients, with fewer studies in younger children. The emergence of fNIRS provides a new opportunity to explore clinical neurodevelopmental disorders. Near-infrared spectroscopic imaging is now considered a well-established brain imaging technique for studying infants and younger children11,12. Previous studies have identified ASD-related differences in resting-state hemodynamic fluctuations, functional connectivity, frequency-domain measures, and entropy-based features, and several studies have evaluated these features for classification13,14,15,16,17. Therefore, the general combination of fNIRS and machine learning is not itself novel. However, limited evidence is available on how the choice of a developmentally appropriate task paradigm influences the discriminative information obtained from fNIRS when acquisition, feature extraction, preprocessing, and validation procedures are held constant.
The present exploratory study, therefore, focused on the comparative evaluation of two task-based fNIRS paradigms in young children aged 2–6 years: a facial-image-processing paradigm and a social-interaction-game paradigm. Condition-specific β values from eight channels were evaluated with seven machine-learning classifiers within a harmonized, leakage-controlled cross-validation framework. Rather than introducing a new classifier, this study used a consistent fold-specific preprocessing and validation pipeline to compare two developmentally appropriate task paradigms. The analyses were exploratory and were not intended to establish clinical diagnostic utility. This framework was intended to assess not only predictive performance but also the neurophysiological interpretability.
Protocol
This was a single-center, cross-sectional observational study designed to compare task-evoked fNIRS responses and exploratory machine-learning classification performance between young children with ASD and typically developing controls. This study was approved by the Ethics Committee of Nanjing Women and Children’s Healthcare Hospital (Women’s Hospital of Nanjing Medical University; approval no. 2022KY-021-02) and was conducted in accordance with the Declaration of Helsinki. Written informed consent was obtained from the legal guardians of all participating children before enrollment.
Experimental paradigm design
Based on prior pediatric and ASD fNIRS literature, video- and picture-viewing paradigms were selected because they are feasible for young children and have been used to examine social and perceptual processing11,12,17. To minimize head-movement artifacts during data acquisition, animated stimuli were incorporated into the experimental design. The emotional stimuli consisted of 30 validated facial-expression images (10 positive, 10 neutral, and 10 negative) selected from the Chinese Facial Affective Picture System (CFAPS). For social-interaction stimuli, video clips demonstrating three prototypical social games were recorded: (1) greeting exchange, (2) finger-play interaction (“Flying Bugs”), and (3) peek-a-boo. Non-social control stimuli included static images of houses and vehicles. All experimental paradigms were programmed using stimulus-presentation software (see the Table of Materials), with precise timing control and randomized stimulus presentation to ensure methodological rigor.
Participants
ASD group inclusion criteria were as follows: (1) fulfillment of the Diagnostic and Statistical Manual of Mental Disorders, Fifth Edition (DSM-5) diagnostic criteria for ASD18; (2) a positive Autism Diagnostic Observation Schedule (ADOS) assessment19; (3) a Childhood Autism Rating Scale (CARS) score ≥ 3020; (4) aged 2–6 years; (5) gestational age at birth > 37 weeks with birth weight > 2,500 g; and (6) written informed consent obtained from legal guardians. Exclusion criteria were as follows: (1) comorbid genetic or metabolic disorders (e.g., Rett syndrome, fragile X syndrome); (2) other neurodevelopmental disorders independent of ASD (e.g., isolated language delay or intellectual disability); (3) history of traumatic brain injury; and (4) neurological or severe systemic diseases.
The control group consisted of typically developing (TD) children recruited from routine health screenings at the Department of Child Health Care. Inclusion criteria were as follows: (1) age 2–6 years; (2) full-term birth (gestational age > 37 weeks) with normal birth weight (>2,500 g); and (3) written informed consent provided by legal guardians. Exclusion criteria were as follows: (1) diagnosed genetic or metabolic disorders, such as Rett syndrome or fragile X syndrome; (2) documented history of traumatic brain injury; and (3) neurological impairments or significant systemic illnesses. Individual matching by age or sex was not performed; instead, the potential confounding effects of age and sex were evaluated statistically in each paradigm-specific analytic sample. Participant inclusion was determined separately for each paradigm according to the availability of analyzable task-specific fNIRS data. Paradigm 1 included 60 participants (29 ASD and 31 TD), whereas Paradigm 2 included 58 participants (28 ASD and 30 TD). Fifty-three participants contributed analyzable data to both paradigms, seven contributed only to Paradigm 1, and five contributed only to Paradigm 2. Therefore, the two paradigm-specific sample sizes describe partially overlapping analytic datasets and should not be summed. The baseline characteristics of the two groups are summarized in Table 1.
| Characteristic | ASD | TD | p |
| Panel A. Paradigm 1 analytic sample (ASD, n = 29; TD, n = 31) | |||
| Age, years | 4.02 ± 1.14 | 3.67 ± 0.91 | 0.195 |
| Sex, male | 28 (96.6) | 20 (64.5) | 0.003 |
| ABC score | 57.24 ± 28.00 | 30.19 ± 8.96 | <0.001 |
| CARS score | 32.95 ± 2.52 | 19.68 ± 3.08 | <0.001 |
| Adaptive behavior | 67.79 ± 15.97 | 98.84 ± 11.66 | <0.001 |
| Gross motor | 77.48 ± 11.93 | 100.16 ± 11.03 | <0.001 |
| Fine motor | 69.34 ± 14.92 | 99.45 ± 11.56 | <0.001 |
| Language | 57.52 ± 20.53 | 105.13 ± 11.82 | <0.001 |
| Personal-social | 62.66 ± 12.77 | 107.87 ± 12.86 | <0.001 |
| Panel B. Paradigm 2 analytic sample (ASD, n = 28; TD, n = 30) | |||
| Age, years | 4.16 ± 1.12 | 3.58 ± 0.89 | 0.036 |
| Sex, male | 28 (100.0) | 20 (66.7) | <0.001 |
| ABC score | 58.39 ± 28.05 | 30.57 ± 9.33 | <0.001 |
| CARS score | 33.36 ± 2.68 | 19.73 ± 2.94 | <0.001 |
| Adaptive behavior | 66.54 ± 15.99 | 98.60 ± 11.89 | <0.001 |
| Gross motor | 78.50 ± 11.19 | 102.40 ± 12.20 | <0.001 |
| Fine motor | 68.61 ± 14.47 | 99.17 ± 12.30 | <0.001 |
| Language | 57.18 ± 19.63 | 105.53 ± 12.51 | <0.001 |
| Personal-social | 61.07 ± 12.56 | 107.13 ± 12.72 | <0.001 |
Table 1: Demographic and clinical characteristics of the paradigm-specific analytic samples. Values are presented as mean ± standard deviation or n (%). Continuous variables were compared using Welch’s t test, and sex distributions were compared using Fisher’s exact test. The two paradigm-specific analytic samples partially overlapped and should not be summed. Abbreviations: ABC = Autism Behavior Checklist; ASD = autism spectrum disorder; CARS = Childhood Autism Rating Scale; TD = typically developing.
fNIRS data acquisition
Cortical hemodynamic signals were acquired using a wearable, wireless, battery-powered, eight-channel continuous-wave fNIRS system. The system operated at wavelengths of 760 and 850 nm at a sampling rate of 10 Hz. The source–detector separation was set at 30 mm. Changes in HbO, HbR, and total hemoglobin (HbT) concentrations were calculated using the modified Beer–Lambert law.
The optode array comprised eight source–detector channels positioned bilaterally over the prefrontal cortex, with four channels covering each hemisphere. Channels 1–4 were formed by transmitters Tx1–Tx4 paired with detector Rx1 over the right prefrontal cortex, whereas Channels 5–8 were formed by transmitters Tx5–Tx8 paired with detector Rx2 over the left prefrontal cortex. The approximate anatomical locations, Brodmann areas, and Montreal Neurological Institute (MNI) coordinates of the channels are presented in Supplementary Table S1.
Experimental stimuli were presented using the referenced software (see the Table of Materials), which also generated event triggers to mark the onset and offset of each experimental condition. The fNIRS signals and event markers were transmitted to a computer and recorded.
Data description
β activation values from eight channels were used as classification features, with group labels used to distinguish samples. ASD was defined as the positive class and TD as the negative class. Paradigm 1 included three task-specific β-value sets and 24 features per participant (3 tasks × 8 channels); its analytic sample comprised 60 participants, including 29 children with ASD and 31 TD children. Paradigm 2 included two task-specific β-value sets and 16 features per participant (2 tasks × 8 channels); its analytic sample comprised 58 participants, including 28 children with ASD and 30 TD children.
Data preprocessing and feature extraction
fNIRS signal preprocessing and β-value estimation
The recorded optical signals were converted into concentration changes in oxygenated hemoglobin (HbO), deoxygenated hemoglobin (HbR), and total hemoglobin (HbT) using the modified Beer–Lambert law implemented in OxySoft. The HbO concentration time series were subsequently imported into NIRS-SPM version 4, implemented in MATLAB, for preprocessing and activation analysis21.
Wavelet minimum description length (wavelet-MDL) detrending was applied to remove slow baseline drift and global trends unrelated to task activation22. A hemodynamic response function (HRF)-based low-pass filter was then applied to attenuate high-frequency physiological noise21. No dedicated automated motion-artifact correction algorithm was applied during preprocessing. Recording completeness, rather than a quantitative channel-level signal-quality index, was used as the eligibility criterion. No prespecified channel-quality threshold was applied, and all eight channels were retained for β-value estimation. At the participant and paradigm levels, data were included only when the child completed the full experimental procedure and both the fNIRS recording and required clinical data were complete.
Participants with incomplete fNIRS signals were excluded from the corresponding paradigm analysis. Because the availability of complete task-specific data differed between paradigms, participant composition was determined separately for each paradigm-specific analytic dataset. For each participant and channel, a general linear model (GLM) was constructed using the HbO concentration time series as the dependent variable. The onset and duration of each task condition were convolved with the canonical HRF and its temporal and dispersion derivatives to generate the task regressors.
The regression coefficients (β values) corresponding to each task condition were extracted separately from each of the eight channels and used as task-evoked activation features. Paradigm 1 included three task conditions and therefore generated 24 features per participant (3 tasks × 8 channels), whereas Paradigm 2 included two task conditions and generated 16 features per participant (2 tasks × 8 channels).
Data partitioning, normalization, and principal component analysis
Leave-one-out cross-validation (LOOCV) was performed separately for each paradigm, and no fixed training/test split (e.g., 80%/20%) was used. In each LOOCV iteration, one participant was held out as the test sample, while all remaining participants constituted the training set. Thus, for Paradigm 1, each iteration included 59 of 60 participants from the training set (98.3%) and 1 participant from the test set (1.7%). For Paradigm 2, each iteration included 57 of 58 participants from the training set (98.3%) and 1 participant from the test set (1.7%). This procedure was repeated until every participant had served once as the held-out test sample, and the held-out predictions from all iterations were combined to evaluate classification performance.
Feature normalization was performed independently within each LOOCV iteration using z-score standardization. For each feature (j), the standardized value was calculated as:
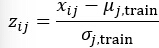
The held-out test sample was standardized using the mean and standard deviation derived from the training set. No information from the test sample was used to calculate the normalization parameters.
Z-score standardization was selected because the β-value features obtained from different task conditions and channels varied in magnitude. Standardizing each feature to a mean of zero and a standard deviation of one prevented features with larger numerical scales from disproportionately influencing scale-sensitive classifiers, such as K-nearest neighbors and support vector machines, as well as the subsequent principal component analysis.
Principal component analysis (PCA) was subsequently fitted using only the standardized training data within each LOOCV iteration. The minimum number of principal components explaining at least 80% of the cumulative variance in the training set was retained. The held-out test sample was projected onto the retained principal components using the PCA transformation parameters derived exclusively from the corresponding training set. This fold-specific procedure prevented information from the held-out test sample from influencing feature preprocessing or dimensionality reduction.
Classification model training and performance evaluation
Seven machine learning classifiers were evaluated to assess classification performance between the ASD and TD groups: K-nearest neighbors (KNN), logistic regression (LR), support vector machines (SVMs), decision trees (DTs), random forests (RFs), gradient-boosted decision trees (GBDTs), and XGBoost. All classification analyses were performed in Python 3.9. The seven classifiers were implemented using their default hyperparameter settings, and no data-driven hyperparameter search or optimization was performed. Statistical significance was assessed using 5,000 label permutations. For receiver operating characteristic (ROC) and area under the ROC curve (AUC) analyses, the prediction score for the ASD class was used. For classifiers that provide class probabilities, the probability for class 1 was extracted; for SVMs, the decision function score was oriented toward class 1. Within each LOOCV iteration, each classifier was trained on standardized, PCA-transformed training data and then applied to the held-out test sample.
The ASD group was defined as the positive class, and the typically developing (TD) group was defined as the negative class. Predictions obtained for the held-out samples across all LOOCV iterations were combined to calculate accuracy, sensitivity, specificity, ROC curves, and the AUC. Accuracy was calculated as:
Specificity was calculated as:


Sensitivity was calculated as:
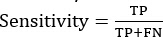
Where TP, TN, FP, and FN represent true positives, true negatives, false positives, and false negatives, respectively. The ROC curve depicts sensitivity against 1 − specificity across classification thresholds, and the AUC summarizes the overall discriminative performance of each classifier.
Permutation testing was used to assess whether the observed model performance was greater than expected by chance. For each classifier and paradigm, the group labels were randomly permuted 5,000 times. For every permutation, the complete modeling procedure, including fold-specific z-score standardization, PCA, model training, and held-out prediction, was repeated. The one-sided empirical permutation p value was calculated as:

Where Metricobserved represents the performance metric obtained using the original group labels, Metricperm represents the corresponding metric obtained after label permutation, and I denotes the indicator function. A permutation p value of less than 0.05 was considered evidence that the observed performance was greater than expected by chance.
Statistical analysis
Continuous data were summarized according to their distribution. Normally distributed variables are presented as the mean ± standard deviation (SD), whereas non-normally distributed variables are reported as the median and interquartile range (IQR). Categorical data are expressed as frequencies and percentages. Depending on the distribution of the continuous variables, between-group comparisons were performed using either the independent-samples t-test or the Mann–Whitney U test. Differences in categorical variables were assessed with the chi-square test or Fisher's exact test, as appropriate. Statistical significance was established at p < 0.05.
Potential confounding was evaluated separately for each paradigm-specific analytic sample. Age was calculated as the interval between the date of birth and the fNIRS assessment date divided by 365.2425. Baseline continuous characteristics were compared using Welch’s t test, and sex distributions were compared using Fisher’s exact test. For channel-level sensitivity analyses, β values were averaged across tasks within each channel, and ASD–TD group effects were estimated using ordinary least-squares regression with heteroscedasticity-consistent type 3 (HC3) robust standard errors, adjusted for age and sex. Benjamini–Hochberg false discovery rate (FDR) correction was applied across the eight channels within each paradigm. Because very few girls with ASD were included, a male-only sensitivity analysis adjusted for age was also performed.
Associations between the Autism Behavior Checklist (ABC), CARS, the five Gesell developmental-domain scores, and task-specific β features were assessed separately in the ASD and TD groups using Pearson correlation coefficients. FDR correction was applied separately within each paradigm, group, and participant characteristic across 24 β features in Paradigm 1 or 16 β features in Paradigm 2. ABC and CARS were not entered as covariates in the primary between-group models because they represent core diagnostic phenotype measures with limited overlap between the ASD and TD groups; their associations with fNIRS features were instead evaluated within groups.
As an additional classification sensitivity analysis, fixed L2-regularized logistic regression models using age and sex only, fNIRS β features only, or their combination were evaluated using fold-wise standardization and leave-one-out cross-validation. Incremental AUC was estimated relative to the age-and-sex model, with 95% confidence intervals obtained from 10,000 paired stratified bootstrap resamples.
Results
Potential confounding analyses
In the Paradigm 1 analytic sample, age did not differ significantly between the ASD and TD groups (4.02 ± 1.14 vs. 3.67 ± 0.91 years, p = 0.195), whereas the proportion of boys was higher in the ASD group (96.6% vs. 64.5%, p = 0.003). In Paradigm 2, the ASD group was older than the TD group (4.16 ± 1.12 vs. 3.58 ± 0.89 years, p = 0.036) and had a higher proportion of boys (100.0% vs. 66.7%, p < 0.001).
After adjustment for age and sex and FDR correction, the Paradigm 1 group effect at channel 3 remained significant (ASD minus TD coefficient = −0.755, p = 0.004, q = 0.036). The corresponding male-only sensitivity analysis also remained significant (q = 0.014). In Paradigm 2, channel 5 and channel 6 showed nominally significant adjusted group effects (p = 0.026 and p = 0.008, respectively), but neither survived FDR correction (q = 0.102 and q = 0.064, respectively). Neither channel survived FDR correction in the male-only analysis (q = 0.130 and q = 0.070, respectively).
Within the ASD groups, none of the task-specific β-feature correlations with ABC, CARS, or the five Gesell developmental domains survived FDR correction in either paradigm. One exploratory association survived FDR correction in the Paradigm 2 TD group: Gesell fine motor score was positively correlated with beta2-ch06 (r = 0.5273, p = 0.0028, q = 0.0440). No other participant-characteristic association survived FDR correction.
In the classification sensitivity analyses, the age-and-sex model yielded AUCs of 0.653 for Paradigm 1 and 0.713 for Paradigm 2. The combined fNIRS-plus-demographic model yielded AUCs of 0.774 and 0.770, respectively. Relative to age and sex alone, the incremental AUC was 0.121 (95% CI, −0.046 to 0.293) for Paradigm 1 and 0.057 (95% CI, −0.091 to 0.201) for Paradigm 2; both confidence intervals included zero. Detailed results are provided in Supplementary Table S2, Supplementary Table S3, Supplementary Table S4, Supplementary Table S5, and Supplementary Table S6.
Machine learning classification performance
In Paradigm 1, classification performance was generally limited. KNN yielded the highest observed accuracy of 0.567, with a sensitivity of 0.516, specificity of 0.621, and AUC of 0.551 (95% CI, 0.405–0.698). The decision tree classifier yielded the highest observed AUC of 0.582, with an accuracy of 0.550. Logistic regression showed an accuracy of 0.400 and an AUC of 0.277 (95% CI, 0.147–0.407). Although SVM achieved a high sensitivity of 0.968, its specificity was only 0.035, resulting in an AUC of 0.343 (95% CI, 0.191–0.465). Random forest, GBDT, and XGBoost yielded AUC values ranging from 0.492 to 0.538. None of the evaluated classifiers demonstrated statistically significant above-chance performance in the permutation tests (all permutation p values > 0.05). Therefore, no classifier showed reliable discriminatory performance for Paradigm 1 (Table 2 and Figure 1).
| Classifier | Accuracy | Sensitivity | Specificity | AUC (95% CI) |
| KNN | 0.5667 | 0.5161 | 0.6207 | 0.5512 (0.4049–0.6975) |
| p | 0.844 | 0.843 | 0.5492 | 0.8552 |
| LR | 0.4 | 0.6452 | 0.1379 | 0.2770 (0.1473–0.4067) |
| p | 0.4818 | 0.1232 | 0.762 | 0.825 |
| SVM | 0.5167 | 0.9677 | 0.0345 | 0.3432 (0.1910–0.4653) |
| p | 0.6006 | 0.2632 | 0.824 | 0.3436 |
| Decision Tree | 0.55 | 0.5806 | 0.5172 | 0.5823 (0.4026–0.6953) |
| p | 0.4088 | 0.2692 | 0.5364 | 0.4622 |
| Random Forest | 0.5167 | 0.5161 | 0.5172 | 0.4924 (0.3125–0.6063) |
| p | 0.375 | 0.088 | 0.772 | 0.716 |
| GBDT | 0.5 | 0.5806 | 0.4138 | 0.4939 (0.3365–0.6312) |
| p | 0.5616 | 0.2944 | 0.7424 | 0.397 |
| XGBoost | 0.5167 | 0.5161 | 0.5172 | 0.5384 (0.3916–0.6851) |
| p | 0.263 | 0.1828 | 0.3684 | 0.3066 |
Table 2: Machine-learning classification performance for Paradigm 1. Classification performance was evaluated using data from 60 participants. For each classifier, the first row presents the observed accuracy, sensitivity, specificity, and area under the receiver operating characteristic curve, and the second row presents the corresponding one-sided empirical p values derived from 5,000 label permutations. AUC values are reported with 95% confidence interval (CI). Abbreviations: KNN = K-nearest neighbors; LR = logistic regression; SVM = support vector machine; DT = decision tree; RF = random forest; GBDT = gradient boosting decision trees; XGBoost = extreme gradient boosting; AUC = area under the receiver operating characteristic curve; CI = confidence interval; p = probability value.
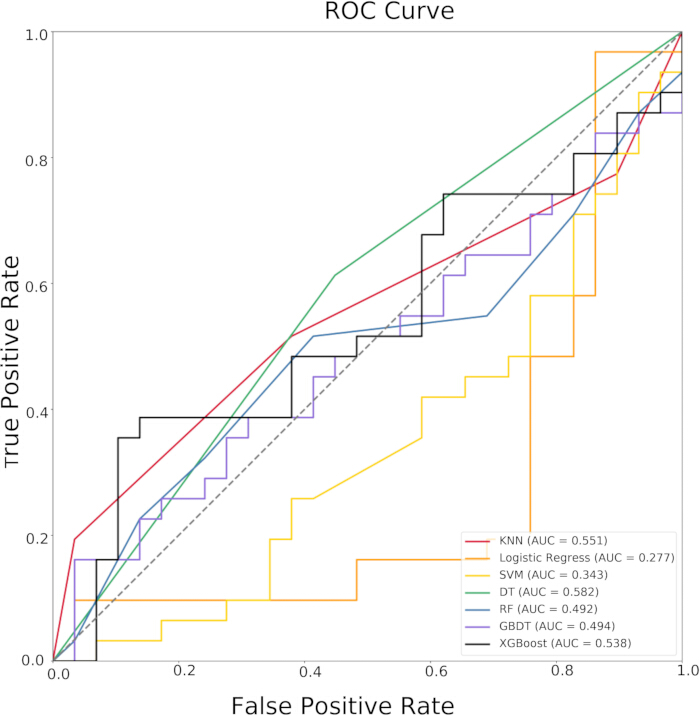
Figure 1: Receiver operating characteristic curves for the seven machine-learning classifiers in Paradigm 1. The curves were generated from the out-of-fold prediction scores obtained for 60 participants using leave-one-out cross-validation. The dashed diagonal line represents chance-level discrimination (AUC = 0.500). Statistical significance was evaluated using one-sided empirical permutation tests based on 5,000 label permutations. Abbreviations: KNN = K-nearest neighbors; LR = logistic regression; SVM = support vector machine; DT = decision tree; RF = random forest; GBDT = gradient boosting decision trees; XGBoost = extreme gradient boosting; ROC = receiver operating characteristic; AUC = area under the ROC curve. Please click here to view a larger version of this figure.
For Paradigm 2, several classifiers showed numerically higher observed performance metrics. KNN achieved an accuracy of 0.672, sensitivity of 0.767, specificity of 0.571, and an AUC of 0.664 (95% CI, 0.525–0.804). Logistic regression yielded an accuracy of 0.586, sensitivity of 0.600, specificity of 0.571, and an AUC of 0.648 (95% CI, 0.506–0.789). SVM showed lower specificity and an AUC of 0.540 (95% CI, 0.368–0.667), whereas random forest achieved an accuracy of 0.638, specificity of 0.679, and an AUC of 0.675 (95% CI, 0.501–0.785). GBDT and XGBoost had AUCs of 0.628 and 0.628, respectively (Table 3 and Figure 2). None of the seven classifiers demonstrated statistically significant above-chance performance in the permutation tests for Paradigm 2 (all permutation p values > 0.05).
| Classifier | Accuracy | Sensitivity | Specificity | AUC (95% CI) |
| KNN | 0.6724 | 0.7667 | 0.5714 | 0.6643 (0.5248–0.8037) |
| p | 0.5614 | 0.5018 | 0.5014 | 0.6274 |
| LR | 0.5862 | 0.6 | 0.5714 | 0.6476 (0.5062–0.7891) |
| p | 0.9532 | 0.8086 | 0.9484 | 0.9468 |
| SVM | 0.5862 | 0.7 | 0.4643 | 0.5403 (0.3675–0.6670) |
| p | 0.6214 | 0.055 | 0.9004 | 0.259 |
| Decision Tree | 0.5517 | 0.5667 | 0.5357 | 0.5845 (0.4024–0.7000) |
| p | 0.6688 | 0.4562 | 0.7418 | 0.7206 |
| Random Forest | 0.6379 | 0.6 | 0.6786 | 0.6750 (0.5009–0.7848) |
| p | 0.8976 | 0.955 | 0.563 | 0.873 |
| GBDT | 0.6034 | 0.6333 | 0.5714 | 0.6285 (0.4799–0.7677) |
| p | 0.4818 | 0.227 | 0.6904 | 0.5534 |
| XGBoost | 0.5517 | 0.6 | 0.5 | 0.6286 (0.4851–0.7720) |
| p | 0.65 | 0.4818 | 0.713 | 0.7392 |
Table 3: Machine-learning classification performance for Paradigm 2. Classification performance was evaluated in the Paradigm 2 analytic sample of 58 participants. For each classifier, the first row presents the observed accuracy, sensitivity, specificity, and area under the receiver operating characteristic curve, and the second row presents the corresponding one-sided empirical p values derived from 5,000 label permutations. AUC values are reported with 95% CI. Abbreviations: KNN = K-nearest neighbors; LR = logistic regression; SVM = support vector machine; DT = decision tree; RF = random forest; GBDT = gradient boosting decision trees; XGBoost = extreme gradient boosting; AUC = area under the receiver operating characteristic curve; CI = confidence interval; p = probability value.
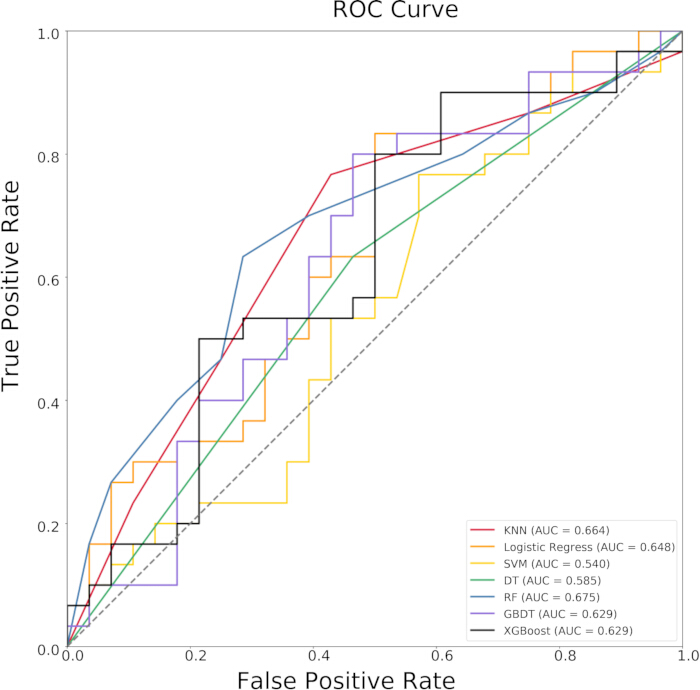
Figure 2: Receiver operating characteristic curves for the seven machine-learning classifiers in Paradigm 2. The curves were generated from the out-of-fold prediction scores obtained for the Paradigm 2 analytic sample of 58 participants using leave-one-out cross-validation. The dashed diagonal line represents chance-level discrimination (AUC = 0.500). Statistical significance was evaluated using one-sided empirical permutation tests based on 5,000 label permutations. Abbreviations: KNN = K-nearest neighbors; LR = logistic regression; SVM = support vector machine; DT = decision tree; RF = random forest; GBDT = gradient boosting decision trees; XGBoost = extreme gradient boosting; ROC = receiver operating characteristic; AUC = area under the ROC curve. Please click here to view a larger version of this figure.
Overall, classification performance was modest. Paradigm 2 generally yielded better observed classification performance than Paradigm 1; however, age and sex alone also provided appreciable discriminatory information. Because the confidence intervals for the incremental AUC obtained by adding fNIRS features included zero in both paradigms, the present results do not establish that fNIRS provides independent classification value beyond demographic characteristics.
Data availability
The de-identified participant-level characteristics and processed fNIRS GLM beta-value matrices underlying the reported analyses are provided in Supplementary Table S5. Complete task-specific correlation results are provided in Supplementary Table S6.
Supplementary Table S1: Channel configuration, anatomical locations, Brodmann areas, and Montreal Neurological Institute coordinates of the eight functional near-infrared spectroscopy channels. MNI coordinates are presented in the standard MNI space as x, y, and z coordinates in millimeters. Primary and additional BAs indicate the principal and adjacent cortical areas associated with the estimated position of each channel. Abbreviations: BA = Brodmann area; MNI = Montreal Neurological Institute; Tx = transmitter (light source); Rx = receiver (detector); fNIRS = functional near-infrared spectroscopy. Please click here to download this file.
Supplementary Table S2: Channel-level group effects before and after adjustment for age and sex. Coefficients represent ASD minus TD differences in condition-averaged beta values. Adjusted models included diagnostic group, age, and sex and used HC3 robust standard errors. Male-only analyses included group and age. False discovery rate correction was applied across the eight channels within each model and paradigm. Abbreviations: ASD = autism spectrum disorder; FDR = false discovery rate; TD = typically developing. Please click here to download this file.
Supplementary Table S3: Summary of task-specific correlations between participant characteristics and fNIRS beta features. Pearson correlations were calculated separately within ASD and TD groups for each task-specific beta feature. Benjamini-Hochberg FDR correction was applied separately within each paradigm, group, and participant characteristic across 24 features for Paradigm 1 (3 tasks × 8 channels) or 16 features for Paradigm 2 (2 tasks × 8 channels). No association in either ASD group survived FDR correction. The sole FDR-significant result was observed in the Paradigm 2 TD group for Gesell fine motor score and beta2-ch06 (r = 0.5273, P = 0.0028, q = 0.0440); this isolated exploratory finding requires replication. Complete results for all 560 correlations are provided in Supplementary Data File 2. Abbreviations: ABC = Autism Behavior Checklist; ASD = autism spectrum disorder; CARS = Childhood Autism Rating Scale; FDR = false discovery rate; TD = typically developing. Please click here to download this file.
Supplementary Table S4: Machine-learning sensitivity analysis for demographic confounding. Models used fixed L2-regularized logistic regression with fold-wise standardization and leave-one-out cross-validation. The incremental AUC of the combined model relative to the age-and-sex model was 0.121 (95% CI, -0.046 to 0.293) for Paradigm 1 and 0.057 (95% CI, -0.091 to 0.201) for Paradigm 2. Both confidence intervals included zero. ASD was treated as the positive class. Abbreviation: AUC = area under the receiver operating characteristic curve. Please click here to download this file.
Supplementary Table S5: Deidentified participant characteristics and fNIRS GLM beta-value features. Please click here to download this file.
Supplementary Table S6: Participant-characteristic correlation results. Please click here to download this file.
Discussion
ASD poses significant challenges to young children’s physical, cognitive, and socio-emotional development, with profound impacts on their long-term mental health and quality of life. Given the neurodevelopmental nature of ASD and its lifelong consequences, early recognition is critical. Current evidence strongly suggests that early diagnosis and subsequent behavioral interventions during the critical neuroplasticity window can substantially improve developmental trajectories and functional outcomes. It is therefore important to identify ASD early and to screen high-risk groups in order to improve patient prognosis.
As a non-invasive optical neuroimaging technique, fNIRS estimates cortical activity from changes in HbO and HbR. It is relatively tolerant of moderate movement and can be used in naturalistic settings, although motion artifacts remain an important source of measurement error. These properties have supported its use in pediatric and neurodevelopmental research17,23,24. Children with ASD show, on average, poorer facial-emotion recognition than neurotypical individuals, although the magnitude of impairment varies by emotion and task characteristics25,26,27,28. Accordingly, emotional-face and social-play paradigms were selected to probe task-evoked cortical responses related to emotion recognition and social interaction.
Unlike the subjective data used for the assessment of clinical symptoms and scale, the objective data collected by fNIRS in this study allowed comparison of the performance of different machine learning algorithms across the two paradigms. In Paradigm 1, KNN yielded the highest observed accuracy, whereas DT yielded the highest observed AUC; in Paradigm 2, KNN yielded the highest observed accuracy, and RF yielded the highest observed AUC. KNN may be relatively sensitive to local similarities among participants in the standardized PCA feature space, whereas a linear model such as LR may be less able to represent complex or heterogeneous relationships between task-evoked activation and diagnostic group. Conversely, decision-tree and ensemble models may exhibit considerable variance when trained on a small sample. However, because none of the permutation tests were statistically significant, these explanations remain tentative, and the observed model rankings should not be interpreted as evidence that any classifier or paradigm is superior.
Machine-learning approaches applied to ASD classification across neuroimaging and neurophysiological modalities include SVMs, tree-based methods, and deep-learning models29,30. Many studies have applied fNIRS data to ASD classification in children. On the basis that participants with attention-deficit/hyperactivity disorder and patients with ASD exhibit different hemodynamic responses to visual stimuli, Ichikawa et al. identified an optimal subset of hemodynamic data that could be classified by SVM with 84% accuracy 14. Another study used an SVM model incorporating bilateral resting-state functional connectivity and HbO fluctuation power to differentiate ASD from TD, achieving high-precision classification with a sensitivity of 81.6% and a specificity of 94.6%, and suggested that multiparametric imaging might distinguish ASD from TD more accurately15. Using fNIRS, Cheng et al. identified a new frequency-domain feature: the power spectra of low-frequency cerebral hemodynamic oscillations showed a distinctive pattern in ASD, allowing fairly accurate SVM classification between ASD and TD, with a sensitivity of 90.2%, specificity of 95.1%, and accuracy of 92.7%16. In the present study, SVM was not the best performer among all algorithms, which may be related to the sample size on the one hand and to the variability of paradigm application on the other.
In brain-imaging research on autism, Chen et al. selected 100 salient resting-state functional connectivity features and achieved an RF classification accuracy of 90.8%, with a sensitivity of 89% and a specificity of 93%31. However, because magnetic resonance imaging (MRI) requires participants to remain relatively still, implementation in young awake children can be challenging, particularly during prolonged acquisitions32. fNIRS was selected for the present study because it permits relatively naturalistic and typically nonsedated acquisition in young children17,23.
The contribution of the present study should be interpreted in the context of the existing fNIRS-based ASD-classification literature. Previous studies have reported ASD-related fNIRS features based on resting-state functional connectivity, frequency-domain measures, and entropy-based signal characteristics, with some of these features subsequently evaluated for classification13,14,15,16. However, comparisons across those studies are complicated by differences in participant age, acquisition protocols, brain regions, feature definitions, and validation procedures. The present study did not seek to introduce a new machine-learning algorithm. Its methodological contribution was the parallel evaluation of two developmentally appropriate task paradigms using the same feature definition, preprocessing strategy, classifier set, and cross-validation framework.
Paradigm 2 showed numerically higher observed performance on several metrics, although overall performance remained modest and none of the classifiers significantly exceeded chance. Because the two paradigm-specific participant sets were not identical, the observed performance difference cannot be attributed solely to paradigm design. A sensitivity analysis restricted to participants with complete data for both paradigms, followed by validation in a larger independent cohort, would provide a more rigorous assessment of the effect of paradigm selection.
The relatively modest classification performance may partly reflect the limitations of the feature-reduction strategy used in this study. PCA is an unsupervised dimensionality-reduction method that identifies components explaining the greatest overall variance without explicitly considering group labels. Consequently, components with high variance may not necessarily provide the greatest discrimination between the ASD and TD groups, whereas potentially informative features with relatively low variance may be underrepresented. Supervised feature-selection approaches, such as analysis-of-variance-based feature ranking, mutual-information-based selection, least absolute shrinkage and selection operator regularization, recursive feature elimination, and model-based feature importance, may improve feature relevance and reduce redundancy. These approaches should be evaluated within a nested cross-validation framework to ensure that feature selection is performed exclusively using the training data and does not introduce information leakage.
This study evaluated the feasibility of task-based fNIRS models for distinguishing young children with ASD from TD children. Several limitations should be considered. First, the modest sample size may have constrained the stability and generalizability of the classification models. Second, the paradigm-specific samples were imbalanced by sex, and age also differed between the ASD and TD groups in Paradigm 2. Although age- and sex-adjusted analyses supported a group effect at channel 3 in Paradigm 1, the nominal findings in Paradigm 2 did not survive FDR correction. Moreover, age and sex alone showed appreciable discriminatory performance, and adding fNIRS features did not yield a statistically significant incremental AUC. Third, no association between task-specific fNIRS β features and ASD symptom severity or developmental level survived FDR correction within the ASD groups. Fourth, PCA may not capture the features most relevant to class discrimination. In addition, the absence of dedicated automated motion-artifact correction and quantitative channel-quality thresholds, the use of default classifier hyperparameters without nested optimization, and the lack of model explainability analyses may have limited model robustness and interpretability. Residual confounding from unmeasured factors also cannot be excluded. Therefore, the present findings support procedural feasibility but do not establish fNIRS as an independent diagnostic tool. Larger, prospectively recruited, sex-balanced, and externally validated cohorts are required.
In conclusion, this exploratory study compared two task-based fNIRS paradigms and seven machine-learning classifiers for distinguishing young children with ASD from TD children. Paradigm 2 showed numerically higher observed performance on several metrics, although overall performance remained modest and did not significantly exceed chance. Age and sex alone showed appreciable discriminative performance, and the incremental AUC from adding fNIRS features was not statistically significant in either paradigm. Therefore, these findings do not establish a clinically applicable or demographically independent diagnostic model, but they support further investigation into task-paradigm selection and fNIRS feature development. Larger independent cohorts, supervised feature selection, interpretable modeling, and external validation are required before the clinical utility of this approach can be determined.
Disclosures
The authors have no conflicts of interest to declare.
Acknowledgements
This work was supported by the Nanjing Health Science and Technology Development Project (grant numbers ZKX23043 and YKK20146).
Materials
| Name | Company | Catalog Number | Comments |
|---|---|---|---|
| Chinese Facial Affective Picture System (CFAPS) | National Key Laboratory of Cognitive Neuroscience and Learning, Beijing Normal University | — | Validated facial-expression image set used as emotional stimuli |
| E-Prime | Psychology Software Tools | Version 3.0 | Stimulus presentation, timing control, and randomization |
| Machine learning environment | Python | Classifier training and evaluation | |
| MATLAB | The MathWorks, Inc. | — | Platform used to run NIRS-SPM for preprocessing and activation analysis |
| NIRS-SPM | — | Version 4 | fNIRS preprocessing and statistical parametric mapping |
| OctaMon+ functional near-infrared spectroscopy system | Artinis Medical Systems B.V. | — | Wearable, wireless, battery-powered eight-channel continuous-wave fNIRS system for acquisition of cortical hemodynamic (HbO2/HbR) signals |
| OxySoft | Artinis Medical Systems B.V. | Version 3.3.33 x64 | fNIRS signal acquisition and conversion of optical signals to HbO, HbR, and HbT concentration changes |
| R | R Foundation for Statistical Computing | Version 4.3.1 | Statistical analysis |
| SPSS Statistics | IBM | Version 28.0 | Statistical analysis |
References
- Lord C, Elsabbagh M, Baird G, Veenstra-Vanderweele J. Autism spectrum disorder. Lancet. 2018;392(10146):508-20.
- Alrehaili RA, ElKady RM, Alrehaili JA, Alreefi RM. Exploring early childhood autism spectrum disorders: a comprehensive review of diagnostic approaches in young children. Cureus. 2023;15(12):e50111.
- Maenner MJ, et al. Prevalence and characteristics of autism spectrum disorder among children aged 8 years—Autism and Developmental Disabilities Monitoring Network, 11 sites, United States, 2020. MMWR Surveill Summ. 2023;72(2):1-14.
- Jiang X, et al. Prevalence of autism spectrum disorder in mainland China over the past 6 years: a systematic review and meta-analysis. BMC Psychiatry. 2024;24(1):404.
- Johnson CP, Myers SM; American Academy of Pediatrics Council on Children With Disabilities. Identification and evaluation of children with autism spectrum disorders. Pediatrics. 2007;120(5):1183-215.
- de Lima TA, Zuanetti PA, Nunes MEN, Hamad APA. Differential diagnosis between autism spectrum disorder and other developmental disorders with emphasis on the preschool period. World J Pediatr. 2023;19(8):715-26.
- Mo K, et al. Sex/gender differences in the human autistic brains: a systematic review of 20 years of neuroimaging research. Neuroimage Clin. 2021;32:102811.
- Peck FC, et al. Prediction of autism spectrum disorder diagnosis using nonlinear measures of language-related EEG at 6 and 12 months. J Neurodev Disord. 2021;13(1):57.
- Sato W, Uono S. The atypical social brain network in autism: advances in structural and functional MRI studies. Curr Opin Neurol. 2019;32(4):617-21.
- Ferrari M, Quaresima V. A brief review on the history of human functional near-infrared spectroscopy development and fields of application. Neuroimage. 2012;63(2):921-35.
- Lloyd-Fox S, Blasi A, Elwell CE. Illuminating the developing brain: the past, present and future of functional near infrared spectroscopy. Neurosci Biobehav Rev. 2010;34(3):269-84.
- Gervain J, et al. Near-infrared spectroscopy: a report from the McDonnell infant methodology consortium. Dev Cogn Neurosci. 2011;1(1):22-46.
- Zhang T, et al. Altered complexity in resting-state fNIRS signal in autism: a multiscale entropy approach. Physiol Meas. 2021;42(8):085004.
- Ichikawa H, et al. Novel method to classify hemodynamic response obtained using multi-channel fNIRS measurements into two groups: exploring the combinations of channels. Front Hum Neurosci. 2014;8:480.
- Li J, et al. Characterization of autism spectrum disorder with spontaneous hemodynamic activity. Biomed Opt Express. 2016;7(10):3871-81.
- Cheng H, Yu J, Xu L, Li J. Power spectrum of spontaneous cerebral homodynamic oscillation shows a distinct pattern in autism spectrum disorder. Biomed Opt Express. 2019;10(3):1383-92.
- Liu T, et al. Assessing autism at its social and developmental roots: a review of autism spectrum disorder studies using functional near-infrared spectroscopy. Neuroimage. 2019;185:955-67.
- American Psychiatric Association. Diagnostic and statistical manual of mental disorders. 5th ed. Arlington (VA): American Psychiatric Association; 2013.
- Lord C, et al. The Autism Diagnostic Observation Schedule-Generic: a standard measure of social and communication deficits associated with the spectrum of autism. J Autism Dev Disord. 2000;30(3):205-23.
- Schopler E, Reichler RJ, DeVellis RF, Daly K. Toward objective classification of childhood autism: Childhood Autism Rating Scale. J Autism Dev Disord. 1980;10(1):91-103.
- Ye JC, et al. NIRS-SPM: statistical parametric mapping for near-infrared spectroscopy. Neuroimage. 2009;44(2):428-47.
- Jang KE, et al. Wavelet minimum description length detrending for near-infrared spectroscopy. J Biomed Opt. 2009;14(3):034004.
- Scholkmann F, et al. A review on continuous wave functional near-infrared spectroscopy and imaging instrumentation and methodology. Neuroimage. 2014;85(Pt 1):6-27.
- Eken A, Nassehi F, Eroğul O. Diagnostic machine learning applications on clinical populations using functional near infrared spectroscopy: a review. Rev Neurosci. 2024;35(4):421-49.
- Black MH, et al. Mechanisms of facial emotion recognition in autism spectrum disorders: insights from eye tracking and electroencephalography. Neurosci Biobehav Rev. 2017;80:488-515.
- Loth E, et al. Facial expression recognition as a candidate marker for autism spectrum disorder: how frequent and severe are deficits deficits? Mol Autism. 2018;9:7.
- Harms MB, Martin A, Wallace GL. Facial emotion recognition in autism spectrum disorders: a review of behavioral and neuroimaging studies. Neuropsychol Rev. 2010;20(3):290-322.
- Yeung MK. A systematic review and meta-analysis of facial emotion recognition in autism spectrum disorder: the specificity of deficits and the role of task characteristics. Neurosci Biobehav Rev. 2022;133:104518.
- Xu M, Calhoun V, Jiang R, Yan W, Sui J. Brain imaging-based machine learning in autism spectrum disorder: methods and applications. J Neurosci Methods. 2021;361:109271.
- Das S, et al. Machine learning approaches for electroencephalography and magnetoencephalography analyses in autism spectrum disorder: a systematic review. Prog Neuropsychopharmacol Biol Psychiatry. 2023;123:110705.
- Chen CP, et al. Diagnostic classification of intrinsic functional connectivity highlights somatosensory, default mode, and visual regions in autism. Neuroimage Clin. 2015;8:238-45.
- Copeland A, et al. Infant and child MRI: a review of scanning procedures. Front Neurosci. 2021;15:666020.