This protocol describes an anonymous, cross-sectional questionnaire procedure for assessing university teachers’ professional development motivation, teaching self-efficacy, engagement, and reflective practice.
Method Article
A Self-Determination Theory Survey Protocol for University Teachers’ Professional Development Motivation, Teaching Self-Efficacy, and Engagement
In This Article
Summary
Abstract
University teachers participate in professional development under different institutional, disciplinary, and motivational conditions. Participation records alone cannot explain whether professional development translates into meaningful professional learning. This article presents a reproducible, anonymous, cross-sectional survey protocol for assessing psychological need satisfaction, autonomous and controlled motivation, teaching self-efficacy, professional development engagement, and reflective practice from a self-determination theory perspective. The protocol specifies eligibility screening, stratified convenience sampling, questionnaire construction, expert review, pilot testing, online administration, anonymization, response-quality screening, scale scoring, reliability estimation, correlation analysis, hierarchical regression, and sensitivity analyses. It also clarifies scale adaptation, permission verification, construct scoring, and the interpretation of highly reliable scales as potential indicators of item redundancy. Representative results were obtained from one completed implementation of the protocol, in which 326 submitted records were exported and 313 valid responses were retained after prespecified screening. The results showed that autonomy, competence, and relatedness need satisfaction were positively associated with autonomous motivation, and that autonomous motivation and teaching self-efficacy were associated with professional development engagement. The protocol is suitable for standardized, multi-institutional, survey-based studies of the motivational and professional belief correlates of professional development engagement. It is less suitable for causal inference, longitudinal change estimation, direct behavioral outcomes, or institution-level program evaluation unless repeated measurements, observation, qualitative inquiry, or administrative data are added.
Introduction
Teacher professional development is widely used to support teaching quality, instructional improvement, and professional learning, but its effects are difficult to interpret when evaluation is limited to attendance, exposure, or the number of completed training hours1,2. Professional development research requires a clear conceptualization of the mechanisms linking learning activities with teacher change because participation does not necessarily indicate engagement, perceived usefulness, or subsequent reflection1. In university settings, teachers work across different disciplines, appointment types, workload conditions, and institutional expectations. A survey protocol that measures psychological and professional belief conditions can therefore complement activity-based monitoring by examining how teachers experience and carry forward professional development. Alternative approaches serve different evaluation purposes. Attendance-based evaluation is efficient for documenting reach, compliance, and program uptake, but it provides limited information about motivation, perceived capability, or engagement quality. Qualitative interviews, focus groups, and reflective narratives provide richer accounts of professional learning experiences, but they are less suitable for standardized measurement across several institutions or larger samples. Longitudinal designs are preferable for estimating change over time, temporal ordering, or delayed teaching outcomes. Institution-level evaluation frameworks are useful for monitoring program delivery, resource allocation, and organizational accountability. The present protocol is most appropriate when the aim is to conduct an anonymous, cross-sectional, multi-institutional survey using reproducible scoring, cleaning, and analysis procedures.
The protocol treats professional development as a professional learning process rather than as a single institutional event. Opfer and Pedder conceptualized teacher professional learning as a complex process shaped by interactions among individual, workplace, and learning-activity systems3. This perspective is relevant to university teachers because the same activity may be experienced differently depending on perceived choice, instructional confidence, collegial support, workload pressure, and disciplinary relevance. The protocol therefore assesses psychological need satisfaction, professional development motivation, teaching self-efficacy, professional development engagement, and reflective practice, in addition to participation background. Self-determination theory provides the motivational basis for the protocol. The theory distinguishes autonomous motivation, in which behavior is experienced as personally endorsed or meaningful, from controlled motivation, in which behavior is driven mainly by pressure, obligation, or external demand4. It also identifies autonomy, competence, and relatedness as basic psychological needs that support self-endorsed action and sustained engagement5. In university teachers’ professional development, autonomy refers to perceived choice and professional discretion in selecting or using development activities; competence refers to perceived growth in teaching capability; and relatedness refers to collegial connection, professional belonging, and constructive exchange. These constructs allow the protocol to examine why teachers participate and how the professional development environment is experienced.
Teaching self-efficacy is included because motivation alone does not determine whether teachers feel able to apply professional development content in teaching practice. Teacher self-efficacy refers to teachers’ beliefs about their capability to organize and perform teaching-related actions, and it has been linked to instructional behavior, persistence, enthusiasm, and student-related outcomes6. Guskey’s model of teacher change further suggests that professional development becomes meaningful when teachers can connect new practices with evidence of improvement7. In this protocol, teaching self-efficacy is treated as a professional belief variable that may help explain whether professional development is carried into classroom, online, laboratory, studio, clinical, or supervisory teaching contexts. Professional development engagement is defined as active involvement in professional development activities, attention to the learning process, effort to connect professional development content with teaching, continued learning after the activity, and willingness to participate in future professional learning. This construct is related to the broader engagement literature, where vigor, dedication, and absorption describe sustained involvement in work-related activities8. However, professional development engagement is not treated as identical to general work engagement or as a count of professional development participation. It is measured as a narrower professional-learning response that captures how teachers participate in, process, and continue to use professional development experiences. Reflective practice is included as a brief indicator of post-activity review, evaluation of teaching usefulness, revision of teaching strategies, and documentation or discussion of learning outcomes9.
A survey protocol also requires prespecified response-quality and measurement procedures. Anonymous online questionnaires can produce short-duration responses, missed items, attention-check failures, and invariant response patterns. Careless-response screening is more defensible when multiple indicators are combined rather than when a single exclusion rule is used10. The protocol therefore specifies completion-time thresholds, instructed-response attention checks, missingness rules, invariant-response screening, and traceable exclusion coding before scale scoring. Internal consistency is estimated using Cronbach’s alpha and McDonald’s omega because alpha alone can be misleading under some measurement conditions11. Very high reliability values are interpreted cautiously because they may indicate item redundancy rather than stronger measurement. The primary analysis treats each construct as an observed scale score for descriptive statistics, reliability estimation, correlation analysis, hierarchical regression, and sensitivity analyses. Studies using this protocol for scale development, cross-cultural comparison, or high-stakes measurement should add exploratory or confirmatory factor analysis before interpreting structural associations, especially when construct correlations are high or translated items are used. The cross-sectional design can estimate associations among psychological need satisfaction, motivation, teaching self-efficacy, professional development engagement, and reflective practice, but it cannot establish temporal order, causal effects, or behavioral change. Because all main variables are self-reported by the same respondents, social desirability and common-method bias remain possible despite anonymity, neutral wording, response-quality screening, and sensitivity analyses12. The protocol is therefore less suitable for causal inference, longitudinal change estimation, direct assessment of teaching behavior, or institution-level program evaluation unless repeated measurements, qualitative inquiry, classroom observation, teaching artifacts, or administrative program data are added. Within its intended scope, the protocol provides a standardized method for examining the motivational and professional belief constructs associated with university teachers’ professional development engagement and reflective professional learning13.
Protocol
The study protocol was reviewed and approved by the Universiti Malaya Research Ethics Committee (Non-Medical) on 7 August 2025 (Reference No. UM.TNC(P&I)/UMREC_4864). Local administrative permission was obtained from each participating university before recruitment when required. Electronic informed consent was collected before eligibility screening and questionnaire administration. No names, staff identification numbers, telephone numbers, institutional email addresses, Internet Protocol addresses, geolocation data, device identifiers, exact department names, or open-text identifiers were collected. Submitted responses were assigned anonymous respondent codes and stored in encrypted institutional storage according to the approved data-retention procedure.
This protocol standardizes an anonymous, cross-sectional questionnaire procedure for assessing university teachers’ professional development motivation, basic psychological need satisfaction, teaching self-efficacy, professional development engagement, and reflective practice. The protocol uses self-determination theory to distinguish autonomous motivation from controlled motivation in professional development participation14.
1. Study design and workflow
- Define the study as an anonymous, cross-sectional questionnaire study of university teachers and follow the workflow shown in Figure 1 from ethics approval to reproducibility checking.
- Measure basic psychological need satisfaction, professional development motivation, teaching self-efficacy, professional development engagement, and reflective practice.
- Treat autonomy, competence, and relatedness need satisfaction as motivational antecedents; autonomous and controlled motivation as motivational-regulation variables; teaching self-efficacy as a professional belief variable; and professional development engagement and reflective practice as professional-learning response variables15.
- Analyze constructs as observed scale scores for descriptive statistics, reliability estimation, correlation analysis, hierarchical regression, and sensitivity analyses.
NOTE: Add exploratory or confirmatory factor analysis before interpreting latent structure, cross-cultural measurement equivalence, or discriminant validity in studies using translated items, newly adapted items, or highly correlated constructs.
2. Participant eligibility and sampling plan
- Recruit university teachers from at least four universities with varied institutional profiles.
- Include participants aged 21 years or older who are employed by a higher-education institution, involved in teaching or supervision, able to complete the questionnaire in the study language, and willing to provide electronic informed consent.
- Include undergraduate teaching, postgraduate teaching, supervision, curriculum delivery, clinical teaching, studio teaching, laboratory teaching, online teaching, and academic mentoring as eligible teaching roles.
- Exclude administrative staff without teaching duties, retired teachers no longer involved in teaching, visiting scholars without teaching responsibilities, external trainers not employed by the university, and individuals without informed consent.
- Use stratified convenience sampling across broad discipline groups and academic ranks. Code discipline group as Education, Humanities, Social Sciences, Business and Management, Science, Technology, Engineering and Mathematics, Health Sciences, Arts and Design, or Other.
- Set the minimum target at 300 valid responses for regression models with multiple background and psychological predictors16. Recruit 330–360 submitted responses to allow for exclusion during screening.
- Conduct recruitment during a regular teaching period, avoid examination weeks and major institutional evaluation periods, use a 4-week recruitment window, and extend recruitment once for 7 calendar days if fewer than 300 valid responses are available.
NOTE: Apply identical eligibility criteria, discipline categories, recruitment wording, and exclusion rules across all universities.Pause after ethics approval, institutional permissions, recruitment channels, sampling frame, and recruitment materials are finalized.
3. Questionnaire structure and construct map
- Build the questionnaire in seven sections: informed consent, demographic and professional background, basic psychological need satisfaction, professional development motivation, teaching self-efficacy, professional development engagement, and reflective practice.
- Define each construct, item code, item source, item number, response scale, scoring method, expected score range, and permission status in Table 1 before programming the questionnaire.
- Use a 5-point Likert response scale for all main psychometric items, ranging from 1 (strongly disagree) to 5 (strongly agree).
- Collect institution code, discipline group, gender, age group, academic rank, teaching years, weekly teaching hours, professional development activities and hours in the last 12 months, and perceived administrative workload before psychometric items.
- Code age group, teaching years, discipline group, and perceived administrative workload using the codebook in Supplementary File 1. Use broad discipline categories instead of exact department names.
- Provide the full questionnaire, variable names, item codes, response coding, scoring syntax, exclusion coding, and script structure in Supplementary File 1.
NOTE: Lock item codes before programming the online questionnaire. Do not change item codes after pilot testing unless the questionnaire, codebook, and analysis script are updated together.
4. Construct measurement and item allocation
- Measure autonomy, competence, and relatedness need satisfaction with four items each.
- Measure autonomous motivation with six items and controlled motivation with four items reflecting self-endorsed and pressure-based reasons for teaching-related professional development17.
- Measure teaching self-efficacy with 12 university-adapted items covering instructional strategies, student engagement, and classroom management or interaction18.
- Measure professional development engagement with six items covering active participation, sustained learning effort, attention, application, continued learning, and willingness to engage in future professional development19.
- Measure reflective practice with four items covering post-activity reflection, usefulness evaluation, teaching-strategy revision, and documentation or discussion of learning outcomes20.
- Include two instructed-response attention-check items: one requiring “Agree” after the motivation items and one requiring “Disagree” after the teaching self-efficacy items.
- Keep the final questionnaire between 38 and 44 main items, excluding informed consent and background questions.
- Classify all psychometric items in Table 1 as adapted, newly written, or domain-aligned, and record source, adaptation status, and permission status.
NOTE: Do not reproduce restricted scale items verbatim unless written permission has been obtained or the source explicitly permits such use.
5. Expert review and item refinement
- Invite three to five reviewers with expertise in motivation theory, higher education or teacher professional development, and quantitative survey research. Include one bilingual reviewer if translation is used.
- Provide reviewers with the study aim, construct definitions, item list, response scale, target population, scoring plan, and permission-status table.
- Ask reviewers to rate construct relevance, wording clarity, cultural appropriateness, respondent burden, and social-desirability risk using a 4-point relevance scale.
- Retain items rated 3 or 4 by at least 80% of reviewers. Revise or remove items with low relevance, ambiguous wording, cultural mismatch, social-desirability risk, duplication, or double-barreled wording.
- Retain at least four items for each main construct and prepare an item-decision log with item code, reviewer concern, revision decision, final wording, source status, and permission status.
NOTE: Pause after expert review. Resume only after the revised questionnaire, item-decision log, codebook, and scoring syntax use identical item codes.
6. Translation and language verification
- Use the original study language if all participating teachers can complete the questionnaire in that language.
- Apply forward translation and back translation if English-source items are administered in another language.
- Ask two bilingual translators to translate the questionnaire independently, reconcile the translations, and ask a third bilingual translator to back-translate the reconciled version into English.
- Compare the back-translated version with the source version for changes in construct meaning, response direction, and item intensity21. Revise items when meaning changes are identified.
- Conduct cognitive checking with five university teachers and ask them to identify confusing, ambiguous, sensitive, repeated, or culturally inappropriate items.
- Finalize and lock the administered version after translation and cognitive-checking issues are resolved.
NOTE: Use one finalized questionnaire version for all main-study participants unless each language version has passed the same verification procedure.
7. Pilot testing
- Recruit 20-30 university teachers from the target population for pilot testing and exclude them from the main survey.
- Administer the pilot questionnaire through the same type of institutionally approved online survey platform planned for the main study.
- Record completion time automatically from the first post-consent questionnaire page to final submission, and collect participant comments on wording, repetition, survey length, sensitive items, and display problems.
- Calculate the median pilot completion time. Define the minimum valid completion-time threshold as one-third of the pilot median or 180 s, whichever is longer, and define the borderline-time range as the threshold plus 60 s.
- Revise the questionnaire if the pilot median completion time is below 5 min or above 15 min, if item missingness exceeds 10% with wording-related comments, or if more than 10% of pilot participants misunderstand either of the attention-check item.
- Calculate preliminary internal consistency for each scale and lock the questionnaire, codebook, scoring syntax, completion-time threshold, and borderline-time range before main recruitment.
NOTE: Do not use pilot responses in the main analysis dataset. Resume main recruitment only after the questionnaire, codebook, completion-time rules, and scoring syntax are locked.
8. Online survey setup
- Build the questionnaire in an institutionally approved online survey platform using the platform-configuration checklist in Supplementary File 1.
- Disable collection of Internet Protocol addresses, geolocation data, device identifiers, names, and email addresses.
- Place the participant information sheet and electronic informed-consent item on the first page. Terminate the survey automatically when “I do not agree to participate” is selected.
- Use forced response only for consent and eligibility items. Allow psychometric items to be skipped for prespecified missing-data handling.
- Display one construct block per page, keep consent, eligibility, demographic, and attention-check items fixed, and apply block-level item randomization only within construct blocks when supported by the platform.
- Use non-identifying duplicate-prevention settings and avoid Internet Protocol address tracking.
- Test the survey link on desktop, laptop, tablet, and smartphone devices. Submit and export at least five test responses, then verify consent branching, eligibility branching, variable names, response codes, timestamps, missing values, completion time, and attention-check coding using Supplementary File 1.
- Confirm that skipped psychometric items are exported as missing values rather than zeros. Delete test responses before recruitment.
NOTE: Do not start recruitment if skipped psychometric items are exported as zeros or if consent branching, eligibility branching, or attention-check coding is incorrect.
9. Recruitment procedure
- Send the recruitment invitation through general institutional channels, faculty development offices, academic mailing lists, or teacher professional development groups.
- Use a neutral recruitment message stating the study purpose, eligibility criteria, approximate completion time, voluntary participation, anonymity protection, and survey closing date.
- Do not ask direct supervisors to recruit individual staff members, provide department-level participation reports, or provide individual completion-linked incentives unless approved by the ethics committee.
- Send the first invitation on Day 1, the first reminder on Day 10, and the final reminder on Day 21.
- Close the survey on Day 28 unless the approved 7-calendar-day extension is activated because fewer than 300 valid responses are available.
- Record recruitment dates, reminder dates, submitted responses, extension status, and final closure date in the recruitment log.
NOTE: Pause after survey closure. Export and lock the raw dataset before applying any cleaning rule.
10. Data export and anonymization
- Export the survey data within 48 h after survey closure in spreadsheet and comma-separated values formats. Save the original export as a read-only raw-data file and create a separate working copy for cleaning and analysis.
- Replace platform-generated response identifiers with anonymous respondent codes, such as T001, T002, and T003.
- Inspect all variables for accidental identifiers. Remove free-text content containing names, exact department names, institutional email addresses, or identifiable events.
- Replace university names with University A, University B, University C, and University D, and replace exact discipline names with broad discipline groups.
- Store the raw-data file, working file, cleaned-data file, screening log, codebook, questionnaire, and analysis scripts in encrypted institutional storage with access restricted to approved research team members.
- Record every anonymization and cleaning decision in the screening log.
NOTE: Do not clean, recode, or score data directly in the raw-data file. Resume data cleaning only after the raw-data file has been preserved and the working file contains no direct or indirect identifiers.
11. Response-quality screening
- Screen all submitted responses before scale scoring using the response-quality and analysis-decision rules in Table 2.
- Exclude responses without electronic informed consent, failed eligibility screening, completion time below the prespecified minimum valid threshold, failure of either attention-check item, or more than 20% missing psychometric items.
- Review responses in the borderline completion-time range. Retain them only when both attention checks are passed, missingness is within the allowed range, and no invariant response pattern is observed.
- Flag respondents who select the same Likert response option for at least 90% of psychometric items, and identify careless responses by combining completion time, attention-check results, missingness, and invariant response patterns22.
- Inspect responses for implausible demographic combinations. Set one implausible demographic value to missing if psychometric responses are otherwise valid, and exclude the response when multiple demographic values indicate ineligibility.
- Record one primary exclusion reason for every removed response, create an inclusion-status variable coded as 1 = included and 0 = excluded, generate the participant-flow summary for Figure 2, and save cleaned_teacher_PD_survey.csv.
NOTE: Apply exclusion rules before computing scale scores. Do not exclude cases after viewing regression significance unless the exclusion rule was prespecified.
12. Missing-data handling and scale scoring
- Convert Likert-scale responses to numeric values ranging from 1 to 5, check item direction, and reverse-score negatively worded items before scale scoring.
- Compute a scale score only when at least 75% of items in that scale are completed. Use the available-item mean when no more than 25% of items within a scale are missing, and set the scale score to missing when more than 25% are missing.
- Compute scale scores as follows: autonomy need satisfaction = mean of AUT1–AUT4; competence need satisfaction = mean of COM1–COM4; relatedness need satisfaction = mean of REL1–REL4; autonomous motivation = mean of AM1–AM6; controlled motivation = mean of CM1–CM4; teaching self-efficacy = mean of TSE1–TSE12; professional development engagement = mean of PDE1–PDE6; reflective practice = mean of RP1–RP4.
- Create scored_teacher_PD_survey.csv containing respondent code, background variables, item responses, scale scores, inclusion status, and exclusion reason.
NOTE: Confirm that all scale scores remain within the 1–5 range after scoring.
13. Statistical software setup and script execution
- Use R version 4.3.2 or later and organize the project folder according to the reproducibility structure in Supplementary File 1.
- Run the script sequence provided in Supplementary File 1: 01_import_anonymize.R, 02_screen_score.R, 03_reliability_descriptives.R, 04_regression_sensitivity.R, and 05_reproducibility_check.R.
- Run all scripts from the project folder without manually editing intermediate datasets or generated outputs.
- Export tables as spreadsheet files, generated figures as high-resolution PDF files, and R session information as sessionInfo.txt.
NOTE: Do not overwrite raw data or manually edit generated analysis outputs. Pause after the script imports the data without errors and confirms that all required variables are present.
14. Reliability and item diagnostics
- Calculate Cronbach’s alpha, McDonald’s omega, corrected item-total correlations, descriptive statistics, skewness, kurtosis, and floor or ceiling effects for each multi-item scale23.
- Interpret reliability values from 0.70 to 0.79 as acceptable, 0.80 to 0.89 as good, and 0.90 or higher as high internal consistency. Treat values above 0.95 as possible item redundancy.
- Flag corrected item-total correlations below 0.30. Remove or revise an item only when weak item performance is consistent with conceptual mismatch, unclear wording, or prespecified expert-review concerns.
- Flag floor or ceiling effects when more than 15% of respondents obtain the lowest or highest possible scale score.
- Export the reliability and item-diagnostic output as Table_reliability_item_diagnostics.xlsx.
NOTE: Do not delete items after main data collection unless the deletion rule was prespecified.
15. Descriptive and correlation analysis
- Calculate descriptive statistics for demographic variables, professional background variables, and construct scores.
- Report categorical variables as frequency and percentage. Report continuous or ordinal professional variables as mean and standard deviation when approximately symmetric, and as median and interquartile range when clearly skewed.
- Confirm that each construct score falls within the expected 1–5 range and inspect histograms or density plots for major distributional distortion.
- Calculate Pearson correlations among construct scores when scale means are approximately continuous, and calculate Spearman correlations as a sensitivity check when distributions are markedly skewed.
- Interpret correlations from 0.10 to 0.29 as small, 0.30 to 0.49 as moderate, and 0.50 or above as large24. Flag correlations above 0.85 as possible construct overlap.
- Export descriptive statistics as Table_descriptive_statistics.xlsx and the correlation matrix as Table_correlation_matrix.xlsx.
NOTE: Inspect construct overlap before regression analysis. Add factor analysis or reduce interpretive claims when theoretically distinct constructs show very high correlations.
16. Regression analysis
- Fit prespecified hierarchical linear regression models.
- Use autonomous motivation as the dependent variable in Model 1. Enter age group, gender, academic rank, teaching years, professional development hours in the last 12 months, and administrative workload in Step 1; autonomy, competence, and relatedness need satisfaction in Step 2; and controlled motivation in Step 3.
- Use professional development engagement as the dependent variable in Model 2. Enter age group, gender, academic rank, teaching years, professional development hours in the last 12 months, and administrative workload in Step 1; autonomous motivation and controlled motivation in Step 2; and teaching self-efficacy in Step 3.
- Use reflective practice as an exploratory dependent variable only if prespecified in the ethics-approved analysis plan.
- Mean-center continuous predictors before creating interaction terms. Do not create moderation terms unless moderation is included in the research question and analysis plan.
- Report unstandardized coefficients, standard errors, standardized coefficients, 95% confidence intervals, p values, adjusted R2, and change in R2.
- Inspect variance inflation factor values, residual-versus-fitted plots, quantile-quantile plots, standardized residuals, and Cook’s distance. Treat variance inflation factor values above 5.00, standardized residuals above |3.00|, or Cook’s distance above 1.00 as requiring inspection.
- Remove influential cases only when a data-entry error, eligibility error, or duplicate-response problem is confirmed.
- Export regression output as Table_regression_models.xlsx and diagnostic plots as high-resolution PDF files.
NOTE: Do not remove influential cases solely because they change model significance.
17. Sensitivity analysis and reproducibility check
- Repeat the main regression models using listwise deletion of cases with missing model variables and after excluding borderline-time responses.
- Compare coefficient direction, standardized coefficient size, standard error, and adjusted R2 with the primary models.
- Treat results as stable if key coefficient directions remain unchanged and standardized coefficients differ by less than 0.10.
- Retain the prespecified screening rule if sensitivity analyses do not materially alter the interpretation.
- Regenerate descriptive tables, reliability tables, correlation matrices, regression tables, participant-flow figure, workflow figure, and any construct-score figures from the cleaned dataset and final script.
- Archive the cleaned anonymized dataset, codebook, screening log, questionnaire, analysis scripts, generated outputs, and R session information according to the approved data-sharing plan.
- Confirm that all archived files use the same respondent identifier and contain no direct or indirect identifiers.
NOTE: Do not archive the reproducibility package until all outputs have been regenerated from the final script. Resume archiving only after all outputs have been regenerated from the final script.
Results
Participant flow and status of the representative dataset
The representative results reported here were generated from one completed implementation of the protocol. The dataset was collected through the anonymous, cross-sectional questionnaire procedure described above and was not drawn from the pilot test or an illustrative dataset. A total of 326 submitted questionnaire records were exported from the online survey platform. After the prespecified consent, eligibility, response-quality, and missing-data rules were applied, 313 responses were retained for analysis, giving a final inclusion rate of 96.0%. Thirteen responses were excluded before scale scoring: nine because completion time was below the minimum valid threshold, two because attention check 1 was failed, and two because attention check 2 was failed. Among the nine short-duration exclusions, five also showed invariant response patterns during the combined response-quality review. The participant-flow output generated from the screening log is shown in Figure 2. The retained responses were used for scale scoring, reliability estimation, descriptive analysis, correlation analysis, hierarchical regression modeling, diagnostic checking, and sensitivity analysis.
Participant characteristics
The final analytic dataset included teachers from four universities. University A contributed 101 participants (32.3%), University B contributed 70 participants (22.4%), University C contributed 69 participants (22.0%), and University D contributed 73 participants (23.3%). Seven broad discipline groups were represented: Social Sciences (n = 59, 18.8%), Science, Technology, Engineering, and Mathematics (n = 57, 18.2%), Education (n = 50, 16.0%), Humanities (n = 50, 16.0%), Business and Management (n = 49, 15.7%), Health Sciences (n = 31, 9.9%), and Arts and Design (n = 17, 5.4%). Most participants were female (n = 180, 57.5%), followed by male participants (n = 126, 40.3%) and participants who preferred not to report gender (n = 7, 2.2%). The largest age group was 31–40 years (n = 132, 42.2%), followed by 41–50 years (n = 91, 29.1%), 21–30 years (n = 55, 17.6%), 51–60 years (n = 31, 9.9%), and above 60 years (n = 4, 1.3%). Teaching experience was most commonly 6–10 years (n = 107, 34.2%) and 11–20 years (n = 92, 29.4%). Table 3 reports the complete participant-characteristics output, including institution, discipline, gender, age group, academic rank, teaching years, weekly teaching hours, professional development participation, and perceived administrative workload.
Scale scores, reliability, and item diagnostics
All construct scores were calculated according to the prespecified scoring rules. As shown in Table 4, all scale scores remained within the expected 1–5 range. Mean construct scores were 2.99 for autonomy need satisfaction, 2.96 for competence need satisfaction, 2.96 for relatedness need satisfaction, 2.97 for autonomous motivation, 3.75 for controlled motivation, 2.96 for teaching self-efficacy, 2.72 for professional development engagement, and 2.87 for reflective practice. Standard deviations ranged from 0.89 to 1.20. Observed construct scores ranged from 1.00 to 5.00 for all constructs except controlled motivation, which ranged from 1.25 to 5.00. The construct-score profile is shown in Figure 3A.
Cronbach’s alpha values ranged from 0.740 to 0.963, and McDonald’s omega values ranged from 0.748 to 0.965. Autonomy need satisfaction showed the lowest alpha value but remained within the acceptable range. Autonomous motivation and professional development engagement showed high internal consistency. Teaching self-efficacy showed the highest internal consistency estimate (Cronbach’s alpha = 0.963; McDonald’s omega = 0.965), exceeding the prespecified value at which possible item redundancy should be considered. Minimum corrected item-total correlations ranged from 0.41 to 0.72, and no floor or ceiling effect exceeded the prespecified 15% threshold. No item was removed after main data collection because the protocol did not specify automatic item deletion based only on reliability diagnostics. Table 4 reports valid sample sizes, score ranges, descriptive statistics, Cronbach’s alpha values, McDonald’s omega values,minimum corrected item-total correlations, and diagnostic flags.. The reliability and diagnostic profile is shown in Figure 3B.
Construct correlations
The correlation matrix is presented in Table 5. Autonomy, competence, and relatedness need satisfaction were positively associated with autonomous motivation, with correlations ranging from r = 0.63 to r = 0.65. Controlled motivation showed weak negative correlations with autonomy need satisfaction (r = -0.17), competence need satisfaction (r = -0.16), relatedness need satisfaction (r = -0.14), and professional development engagement (r = -0.15). Professional development engagement was positively associated with autonomous motivation (r = 0.73), teaching self-efficacy (r = 0.78), and reflective practice (r = 0.78). The strongest observed correlations were between teaching self-efficacy and professional development engagement (r = 0.78) and between professional development engagement and reflective practice (r = 0.78). No inter-construct correlation exceeded the prespecified construct-overlap threshold of 0.85.
Hierarchical regression outputs
Hierarchical regression outputs are reported in Table 6A and Table 6B. In Model 1, autonomous motivation was the dependent variable. The control-only step explained limited variance in autonomous motivation (R2 = 0.012; adjusted R2 = -0.007). After autonomy, competence, and relatedness need satisfaction were added, R2 increased to 0.506. Adding controlled motivation in the final step produced little additional change in model fit (final R2 = 0.507; adjusted R2 = 0.490; ΔR2 = 0.001). In the final model, autonomy need satisfaction (B = 0.284, 95% CI 0.176 to 0.392, β = 0.249, p < 0.001), competence need satisfaction (B = 0.311, 95% CI 0.197 to 0.425, β = 0.271, p < 0.001), and relatedness need satisfaction (B = 0.303, 95% CI 0.191 to 0.415, β = 0.254, p < 0.001) were positively associated with autonomous motivation. Controlled motivation was not significant after the psychological need satisfaction variables were included (B = -0.016, 95% CI -0.118 to 0.086, β = -0.013, p = 0.756). The maximum variance inflation factor was 3.05.
In Model 2, professional development engagement was the dependent variable. The control-only step explained limited variance in professional development engagement (R2 = 0.021; adjusted R2 = 0.001). Adding autonomous motivation and controlled motivation increased R2 to 0.559. Adding teaching self-efficacy further increased R2 to 0.671, with an adjusted R2 of 0.661 and a final-step ΔR2 of 0.112. In the final model, autonomous motivation (B = 0.386, 95% CI 0.284 to 0.488, β = 0.345, p < 0.001) and teaching self-efficacy (B = 0.545, 95% CI 0.443 to 0.647, β = 0.518, p < 0.001) were positively associated with professional development engagement. Teaching self-efficacy showed the larger standardized coefficient. Controlled motivation was not significant after autonomous motivation and teaching self-efficacy were included (B = -0.053, 95% CI -0.143 to 0.037, β = -0.039, p = 0.249). Professional development hours in the previous 12 months showed a small positive association with professional development engagement (B = 0.054, 95% CI 0.023 to 0.085, β = 0.111, p = 0.001). The maximum variance inflation factor was 2.39.
Sensitivity analysis and diagnostic checks
Sensitivity analyses are summarized in Table 6C. For Model 1, the primary analysis included 313 responses and produced R2 = 0.507. The listwise-deletion model included 306 responses and produced R2 = 0.501. The model excluding borderline-time responses included 301 responses and produced R2 = 0.504. Across all three versions, autonomy, competence, and relatedness need satisfaction remained positively associated with autonomous motivation. The largest standardized-coefficient difference from the primary model was 0.04 for the listwise-deletion model and 0.03 for the borderline-time exclusion model.
For Model 2, the primary analysis included 313 responses and produced R2 = 0.671. The listwise-deletion model included 306 responses and produced R2 = 0.666. The model excluding borderline-time responses included 301 responses and produced R2 = 0.673. Across these analyses, autonomous motivation and teaching self-efficacy remained positively associated with professional development engagement. The largest standardized-coefficient difference from the primary model was 0.05 for the listwise-deletion model and 0.04 for the borderline-time exclusion model. The results met the prespecified stability criterion because key coefficient directions did not change and standardized coefficients differed by less than 0.10 from the primary models.
Diagnostic checks were generated from the analysis script. In both final regression models, no predictor exceeded the variance inflation factor threshold of 5.00. Standardized residuals and Cook’s distance were reviewed. The largest absolute standardized residual was 2.74 in Model 1 and 2.81 in Model 2, and the largest Cook’s distance was 0.06 and 0.07, respectively. No case was removed solely because it influenced model significance. Diagnostic plots were used to inspect linearity, homoscedasticity, residual normality, and influential observations. Together, the outputs show the result sequence produced by the protocol: participant-flow documentation, participant-characteristics reporting, scale-score generation, reliability and item diagnostics, construct correlation analysis, hierarchical regression modeling, sensitivity analysis, and reproducibility checking.
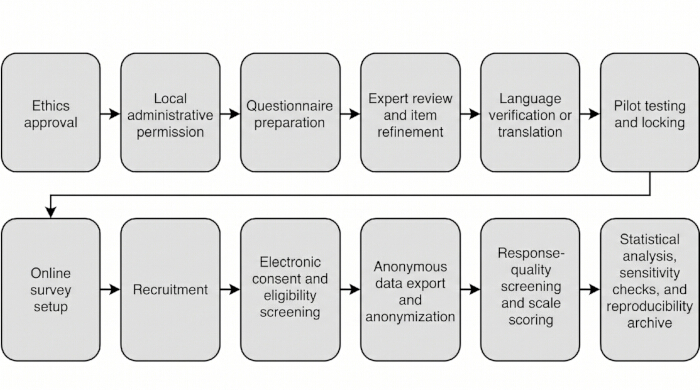
Figure 1: Workflow of the anonymous cross-sectional survey protocol. The workflow shows the procedure from ethics approval, institutional permission, questionnaire preparation, pilot testing, recruitment, electronic consent, data export, anonymization, response-quality screening, scale scoring, statistical analysis, sensitivity analysis, and reproducibility archiving. Please click here to view a larger version of this figure.
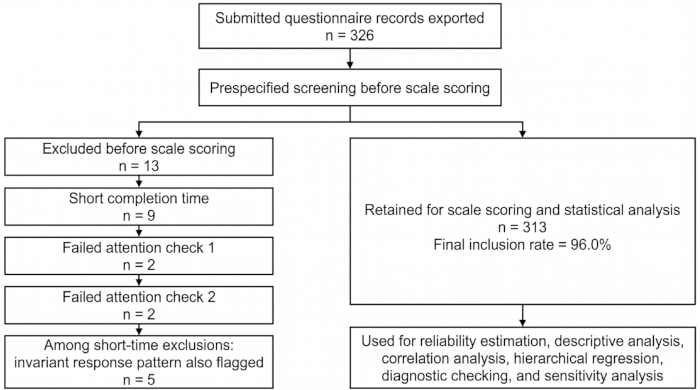
Figure 2: Participant flow after response-quality screening. The diagram shows exported questionnaire records, excluded responses, primary exclusion reasons, and final responses retained for scale scoring and statistical analysis. Please click here to view a larger version of this figure.
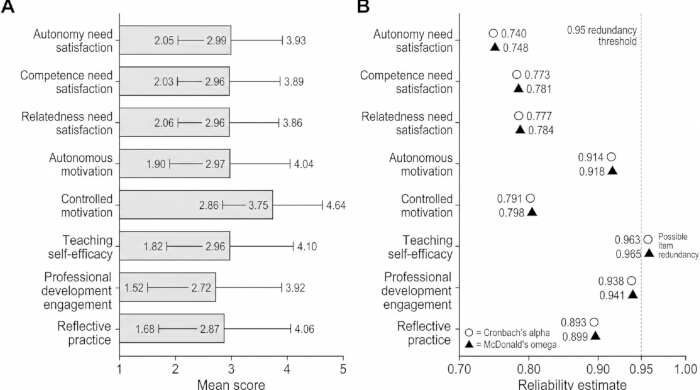
Figure 3: Construct score and reliability diagnostic profiles. (A) Construct-score profile showing mean scores and standard deviations for the eight study constructs. (B) Reliability and diagnostic profile showing Cronbach’s alpha, McDonald’s omega, and prespecified diagnostic flags, including possible item redundancy when internal consistency estimates exceed 0.95. Please click here to view a larger version of this figure.
Table 1: Construct map, item allocation, adaptation status, permission status, and scoring rules. This table defines each construct, item code, number of items, measurement basis, permission/use status, theoretical role, and scoring rule. Please click here to download this file.
Table 2: Response-quality screening, scoring, analysis, and reproducibility decision rules.(A) Consent, eligibility, and response-quality screening rules. (B) Missing-data handling, scale scoring, and dataset construction rules. (C) Reliability, descriptive, and correlation decision rules. (D) Regression, diagnostic, sensitivity-analysis, and reproducibility rules. Please click here to download this file.
Table 3: Participant characteristics of the final analytic sample. This table reports institution, discipline group, gender, age group, academic rank, teaching years, weekly teaching hours, professional development participation, and perceived administrative workload. Please click here to download this file.
Table 4: Descriptive statistics, reliability estimates, and item-diagnostic flags for construct scores.This table reports valid sample size, mean, standard deviation, score range, Cronbach’s alpha, McDonald’s omega, minimum corrected item-total correlation, and diagnostic flag for each construct. Please click here to download this file.
Table 5: Correlation matrix among construct scores. This table presents Pearson correlations among psychological need satisfaction, motivation, teaching self-efficacy, professional development engagement, and reflective practice constructs. Please click here to download this file.
Table 6: Hierarchical regression outputs and sensitivity analyses. (A)Hierarchical regression predicting autonomous motivation. (B) Hierarchical regression predicting professional development engagement. (C) Sensitivity analysis comparing primary models, listwise-deletion models, and models excluding borderline-time responses. Please click here to download this file.
Supplementary File 1: Questionnaire, codebook, scoring rules, and analysis-script structure. This file includes the administered questionnaire, variable codebook, exclusion and scoring rules, locked screening parameters, survey-platform checklist, R analysis script, reproducibility files, and final quality-control checks.Please click here to download this file.
Discussion
The representative results indicate that the protocol can be used to examine university teachers’ professional development beyond attendance, training hours, or completion records. Autonomy, competence, and relatedness need satisfaction were all positively associated with autonomous motivation, and these associations remained after background variables were entered into the model. This finding is consistent with the self-determination theory assumption that self-endorsed motivation is supported when individuals experience choice, capability, and social connection25. For professional development research, this matters because participation itself is often an incomplete indicator. A teacher may attend a required workshop without experiencing it as useful, while another may participate less often but connect the activity closely with teaching decisions. The protocol therefore helps locate the motivational conditions under which professional development is more likely to be experienced as meaningful professional learning. This approach is also consistent with the need for clearer measurement of the mechanisms linking professional development activities with teacher outcomes26.
The controlled motivation results require careful interpretation. Controlled motivation had the highest mean score among the measured constructs, but it showed weak or non-significant associations with the main outcomes after need satisfaction, autonomous motivation, and teaching self-efficacy were considered. This does not mean that teachers were simply unmotivated or compliant. University professional development often takes place within promotion systems, teaching-quality reviews, institutional audits, workload expectations, and documentation requirements. Pressure-based participation can therefore coexist with genuine professional goals. The results suggest that institutional requirements may bring teachers into professional development, but they do not fully explain whether teachers engage with the activity or carry it into practice. This interpretation fits the view that teacher professional development is shaped by context, identity, collaboration, and change in practice rather than by attendance alone27.
Professional development engagement was most closely associated with autonomous motivation and teaching self-efficacy. These two variables capture different parts of the process. Autonomous motivation reflects why teachers participate and continue learning; teaching self-efficacy reflects whether they believe they can apply what they learn in classroom, online, laboratory, studio, clinical, or supervisory teaching. In the final engagement model, teaching self-efficacy had the larger standardized coefficient, suggesting that perceived teaching capability may be especially important when professional development is expected to move beyond participation and into practice. This is compatible with models of teacher learning that describe professional development as a process shaped by individual, workplace, and learning-activity systems28. It also aligns with Guskey’s view that professional learning becomes more durable when teachers can connect new practices with evidence of improvement29.
The measurement results were mostly acceptable, but they also show why the protocol includes item diagnostics. Teaching self-efficacy had very high internal consistency, which supports reliability but may also indicate item overlap. The protocol handled this conservatively by treating values above 0.95 as a redundancy flag rather than deleting items after the main analysis. This is important because teaching self-efficacy is a multidimensional construct, and items covering instructional strategies, student engagement, and classroom management or interaction may be closely related but not necessarily interchangeable30. Future applications should test whether a single 12-item score is sufficient or whether subdomain scores provide clearer interpretation. The positive association between professional development engagement and reflective practice also fits the study design. Engagement captures active participation and continued learning effort, while reflective practice captures how teachers review, adapt, document, or discuss what they learned. In teaching work, these processes often overlap because professional knowledge develops through action, reflection, and adjustment31.
Several procedural points are important for using the protocol correctly. Ethics approval, institutional permission, scale-source documentation, permission checking, locked item codes, pilot-based completion-time thresholds, anonymous platform settings, raw-data preservation, and prespecified exclusion rules should be completed before analysis begins. The most likely errors are practical ones: changing item codes after pilot testing, exporting skipped items as zeros instead of missing values, retaining indirect identifiers, or removing cases after seeing the regression results. The protocol reduces these risks through a locked codebook, screening log, participant-flow figure, script-based scoring, diagnostic flags, and reproducibility archive. The protocol can be adapted for other universities, languages, and professional development systems, but the consent logic, eligibility criteria, response-quality rules, missing-data rules, and analysis sequence should remain traceable. When the questionnaire is translated or used across cultures, cognitive checking and additional measurement-structure testing should be added before making strong comparisons across groups.
The protocol also has clear limits. The cross-sectional design cannot establish whether psychological need satisfaction causes autonomous motivation, whether teaching self-efficacy increases engagement, or whether reflective practice follows engagement over time. The data are self-reported, so common-method bias, social desirability, and shared response tendencies remain possible despite anonymity, neutral wording, attention checks, completion-time screening, invariant-response review, and sensitivity analyses32. The representative dataset also came from a defined university-teacher sample, and results may differ where professional development is more centralized, more voluntary, discipline-specific, or closely tied to promotion. Future studies can extend the protocol through repeated measurements, interviews, classroom observation, peer-observation records, revised syllabi, course-redesign notes, or reflective portfolios. It can also be adapted for K-12 teacher professional development, corporate learning programs, clinical teaching development, and cross-national higher-education research, provided that local terminology, eligibility rules, institutional permissions, and item wording are adjusted carefully. Used within these boundaries, the protocol offers a reproducible way to study motivation, efficacy, engagement, and reflection as connected parts of professional learning33.
Disclosures
The authors declare that they have no competing financial or non-financial interests related to this work.
Acknowledgements
The authors thank the university teachers who participated in this study for their time and willingness to share their professional development experiences. No specific funding was received for this work.
Materials
| Name | Company | Catalog Number | Comments |
|---|---|---|---|
| Adobe Acrobat Pro | Adobe Inc., San Jose, CA, USA | Adobe Acrobat Pro 2024 | Used to review the final questionnaire PDF, participant information sheet, consent form, exported figures, and submitted supplementary files. |
| Analysis script | Prepared by the research team | analysis_script.R | Runs data import, anonymization checks, response-quality screening, missingness calculation, scale scoring, descriptive statistics, reliability analysis, correlation analysis, regression models, diagnostic checks, sensitivity analyses, table export, figure export, and session-information export. |
| Cleaned Teacher PD Survey CSV | Generated from analysis_script.R | cleaned_teacher_PD_survey.csv | Contains de-identified retained and excluded records with inclusion status, exclusion reason, screening variables, and cleaned background variables. |
| Codebook | Prepared by the research team | codebook.xlsx | Defines variable names, item codes, response coding, missing-value coding, scale-score formulas, inclusion status, exclusion reasons, table variables, and output file names. |
| Desktop computer | Windows 11 Pro | Not Applicable; Institutional research computer: 16 GB RAM and full-disk encryption enabled. | Used for survey programming, data export, script execution, table generation, figure export, and secure file archiving. |
| Ethics approval document | Institutional human research ethics committee | ethics_approval.pdf | Documents ethics approval before recruitment, including approval number, approval date, approved study title, investigator information, and approved recruitment and data-handling conditions. |
| Institutional permission records | Participating universities | institutional_permission_records.pdf | Contains written permission records from participating universities for teacher recruitment through approved institutional channels. |
| Microsoft Excel | Microsoft Corporation, Redmond, WA, USA | Microsoft Excel 365 | Used to inspect exported datasets, prepare the codebook, review screening logs, and check exported table files. The analysis dataset was not manually edited after script-based cleaning. |
| Participant information sheet and consent form | Prepared by the research team and approved by the ethics committee | participant_information_and_consent. | Provides study purpose, eligibility criteria, voluntary participation statement, anonymity statement, risks and benefits, data-retention information, investigator contact details, ethics information, and electronic consent wording. |
| Questionnaire file | Prepared by the research team | questionnaire.pdf | Contains the locked questionnaire, item order, item codes, response options, eligibility items, background items, construct items, and attention-check items. |
| R package manifest | Generated from the R environment | package_manifest.txt | Lists the R packages and package versions used for data import, cleaning, scoring, reliability estimation, regression diagnostics, visualization, output generation, and reproducibility checking. |
| R statistical software | R Foundation for Statistical Computing, Vienna, Austria | R 4.3.2 | Used for data cleaning, scale scoring, statistical analysis, diagnostic checking, figure generation, table export, and reproducibility verification. |
| Reproducibility package | Prepared by the research team | reproducibility_package.zip | Contains questionnaire.pdf, codebook.xlsx, cleaned_teacher_PD_survey.csv, scored_teacher_PD_survey.csv, screening_log.xlsx, analysis_script.R, sessionInfo.txt, package_manifest.txt, table outputs, figure outputs, and diagnostic plots. |
| RStudio Desktop IDE | Posit Software, PBC, Boston, MA, USA | RStudio Desktop 2023.12.1 | Used to run, document, and review analysis_script.R. |
| Scored Teacher PD Survey CSV | Generated from analysis_script.R | scored_teacher_PD_survey.csv | Contains included responses and calculated scale scores, including AUT_MEAN, COM_MEAN, REL_MEAN, AM_MEAN, CM_MEAN, TSE_MEAN, PDE_MEAN, and RP_MEAN. |
| Screening log | Generated from analysis_script.R and reviewed by the research team | screening_log.xlsx | Records consent, eligibility, completion-time screening, attention-check outcomes, missingness, invariant-response flags, exclusion reasons, recoding decisions, and final inclusion status. |
| Secure institutional storage | Participating university information-technology service | Encrypted institutional research drive | Used to store raw data, cleaned data, scored data, codebook, screening log, questionnaire, analysis script, ethics documents, permission records, table outputs, figure outputs, and the reproducibility package. Access was restricted to approved research personnel. |
| Session information file | Generated from R | sessionInfo.txt | Records R version, operating system, attached packages, package versions, and reproducibility environment. |
| Table and figure outputs | Generated from analysis_script.R | outputs_tables_figures folder | Contains participant-flow output, descriptive tables, reliability tables, correlation matrix, regression tables, sensitivity-analysis tables, construct-score figures, and diagnostic plots. |
| Wenjuanxing / Questionnaire Star online survey platform | Changsha Ranxing Information Technology Co., Ltd., Changsha, China | Wenjuanxing web survey project | Used for electronic consent, anonymous questionnaire administration, eligibility branching, attention-check items, completion-time recording, one-response-per-browser setting, and export of questionnaire records. |
References
- Desimone LM. Improving impact studies of teachers' professional development: Toward better conceptualizations and measures. Educ Res. 2009;38(3):181-99.
- Opfer VD, Pedder D. Conceptualizing teacher professional learning. Rev Educ Res. 2011;81(3):376-407.
- Ryan RM, Deci EL. Self-determination theory and the facilitation of intrinsic motivation, social development, and well-being. Am Psychol. 2000;55(1):68-78.
- Deci EL, Ryan RM. The "what" and "why" of goal pursuits: Human needs and the self-determination of behavior. Psychol Inq. 2000;11(4):227-68.
- Avalos B. Teacher professional development in Teaching and Teacher Education over ten years. Teach Teach Educ. 2011;27(1):10-20.
- Tschannen-Moran M, Woolfolk Hoy A. Teacher efficacy: Capturing an elusive construct. Teach Teach Educ. 2001;17(7):783-805.
- Guskey TR. Professional development and teacher change. Teach Teach. 2002;8(3):381-91.
- Schaufeli WB, Bakker AB, Salanova M. The measurement of work engagement with a short questionnaire: A cross-national study. Educ Psychol Meas. 2006;66(4):701-16.
- Schön DA. The Reflective Practitioner: How Professionals Think in Action. Basic Books; New York; 1983.
- Meade AW, Craig SB. Identifying careless responses in survey data. Psychol Methods. 2012;17(3):437-55.
- Dunn TJ, Baguley T, Brunsden V. From alpha to omega: A practical solution to the pervasive problem of internal consistency estimation. Br J Psychol. 2014;105(3):399-412.
- Podsakoff PM, et al. Common method biases in behavioral research: A critical review of the literature and recommended remedies. J Appl Psychol. 2003;88(5):879-903.
- Darling-Hammond L, Hyler ME, Gardner M. Effective Teacher Professional Development. Learning Policy Institute; Palo Alto, CA; 2017.
- Ryan RM, Deci EL. Intrinsic and extrinsic motivation from a self-determination theory perspective: Definitions, theory, practices, and future directions. Contemp Educ Psychol. 2020;61:101860.
- Chen B, et al. Basic psychological need satisfaction, need frustration, and need strength across four cultures. Motiv Emot. 2015;39(2):216-36.
- Green SB. How many subjects does it take to do a regression analysis? Multivariate Behav Res. 1991;26(3):499-510.
- Fernet C, Senécal C, Guay F, Marsh H, Dowson M. The Work Tasks Motivation Scale for Teachers. J Career Assess. 2008;16(2):256-79.
- Skaalvik EM, Skaalvik S. Teacher self-efficacy and teacher burnout: A study of relations. Teach Teach Educ. 2010;26(4):1059-69.
- Klassen RM, Chiu MM. Effects on teachers' self-efficacy and job satisfaction: Teacher gender, years of experience, and job stress. J Educ Psychol. 2010;102(3):741-56.
- Kember D, et al. Development of a questionnaire to measure the level of reflective thinking. Assess Eval High Educ. 2000;25(4):381-95.
- Brislin RW. Back-translation for cross-cultural research. J Cross Cult Psychol. 1970;1(3):185-216.
- DeVellis RF. Scale Development: Theory and Applications. 4th ed. Sage; Thousand Oaks, CA; 2017.
- Field A. Discovering Statistics Using IBM SPSS Statistics. 5th ed. Sage; London; 2018.
- Cohen J. Statistical Power Analysis for the Behavioral Sciences. 2nd ed. Lawrence Erlbaum Associates; Hillsdale, NJ; 1988.
- Vansteenkiste M, Ryan RM. On psychological growth and vulnerability: Basic psychological need satisfaction and need frustration as a unifying principle. J Psychother Integr. 2013;23(3):263-80.
- Slemp GR, Field JG, Cho ASH. A meta-analysis of autonomous and controlled forms of teacher motivation. J Vocat Behav. 2020;121:103459.
- Zhang X, Admiraal W, Saab N. Teacher autonomous motivation for continuous professional development: The relationship with perceived workplace conditions. Teach Teach. 2022;28(8):909-24.
- Fernandes S, et al. Teacher professional development in higher education: The impact of pedagogical training perceived by teachers. Educ Sci. 2023;13(3):309.
- Jacob WJ, Xiong W, Ye H. Professional development programmes at world-class universities. Palgrave Commun. 2015;1:15002.
- Zee M, Koomen HMY. Teacher self-efficacy and its effects on classroom processes, student academic adjustment, and teacher well-being: A synthesis of 40 years of research. Rev Educ Res. 2016;86(4):981-1015.
- Kreber C, Castleden H, Erfani N, Wright T. Self-regulated learning about university teaching: An exploratory study. Teach High Educ. 2005;10(1):75-97.
- van Dijk EE, et al. Phases in novice university teachers' development of self-efficacy across and within teacher tasks: A Rasch analysis. J Furth High Educ. 2024;48(9-10):831-46.
- Postareff L, Lindblom-Ylänne S, Nevgi A. The effect of pedagogical training on teaching in higher education. Teach Teach Educ. 2007;23(5):557-71.