This cross-sectional survey examined associations among generative artificial intelligence use, teaching style, digital literacy, motivation, anxiety, and creativity in Saudi English-as-a-Foreign-Language undergraduates, identifying motivation as an important mediator of the observed relationships.
A subscription to JoVE is required to view this content. Sign in or start your free trial.
Research Article
Generative Artificial Intelligence, Motivation, Anxiety, and Creativity in Saudi English-as-a-Foreign-Language Classrooms: A Cross-Sectional Survey
In This Article
Summary
Abstract
Artificial intelligence (AI) tools such as ChatGPT are increasingly being incorporated into English as a Foreign Language (EFL) education; however, limited evidence is available regarding how their use relates to teaching style, digital literacy, motivation, foreign language classroom anxiety (FLCA), and creativity within the Saudi Arabian context. This study investigated the associations among these constructs and examined the mediating role of motivation within a unified conceptual framework. A quantitative, cross-sectional survey was conducted among 280 undergraduate EFL students enrolled at a public-sector university in Saudi Arabia using validated questionnaire instruments. The proposed relationships were analyzed using Partial Least Squares Structural Equation Modeling (PLS-SEM). The results indicated that ChatGPT use, teaching style, and digital literacy were positively associated with students’ motivation. Higher motivation was associated with lower levels of FLCA and higher levels of creativity. Motivation also mediated the associations between ChatGPT use, teaching style, digital literacy, and FLCA. These findings suggest that students’ motivational experiences are closely associated with the relationships between instructional practices, technology use, and language-learning outcomes. The study provides evidence supporting the integration of appropriate teaching strategies, generative AI tools, and digital literacy within English language education while highlighting the importance of considering students’ motivational and emotional experiences when implementing technology-supported learning environments.
Introduction
The Kingdom of Saudi Arabia is undergoing a transformative educational reform agenda under Vision 2030, which prioritizes the development of 21st-century skills, digital competence, and innovative pedagogical approaches across all educational levels1. Within this national context, English as a Foreign Language (EFL) education continues to face persistent challenges, including an examination-driven culture that emphasizes rote learning and test performance over communicative competence2,3. Limited opportunities for authentic English language interaction outside the classroom, together with high levels of foreign language classroom anxiety (FLCA), further restrict students’ willingness to communicate and engage meaningfully with the target language4. These challenges have prompted educators and policymakers to explore innovative approaches that address motivational deficits, emotional barriers, and creative language use. Artificial intelligence (AI) has emerged as a promising avenue for supporting language learning and transforming instructional practices5. Among AI applications in English Language Teaching (ELT), ChatGPT, a conversational generative AI model, has received considerable attention for providing interactive language practice and immediate individualized feedback in real-time conversational contexts6. These features are particularly relevant in Saudi EFL classrooms, where teacher-centered instruction and limited student interaction continue to constrain creative language production7. ChatGPT may help address these limitations by providing opportunities for authentic, low-anxiety language practice with an AI interlocutor8.
Recent educational reforms in Saudi Arabia have encouraged a transition toward learner-centered pedagogy, creating opportunities to integrate AI technologies that promote active participation, critical thinking, and self-directed learning9,10. When implemented appropriately, ChatGPT can support this transition by extending language practice beyond traditional classroom activities11. However, the effectiveness of AI integration depends partly on students’ digital literacy, defined as their ability to evaluate, use, and engage effectively with digital technologies for learning12. Digital literacy enables learners to make productive use of AI tools while minimizing potential risks, including over-reliance and misinformation13. This competency is particularly important in Saudi higher education, where digital transformation has accelerated under Vision 203014.
Although previous research has examined AI tools, teaching style, digital literacy, motivation, anxiety, and creativity separately, limited evidence has investigated how these constructs interact within a unified framework in non-Western EFL contexts such as Saudi Arabia. Motivation has consistently been identified as an important mechanism linking instructional practices with learning outcomes, including lower anxiety, greater creativity, and sustained engagement15. However, the relationships among ChatGPT usage, teaching style, digital literacy, motivation, FLCA, and creativity have not been comprehensively examined in the Saudi EFL context16. Addressing this gap may provide theoretical and practical insights for designing technology-enhanced language learning environments that support students’ motivational, emotional, and creative development. Accordingly, this study investigates the relationships among ChatGPT usage, teaching style, digital literacy, motivation, FLCA, and creativity among Saudi EFL undergraduates. Specifically, it examines (1) the relationships of ChatGPT usage, teaching style, and digital literacy with students’ motivation; (2) the relationships of motivation with FLCA and creativity; and (3) the mediating role of motivation in the relationships between ChatGPT usage, teaching style, digital literacy, and the outcome variables of anxiety and creativity.
This study contributes to EFL education and technology-enhanced learning by incorporating AI tool usage into existing models of motivation and language learning, thereby extending understanding of technology-supported language learning in contemporary educational settings. It also provides evidence that may inform educators, curriculum designers, and policymakers seeking to integrate AI tools into Saudi EFL instruction. By examining motivation as a mediator linking technology use and instructional practices with FLCA and creativity, the study offers context-specific evidence to support the development of learner-centered language education aligned with Saudi Arabia’s educational reform goals.
Self-Determination Theory (SDT) provides a theoretical framework for understanding the relationship between teaching practices and student motivation in educational contexts17. According to SDT, intrinsic motivation and autonomous forms of extrinsic motivation are supported when learners’ three basic psychological needs—autonomy, competence, and relatedness—are satisfied within the learning environment18. Teaching style is therefore a key contextual factor influencing students’ motivation and engagement19. Autonomy-supportive teaching practices that provide meaningful choices, acknowledge students’ perspectives, and explain learning activities promote intrinsic motivation and self-determined engagement20. In EFL contexts, learner-centered approaches, including facilitator and delegator teaching styles, have been associated with greater student commitment, participation, and interest in language learning21,22. Conversely, teacher-centered instruction may reduce motivation by limiting student participation and autonomy while emphasizing extrinsic rewards over intrinsic interest23,24. In the Saudi EFL context, where traditional instruction has historically emphasized memorization and teacher-centered delivery25, adopting more learner-centered teaching approaches may support students’ motivation26. Based on this theoretical and empirical foundation, the following hypothesis is proposed: H1: Teaching style positively influences EFL students’ motivation.
The relationship between educational technology and learner motivation has been widely investigated27,28. The Technology Acceptance Model (TAM) suggests that learners’ motivation to engage with educational technology is influenced by perceived usefulness and perceived ease of use, which shape behavioral intentions and technology use29. Applied to ChatGPT, this framework suggests that students who perceive the tool as useful and easy to use are more likely to engage with it for language learning30. Empirical studies have reported positive associations between AI-supported language learning and student motivation, with interactive features, immediate feedback, and personalized practice contributing to sustained engagement31,32. ChatGPT may also reduce barriers associated with language anxiety by providing opportunities for low-pressure language practice, which may encourage continued language use33. This potential is particularly relevant in the Saudi context, where FLCA has been identified as an important barrier to motivation and language achievement34. Based on these theoretical and empirical findings, the following hypothesis is proposed: H2: The use of ChatGPT positively influences EFL students’ motivation.
Digital literacy has become an important determinant of students’ motivation in contemporary EFL learning environments35. It refers to the ability to search, evaluate, and use digital technologies and media effectively for learning36. In EFL contexts, digital literacy enables learners to make effective use of digital resources, including ChatGPT, learning management systems, and multimedia tools, to support language learning and motivation37. Students with higher levels of digital literacy are more likely to use learning technologies confidently, fostering competence and autonomy, which are associated with intrinsic motivation38. They are also better equipped to use digital tools for independent language practice, feedback, and sustained engagement in learning39. Based on this literature, the following hypothesis is proposed: H3: EFL students’ digital literacy positively influences EFL students’ motivation.
FLCA and creativity are closely related constructs in EFL education, although their relationship remains complex40. Anxiety may limit learners’ performance on tasks requiring creativity, cognitive flexibility, divergent thinking, and self-expression41. FLCA reflects learners’ fear of making mistakes, negative evaluation, and low self-confidence, all of which may interfere with creative language production42. Creativity, however, is an important competency in EFL learning because it supports contextually appropriate and innovative language use31. Previous studies have reported that learners with higher anxiety are less likely to participate in creative writing and oral communication activities43,44. Based on this literature, the following hypotheses are proposed: 1) H4: EFL students’ motivation is negatively related to their anxiety, and 2) H5: EFL students’ anxiety negatively influences their creativity.
Motivation provides a theoretical mechanism through which teaching style, ChatGPT use, and digital literacy may relate to FLCA45. Motivated learners are more likely to participate actively, persist through challenges, and experience lower levels of communication apprehension46. Supportive teaching practices, AI-assisted language learning, and stronger digital literacy have each been associated with higher motivation and lower anxiety in EFL settings47,48,49. Previous research also suggests that greater motivation is associated with lower classroom anxiety and increased creativity, providing support for motivation as a potential mediator linking instructional practices and technology use with learning outcomes50,51,52. Based on this literature, the following hypotheses are proposed: 1) H6: Motivation mediates the relationship between teaching style and EFL students’ anxiety; 2) H7: Motivation mediates the relationship between the use of ChatGPT and EFL students’ anxiety; and 3) H8: Motivation mediates the relationship between EFL students’ digital literacy and their anxiety. Figure 1 illustrates the hypothesized model in which teaching style, ChatGPT use, and digital literacy are associated with EFL students’ motivation, which in turn mediates their relationships with FLCA and creativity.
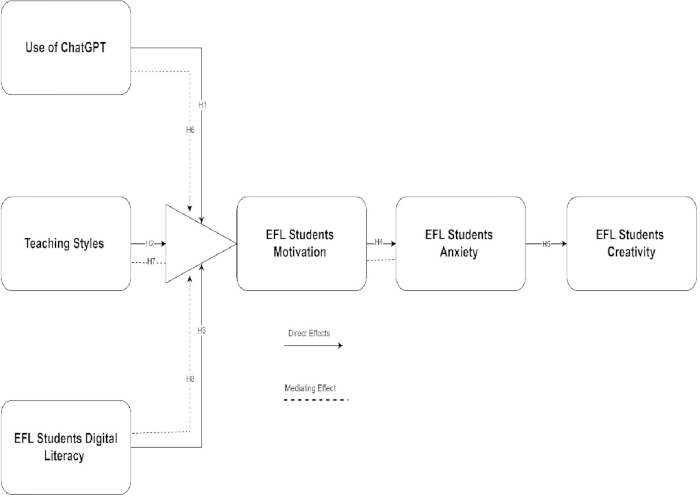
Figure 1. Hypothesized research model. The model depicts the hypothesized relationships among ChatGPT use, teaching style, digital literacy, motivation, foreign language classroom anxiety, and creativity in English-as-a-foreign-language (EFL) students. Solid lines represent direct hypothesized relationships, and dashed lines represent mediating relationships, as indicated in the figure. Please click here to view a larger version of this figure.
Access restricted. Please log in or start a trial to view this content.
Protocol
Although the study did not require formal ethical approval from an institutional review board because of its non-experimental, anonymous survey design involving no physical interventions, manipulation, or deception of participants, all procedures were conducted in accordance with the ethical principles of the Declaration of Helsinki and the American Psychological Association’s guidelines for research involving human participants. Informed consent was obtained from all participants prior to data collection. The institution did not require or issue a formal ethics approval or exemption for this type of study. All respondents were explicitly informed of the research purpose, their voluntary participation, their right to withdraw at any time without consequence, and the strict confidentiality measures applied to their data. No personally identifiable information was collected or reported, and all data were used exclusively for aggregated academic analysis. Particular attention was given to non-intrusive, respectful wording to ensure that the survey did not interfere with the participants’ academic activities or psychological well-being. For the informed consent form, see Supplementary File 1. Moreover, the materials used in this study are listed in the Table of Materials.
Research design
This section outlines the research design, data collection procedures, and sample details used in the study to investigate the relationships among teaching style, ChatGPT usage, digital literacy, motivation, anxiety, and creativity among EFL students. This study employed a quantitative, cross-sectional research design to examine the mediating role of motivation in the relationships among teaching style, ChatGPT usage, digital literacy, and anxiety among EFL students, and how these variables collectively relate to creativity. A structured survey methodology was adopted to collect primary data, ensuring standardization and reliability in measuring the constructs. The study utilized validated scales to assess all variables, including teaching style, ChatGPT usage, digital literacy, motivation, FLCA, and creativity.
Data and Sample
Data for this study were collected from EFL students enrolled at the University of Jeddah, a public-sector university in Saudi Arabia recognized for its emphasis on language education and the integration of technology in teaching. The participants were selected using a purposive sampling technique, which was deemed appropriate for this study given the specific inclusion criteria requiring participants to have active experience with AI tools such as ChatGPT in their learning environment. This non-probability sampling approach was necessary because the study’s research questions focused on a specific population EFL students who had been exposed to both traditional and technology-assisted learning methods and random sampling would not have guaranteed the inclusion of participants meeting these criteria. While purposive sampling limits the generalizability of the findings to the broader population, it was justified for this exploratory investigation to ensure that participants possessed the relevant experiences and perspectives necessary to address the research objectives. To mitigate the limitations of purposive sampling, efforts were made to include participants with diverse academic backgrounds and varying levels of technological proficiency, thereby enhancing the representativeness of the sample within the target population. The final sample consisted of 280 undergraduate EFL students, a size deemed adequate for the statistical techniques employed.
The determination of sample size adequacy was based on established guidelines for Structural Equation Modeling (SEM). Researchers recommend a minimum ratio of 10 cases per estimated parameter for SEM, with more conservative guidelines suggesting 20 cases per parameter for Partial Least Squares SEM (PLS-SEM). The measurement model comprised 29 items for digital literacy, 25 items for teaching style, and 32 items for FLCA, alongside additional items for ChatGPT usage, motivation, and creativity. PLS-SEM guidelines also recommend a minimum sample size equal to 10 times the largest number of formative indicators or the largest number of structural paths directed at a particular construct; therefore, the sample of 280 participants exceeded these minimum requirements. Furthermore, a post hoc power analysis using G*Power53 indicated that a sample of 280 participants provided statistical power exceeding 0.95 for detecting medium effect sizes (f2 = 0.15) with α = 0.05, exceeding the commonly recommended threshold of 0.80. This sample size provides reliable parameter estimates and sufficient statistical power to detect meaningful relationships among the study variables while accommodating the complexity of the proposed measurement and structural models.
Participants and Procedure
The participants were EFL students aged between 18 and 25 years, with a majority being first- and second-year undergraduates enrolled in English language courses. The survey was conducted between September and October 2025, during which students were invited to participate voluntarily. The recruitment process involved outreach through official university channels, including emails and announcements in classes. The participants were EFL students aged 18–25 years who were enrolled as first- or second-year undergraduates in English language courses. Eligibility was determined using predefined inclusion and exclusion criteria. Participants were eligible if they were (a) officially enrolled in undergraduate English language courses at the University of Jeddah, (b) aged 18–25 years, and (c) registered as first- or second-year students. Students were excluded if they were (a) graduate students or upper-division undergraduates outside the foundational course sequence, (b) outside the specified age range, or (c) involved in the questionnaire pretesting phase. To ensure informed consent, participants were briefed on the purpose of the study, the voluntary nature of their participation, and the confidentiality of their responses. The data collection instrument was a structured, self-administered questionnaire distributed physically and electronically using a secure online platform. Validated scales were adapted for measuring teaching style, ChatGPT usage, digital literacy, students’ motivation, FLCA, and creativity. Participants were asked to rate their responses on a 5-point Likert scale, ranging from 1 (Strongly Disagree) to 5 (Strongly Agree). Pre-testing of the questionnaire was conducted with a small group of 30 students to ensure clarity and reliability. Based on the pre-testing results, minor wording adjustments were made to enhance item comprehensibility, and no significant issues with scale reliability or validity were identified. To maintain data integrity and encourage honest responses, anonymity was guaranteed, and participants were assured that their data would only be used for research purposes. Out of the initial 300 responses collected, 280 were deemed valid after screening for incomplete or inconsistent data, yielding a retention rate of 93%. Data screening procedures included examining response patterns for straight-lining, excessive missing data (more than 10%), and multivariate outliers using Mahalanobis distance. This methodological approach provides a robust foundation for analyzing the relationships among the study variables and offers valuable insights into the role of teaching style, AI tools, and digital literacy in shaping EFL students’ motivation, anxiety, and creativity.
Following data collection, 20 responses were excluded from the initial pool of 300 based on predefined criteria: 12 responses were removed due to excessive missing data exceeding 10% of questionnaire items, 5 were eliminated for demonstrating straight-lining response patterns (uniform responses across all items indicating non-engagement), and 3 were identified as multivariate outliers using Mahalanobis distance (p < 0.001) and subsequently removed to prevent distortion of the SEM results. Missing values for retained cases were handled using mean imputation where missing data were minimal (less than 5% per case), as this approach is acceptable for small proportions of missingness in large-scale survey research. The final retention rate of 93% (280 valid responses out of 300 collected questionnaires) represents the proportion of usable responses retained from the total collected questionnaires; however, this should not be interpreted as a true response rate, as the exact number of invited participants could not be calculated because the combined physical and electronic distribution methods through official university channels precluded precise tracking of total invitations. This limitation is acknowledged, and the 93% figure is therefore reported as the proportion of valid responses retained from the collected questionnaires rather than as a response rate relative to the total invited population.
Tools and Measures
This study utilized well-established and validated scales, carefully adapted to the context of EFL education, to measure the core constructs: teaching style, digital literacy, ChatGPT usage, FLCA, motivation, and creativity. Each scale was selected based on its relevance and comprehensiveness in capturing the respective dimensions of the variables under investigation. Digital literacy was measured using an adapted scale based on Rodríguez-de-Dios et al.54, comprising six dimensions with 29 items. These dimensions included Technological Skill, Personal Security Skill, Critical Skill, Device Security Skill, Informational Skill, and Communication Skill, allowing for a comprehensive assessment of students’ proficiency in digital skills essential for modern educational contexts. The usage of ChatGPT was evaluated using an 8-item scale adapted from Abbas et al.55, focusing on students’ interaction with the AI tool for language learning tasks. Teaching style was assessed using an adapted version of Grasha’s Teaching Style Inventory56. This instrument measures five dimensions of teaching styles: Authority, Expert, Personal Model, Facilitator, and Delegator. These dimensions reflect various instructional approaches that influence EFL students’ learning experiences. FLCA was measured using an adapted scale based on Briesmaster and Briesmaster57. This instrument examined anxiety across three dimensions: Communication Apprehension (10 items), Test Anxiety (10 items), and Fear of Negative Evaluation (7 items). Students’ motivation was assessed using a scale adapted from Kanoksilapatham et al.58, measuring three dimensions: Instrumentality Promotion and Prevention, Ethnocentrism and Integrativeness, and Attitude Towards Learning English. The scale included a total of 20 items. EFL students’ creativity was measured using a scale adapted from Govindasamy et al.59, which assessed four dimensions: Originality, Flexibility, Fluency, and Elaboration. Each dimension was measured using three items. To ensure the cultural and contextual suitability of the instruments for the EFL setting, a systematic adaptation procedure was applied. Because the original scales were developed in English, two bilingual EFL experts reviewed and simplified the language to improve clarity for intermediate-level undergraduate students while preserving the original meaning of each construct. The adapted versions were then back-translated into the participants’ first language by an independent translator to verify linguistic and conceptual equivalence, and any discrepancies were resolved through discussion among the research team. Subsequently, three experienced EFL instructors evaluated the adapted instruments for content relevance, cultural appropriateness, and item clarity, resulting in minor wording revisions and the replacement of culturally unfamiliar examples where appropriate. Finally, the revised instruments were pilot-tested with 30 students (see Procedure section), and participant feedback was used to make additional minor wording refinements to improve comprehensibility. This multi-step process ensured that the adapted instruments maintained their original psychometric properties while being appropriate for the target EFL population. For the complete adapted questionnaire, see Supplementary File 2.
Data Analysis Methods
The data collected for this study were analyzed using the Statistical Package for the Social Sciences (SPSS 26) and SmartPLS 4, employing PLS-SEM. This dual-method approach ensured a comprehensive analysis of the data, addressing both descriptive and inferential aspects while testing the hypothesized relationships and mediation effects in the research model. Initially, SPSS was used to perform preliminary data analysis, including data cleaning, descriptive statistics, and reliability testing. Data screening involved checking for missing values, outliers, and normality to ensure the quality and integrity of the dataset. Descriptive statistics, including the mean, standard deviation, and frequency distributions, were computed to summarize the sample characteristics. The main analysis was conducted using SmartPLS 4. PLS-SEM was selected because of its suitability for analyzing complex models with multiple constructs and its robustness for small to medium sample sizes. The analysis was conducted in two stages: evaluation of the measurement model and evaluation of the structural model. In the measurement model assessment, indicator reliability, internal consistency reliability (using composite reliability [CR]), convergent validity (using average variance extracted [AVE]), and discriminant validity (using the heterotrait–monotrait ratio [HTMT]) were evaluated.
Following validation of the measurement model, the structural model was assessed to evaluate the hypothesized relationships among teaching style, ChatGPT usage, digital literacy, motivation, anxiety, and creativity. Path coefficients were analyzed to determine the strength and significance of the direct and indirect effects, with significance assessed using bootstrapping with 5,000 resamples. To assess the significance of direct, indirect, and mediation effects, bias-corrected (BC) bootstrap confidence intervals were constructed using 5,000 bootstrap resamples with a 95% confidence level. The mediation effects of motivation on the relationships between teaching style, ChatGPT usage, digital literacy, and anxiety were also evaluated using bootstrapped confidence intervals. Model fit and predictive power were assessed using the coefficient of determination (R2), predictive relevance (Q2), and standardized root mean square residual (SRMR).
Access restricted. Please log in or start a trial to view this content.
Results
Descriptive Statistics
Descriptive statistics provide an overview of the sample characteristics and the distribution, central tendency, and variability of the study variables. In this study, descriptive analyses were performed to characterize the participant sample and summarize the key variables before conducting the structural analyses.
Table 1 summarizes the demographic characteristics of the 280 undergraduate EFL participants. F...
Access restricted. Please log in or start a trial to view this content.
Discussion
This study investigated the relationships among teaching style, ChatGPT usage, digital literacy, motivation, FLCA, and creativity among Saudi EFL undergraduates, with particular attention to the mediating role of motivation. The findings provide evidence regarding the relationships among pedagogical practices, technology use, and learner characteristics in technology-enhanced language learning. The positive association between teaching style and EFL students’ motivation (H1 supported) is consistent with SDT, which ...
Access restricted. Please log in or start a trial to view this content.
Disclosures
Conflict of Interest:
The author declares no conflicts of interest.
Materials
| Name | Company | Catalog Number | Comments |
|---|---|---|---|
| ChatGPT usage scale (adapted) | Authors; adapted from Abbas et al. | N/A | Eight-item questionnaire assessing students' use of ChatGPT for language learning. |
| Creativity scale (adapted) | Authors; adapted from Govindasamy et al. | N/A | Twelve-item questionnaire assessing originality, flexibility, fluency, and elaboration. |
| Digital literacy scale (adapted) | Authors; adapted from Rodríguez-de-Dios et al. | N/A | Twenty-nine-item questionnaire measuring six dimensions of digital literacy. |
| Foreign language classroom anxiety (FLCA) scale (adapted) | Authors; adapted from Briesmaster & Briesmaster | N/A | Twenty-seven-item questionnaire measuring communication apprehension, test anxiety, and fear of negative evaluation. |
| G*Power | Heinrich Heine University Düsseldorf | Version 3.1.9.7; RRID: SCR_013726 | Software used for post hoc statistical power analysis. |
| IBM SPSS Statistics | IBM Corp. | Version 26; RRID: SCR_002865 | Statistical software used for data cleaning, descriptive statistics, reliability analyses, and preliminary analyses. |
| Mahalanobis distance analysis | IBM SPSS Statistics | Version 26; RRID: SCR_002865 | Statistical procedure implemented in IBM SPSS Statistics to identify multivariate outliers. |
| Motivation scale (adapted) | Authors; adapted from Kanoksilapatham et al. | N/A | Twenty-item questionnaire assessing learner motivation. |
| Paper questionnaire | Authors | N/A | Printed version of the structured self-administered questionnaire used for in-person data collection. |
| Secure online survey platform | Google LLC | N/A | Google Forms platform used for electronic questionnaire distribution. |
| SmartPLS | SmartPLS GmbH | Version 4; RRID: SCR_036419 | Software used for Partial Least Squares Structural Equation Modeling (PLS-SEM), including measurement model evaluation, structural model analysis, bootstrapping (5,000 resamples), and mediation analysis. |
| Structured self-administered questionnaire | Authors | N/A | Questionnaire administered in paper and electronic formats using a 5-point Likert scale (1 = Strongly Disagree to 5 = Strongly Agree). |
| Teaching Style Inventory (adapted) | Authors; adapted from Grasha's Teaching Style Inventory | N/A | Questionnaire measuring Authority, Expert, Personal Model, Facilitator, and Delegator teaching styles. |
| University communication channels | University of Jeddah | N/A | Official email and classroom announcements used for participant recruitment. |
References
- Ansa H. Exploring the role of artificial intelligence (AI) in enhancing EFL education in Saudi Arabia: A review of opportunities, obstacles, and future directions. Educ Sci. 2026;16(6):981.
- Alshehri A, Aldossary S, Jamshed M, Banu S. Incorporating ChatGPT in Saudi EFL classrooms: Oscillating between expectations and anxiety. J Lang Teach Res. 2025;16(5):1673-81.
- Alzubi AA, Alelaiwi AS. Exploring EFL university teachers’ perceptions of AI-generative tools in Saudi Arabia: A mixed-methods study. Discov Comput. 2025;28(1):282.
- Alzubi AA, Nazim M, Alyami N. Do AI-generative tools kill or nurture creativity in EFL teaching and learning? Educ Inf Technol. 2025;30(11):15147-84.
- Allehyani FS, Albedah F, Jamshed M, Warda WU. Exploring Saudi EFL learners’ engagement with AI generative tools in educational settings: Perceptions, practices, and pedagogical outcomes. Theory Pract Lang Stud. 2025;15(6):1959-66.
- Almusharraf A, Bailey D. Generative AI use among Saudi and Korean language learners in higher education: Examination through a modified TAM framework. SAGE Open. 2025;15(4):21582440251387804.
- Alharbi MA, Hassan Al-Ahdal AA. Exploring Saudi EFL learners’ engagement with ChatGPT: A mixed-methods study of perceptions, attitudes, and intentions. SAGE Open. 2025;15(4):21582440251392080.
- Khoso AK, Honggang W, Darazi MA. Empowering creativity and engagement: The impact of generative artificial intelligence usage on Chinese EFL students’ language learning experience. Comput Hum Behav Rep. 2025;18:100627.
- Alalwi FS, Alqahtani N, Jamshed M, Ahmmed MF. AI-driven feedback for pedagogical innovation: Assessing ChatGPT’s impact on Saudi EFL learners’ writing proficiency. World. 2026;16(5).
- Alshehri N. Speaking with AI: Exploring EFL learners’ attitudes, engagement, and satisfaction through ChatGPT conversations. 2026. 10.2139/ssrn.6595190
- Metwally AA, Bin-Hady WR. Probing the necessity and advantages of AI integration training for EFL educators in Saudi Arabia. Cogent Educ. 2025;12(1):2472462.
- Elmahdi OE, et al. AI-Driven Vocabulary Acquisition in EFL Higher Education: Interdisciplinary Insights into Technological Innovation, Ethical Challenges, and Equitable Access. Forum Linguist Stud. 2025;7(4):477–491.
- Al-Nofaie H, Alwerthan TA. Appreciative inquiry into implementing artificial intelligence for the development of language student teachers. Sustainability (Basel). 2024;16(21):9361.
- Alshayban A. Exploring EFL learners’ use of AI outside the classroom. J Lang Teach Res. 2026;17(1).
- Abdelhalim SM, Alsehibany RA. Integrating AI-powered tools in EFL pronunciation instruction: Effects on accuracy and L2 motivation. Comput Assist Lang Learn. 2025;38:1-25.
- Khoso AK, Honggang W, Darazi MA. Trust and attitude towards AI as pathways to creativity: A TAM model study of EFL students’ digital literacy and AI acceptance. Humanit Soc Sci Commun. 2025;13(1):69.
- Xiong X. Influence of teaching styles of higher education teachers on students’ engagement in learning: The mediating role of learning motivation. Educ Chem Eng. 2025;51:87-102.
- Bartholomew KJ, et al. Beware of your teaching style: A school-year-long investigation of controlling teaching and student motivational experiences. Learn Instr. 2018;53:50-63.
- Wiangga IA. The impact of educators’ teaching styles on secondary school learners’ motivation in English. J Educ Manag Strategy. 2024;3(2):136-44.
- Sheikh A, Mahmood N. Effect of different teaching styles on students’ motivation towards English language learning at secondary level. Sci Int (Lahore). 2014;26:825-30.
- Marina I, Natalia M, Tatiana K, Nataliya S. The influence of the teaching style of communication on the motivation of students to learn foreign languages. J Lang Educ. 2019;5(2):67-77.
- Zalukhu FS, Laoli A, Zebua EP, Daeli H. The influence of teacher teaching styles on English learning motivation of eighth-grade students at SMP Negeri 1 Afulu. J Pembelajaran Bahasa dan Sastra. 2026;5(2):1545-54.
- Yue X, Hou X, Zhang J, Li M. The impact of controlling teaching style on student engagement and academic achievement: Differences across varied motivation profiles. Teach Teach Educ. 2026;176:105479.
- Idhaufi NL, Ashari ZM. Relationship between motivation and teachers’ teaching style among secondary school students in Kulai. Man India. 2017;97(12):299-307.
- Zolfaghari M, Janghorbanian Z, Krevan Brojerdi K, Aghaziarati A. Investigation of the role of teaching styles and student-teacher interaction in students’ academic achievement motivation. Educ Strateg Med Sci. 2020;13(3):220-8.
- Avecilla PA, Capiña XE, Javier AY. Teachers’ teaching style as perceived by students and its influence on students’ level of self-regulation and motivation in learning psychology. Technium Soc Sci J. 2023;43:213-24.
- Khoso AK, et al. The dual forces of AI: How generative AI and perceived AI dependency influence fear of missing out (FoMO) and EFL students’ vocabulary acquisition. J Vis Exp. 2025;(226):e69637.
- Ali JK, Shamsan MA, Hezam TA, Mohammed AA. Impact of ChatGPT on learning motivation: Teachers’ and students’ voices. J Engl Stud Arabia Felix. 2023;2(1):41-9.
- Song C, Song Y. Enhancing academic writing skills and motivation: Assessing the efficacy of ChatGPT in AI-assisted language learning for EFL students. Front Psychol. 2023;14:1260843.
- Khoso AK, et al. Integrating Sustainable Development Goals (SDGs) and generative AI to enhance language digital literacy and creativity in EFL learning environments. J Vis Exp. 2026;(228):e69445.
- Balcı Ö. The role of ChatGPT in English as a foreign language (EFL) learning and teaching: A systematic review. Int J Curr Educ Stud. 2024;3(1):66-82.
- Yamaoka K. ChatGPT’s motivational effects on Japanese university EFL learners: A qualitative analysis. Int J TESOL Stud. 2024;6(3).
- Afkarin MY, Asmara CH. Investigating the implementation of ChatGPT in English language education: Effects on student motivation and performance levels. Journey J Engl Lang Pedagogy. 2024;7(1):57-66.
- Alrabai F. The influence of teachers’ anxiety-reducing strategies on learners’ foreign language anxiety. Innov Lang Learn Teach. 2015;9(2):163-90.
- Kang S, Kim Y. Examining the quality of mobile-assisted video-making task outcomes: The role of proficiency, narrative ability, digital literacy, and motivation. Lang Teach Res. 2024;28(6):2326-53.
- Honggang W, Khoso AK, Althubyani AR. Technostress, digital fatigue, and AI dependency as antecedents of burnout and SDG-4 achievement in EFL classrooms. Sci Rep. 2026;16:15412.
- Sari AA, Ningsih SK. The influence of digital literacy in social media use on high school students’ intrinsic motivation in EFL learning. IDEAS J Engl Lang Teach Learn Linguist Lit. 2025;13(2):6634-51.
- Zhang Y. Impact of digital literacy on college students’ English proficiency: The mediating role of learning motivation and the moderating effect of technological self-efficacy. Acta Psychol (Amst). 2025;259:105452.
- Bender SM. Awareness of artificial intelligence as an essential digital literacy: ChatGPT and Gen-AI in the classroom. Changing Engl. 2024;31(2):161-74.
- Khoso AK, et al. The impact of ESL teachers’ emotional intelligence on ESL students’ academic engagement, reading and writing proficiency: Mediating role of ESL students’ motivation. Int J Early Child Spec Educ. 2022;14:3267-80.
- He M, Abbasi BN, He J. AI-driven language learning in higher education: An empirical study on self-reflection, creativity, anxiety, and emotional resilience in EFL learners. Humanit Soc Sci Commun. 2025;12(1):1-20.
- Wang HC. Exploring the relationships of achievement motivation and state anxiety to creative writing performance in English as a foreign language. Think Skills Creat. 2021;42:100948.
- Khan MA, Mahjabeen AN, Hussain F, Ur Rehman M. Investigating the correlation between writing anxiety and English creativity in Pakistani ESL students. Russ Law J. 2021;9(1):214-24.
- McDonough K, Crawford WJ, Mackey A. Creativity and EFL students’ language use during a group problem-solving task. TESOL Q. 2015;49(1):188-99.
- Rubino C, Luksyte A, Perry SJ, Volpone SD. How do stressors lead to burnout? The mediating role of motivation. J Occup Health Psychol. 2009;14(3):289-304.
- Halbesleben JRB, Bowler WM. Emotional exhaustion and job performance: The mediating role of motivation. J Appl Psychol. 2007;92(1):93-106.
- van Emmerik IJH, et al. The route to employability: Examining resources and the mediating role of motivation. Career Dev Int. 2012;17(2):104-19.
- Dana LP, et al. The impact of entrepreneurial education on technology-based enterprise development: The mediating role of motivation. Adm Sci (Basel). 2021;11(4):105.
- Kholifah N, Nurtanto M, Mutohhari F, et al. The mediating role of motivation and professional development in determining teacher performance in vocational schools. Cogent Educ. 2024;11(1):2421094.
- Güngör P. The relationship between reward management system and employee performance with the mediating role of motivation: A quantitative study on global banks. Procedia Soc Behav Sci. 2011;24:1510-20.
- Danish RQ, Khan MK, Shahid AU, et al. Effect of intrinsic rewards on task performance of employees: Mediating role of motivation. Int J Organ Leadersh. 2015;4:33-46.
- Mavhungu D, Bussin MH. The mediation role of motivation between leadership and public sector performance. SA J Hum Resour Manag. 2017;15(1):1-11.
- Faul F, Erdfelder E, Buchner A, Lang AG. Statistical power analyses using G*Power 3.1: Tests for correlation and regression analyses. Behav Res Methods. 2009;41(4):1149-60.
- Rodríguez-de-Dios I, Igartua JJ, González-Vázquez A. Development and validation of a digital literacy scale for teenagers. In: Proceedings of the Fourth International Conference on Technological Ecosystems for Enhancing Multiculturality; 2016. p. 1067-72.
- Abbas M, Jam FA, Khan TI. Is it harmful or helpful? Examining the causes and consequences of generative AI usage among university students. Int J Educ Technol High Educ. 2024;21(1):10.
- Grasha AF. Teaching with style: The integration of teaching and learning styles in the classroom. Alliance Publishers; Pittsburgh (PA); 1996.
- Briesmaster M, Briesmaster-Paredes J. The relationship between teaching styles and NNPSETs’ anxiety levels. System. 2015;49:145-56.
- Kanoksilapatham B, et al. Motivation of Thai university students from two disciplinary backgrounds using a hybrid questionnaire. LEARN J Lang Educ Acquis Res Netw. 2021;14(1):455-91.
- Govindasamy P, Cumming TM, Abdullah N. Validity and reliability of a needs analysis questionnaire for the development of a creativity module. J Res Spec Educ Needs. 2024;24(3):637-52.
- Hair JF, Risher JJ, Sarstedt M, Ringle CM. When to use and how to report the results of PLS-SEM. Eur Bus Rev. 2019;31(1):2-24.
- Zhang R, et al. Mediating effect of learning motivation and engagement on the relationship between generative artificial intelligence implementation and English as a foreign language proficiency. 2026. https://doi.org/10.21203/rs.3.rs-9075280/v1.
- Almira NF, Almira ZF, Vircavani C, Agustina E. A systematic review of teachers’ teaching styles and their impact on EFL student learning outcomes. J Appl Linguist Engl Educ. 2025;3(1):1-5.
- Reeve J. Teachers as facilitators: What autonomy-supportive teachers do and why their students benefit. Elem Sch J. 2006;106(3):225-36.
- Huang S, Dong L, Wang W, et al. Language is not all you need: Aligning perception with language models. In: Advances in Neural Information Processing Systems. 2023;36:72096-109.
- Liu L. An international graduate student’s ESL learning experience beyond the classroom. TESL Can J. 2011;29(1):77-92.
- van Laar E, van Deursen AJAM, van Dijk JAGM, De Haan J. The relation between 21st-century skills and digital skills: A systematic literature review. Comput Hum Behav. 2017;72:577-88.
- Al-Kahtani N. A survey assessing health science students’ perceptions of online learning at a Saudi higher education institution during the COVID-19 pandemic. Heliyon. 2022;8(9):e10688.
- Dewaele JM, Chen X, Padilla AM, Lake J. The flowering of positive psychology in foreign language teaching and acquisition research. Front Psychol. 2019;10:2128.
- Liu W, Li Y. A qualitative study of question-posing anxiety in Chinese postgraduates in UK TESOL programs. Sci Rep. 2025;16(1):2081.
Access restricted. Please log in or start a trial to view this content.