This protocol describes a modified Quick-Easy-Cheap-Effective-Rugged-Safe (QuEChERS) method with a magnesium silicate adsorbent-based dispersive solid-phase extraction cleanup for multiresidue determination of organophosphorus pesticides in agricultural soils by gas chromatography-tandem mass spectrometry, improving co-extractive removal, minimizing matrix-related analytical interference, and supporting reliable trace-level quantification.
Method Article
Modified QuEChERS for Organophosphorus Pesticide Analysis in Agricultural Soils by Gas Chromatography-Tandem Mass Spectrometry
In This Article
Summary
Abstract
Accurate determination of organophosphorus pesticide (OPP) residues in agricultural soils by gas chromatography-tandem mass spectrometry (GC-MS/MS) is often hindered by matrix-induced signal effects caused by co-extracted organic matter, humic substances, and mineral-associated interferents. Conventional Quick-Easy-Cheap-Effective-Rugged-Safe (QuEChERS) cleanup strategies may not sufficiently remove matrix components from complex soil extracts, compromising analytical performance. This study presents a modified QuEChERS protocol that incorporates the adsorbent into mixed-sorbent dispersive solid-phase extraction (dSPE) cleanup for the simultaneous determination of 12 OPPs in agricultural soils by GC-MS/MS. Seven dSPE sorbent combinations were evaluated across six agricultural soils with varying soil properties. Co-extractive removal was quantified gravimetrically, and the combination of primary-secondary amine, octadecylsilane, and a magnesium silicate adsorbent (50 mg each, with 150 mg anhydrous magnesium sulfate) achieved the highest average co-extractive removal (88%). Analyte protectants consisting of ethylglycerol, L-gulonic acid γ-lactone, D-sorbitol, and shikimic acid were incorporated into final extracts to minimize matrix effects, while matrix-matched calibration compensated for soil-specific signal variation. Chlorpyrifos-methyl-d10 and triphenyl phosphate were employed as procedural and injection internal standards, respectively. Matrix-matched calibration curves (5–600 µg/kg) demonstrated excellent linearity, with coefficients of determination ≥0.9933 for most analyte-soil combinations. The limit of detection (5 µg/kg) was used for linearity assessment, whereas the method limit of quantification was established at 50 µg/kg as the lowest validated level. Accuracy and precision assessed at three recovery levels (50, 200, and 400 µg/kg, n = 5 per level) demonstrated recoveries between 70% and 120% with relative standard deviations ≤20% for most analyte-soil combinations, meeting SANTE/2020/12830 (Rev.2) performance criteria. Lower recoveries were observed only for fenamiphos, pirimiphos-ethyl, and ethion in selected soil matrices. The results demonstrate that the magnesium silicate adsorbent improves dSPE cleanup by reducing co-extractives and that its combination with analyte protectants and matrix-matched calibration provides reliable multiresidue determination of OPPs in complex soil matrices by GC-MS/MS.
Introduction
Organophosphorus pesticides (OPPs) remain among the most widely used classes of agrochemicals worldwide because of the broad-spectrum efficacy and versatility of this pesticide class in crop protection1. Although many OPPs undergo environmental degradation more rapidly than organochlorine pesticides, widespread and recurrent application of these compounds results in continued presence in agricultural soils2. Soil acts as the primary environmental compartment receiving pesticide inputs and can serve as a temporary reservoir from which residues may be transferred to crops, surface waters, groundwater, and surrounding ecosystems3. The presence of OPP residues is of concern because these compounds have been associated with neurotoxic effects in humans through inhibition of acetylcholinesterase activity, as well as adverse impacts on non-target organisms, soil microbial communities, and ecosystem functioning2. The occurrence of OPP residues in agricultural soils may therefore contribute to biodiversity loss, ecological imbalance, and environmental exposure through food-chain and waterborne pathways3. Reliable determination of OPP residues is therefore essential for generating high-quality occurrence data, supporting environmental exposure assessments, and improving understanding of the environmental fate of OPPs under different agricultural conditions. Moreover, analytical methods developed and optimized using a single soil type may not necessarily provide equivalent performance when applied to soils with contrasting physicochemical characteristics4,5, highlighting the importance of evaluating method applicability across diverse agricultural environments. However, trace-level quantification remains challenging because agricultural soils exhibit substantial physicochemical variability, which influences extraction efficiency, matrix effects (MEs), and overall analytical performance6.
Gas chromatography-tandem mass spectrometry (GC-MS/MS) is widely recognized as a reference analytical technique for multiresidue determination of OPPs at trace levels in complex matrices7,8. Nevertheless, accurate quantification depends not only on instrumental performance but also on the effectiveness of sample preparation. Soil extracts commonly contain co-extracted matrix components that reach the chromatographic system together with the target analytes and may alter analyte response through signal suppression or enhancement4,5,6. The extent of these effects varies considerably among soils and is influenced by factors such as organic matter content, clay fraction, mineral composition, and pH. Consequently, MEs remain one of the principal sources of analytical uncertainty in GC-MS/MS-based pesticide determination and highlight the need for cleanup strategies capable of reducing co-extractive load while preserving analyte recovery5,9,10. Furthermore, the generation of reliable residue data requires compliance with internationally accepted analytical performance criteria to ensure method accuracy, comparability among studies, and suitability for environmental monitoring applications11.
The Quick-Easy-Cheap-Effective-Rugged-Safe (QuEChERS) method has become the most widely used sample preparation approach for multiresidue pesticide analysis because of its simplicity, low solvent consumption, and broad applicability across agricultural matrices4,12,13. Its modular and flexible design has enabled extensive adaptation across diverse sample types and analytical applications, contributing to its widespread adoption in contemporary multiresidue analysis and its frequent association with sustainable analytical chemistry because of its reduced solvent consumption and simplified sample preparation. This adaptability also allows the method to be tailored by selecting extraction and cleanup conditions based on specific matrix characteristics. In soil analysis, the effectiveness of the dispersive solid-phase extraction (dSPE) cleanup step is critical because insufficient removal of co-extracted matrix components can adversely affect the analytical performance of subsequent GC-MS/MS determination4,14. Conventional sorbent combinations based on primary-secondary amine (PSA) and octadecylsilane (C18) often provide limited removal of polar humic constituents, which are among the principal contributors to matrix-induced signal effects in agricultural soil extracts14. Florisil, a magnesium silicate adsorbent with affinity for compounds spanning a broad polarity range, has demonstrated promising cleanup performance in food and plant matrices15,16. However, its contribution to mixed-sorbent dSPE cleanup strategies for agricultural soils remains insufficiently characterized, particularly under soils exhibiting diverse physicochemical properties17,18,19,20,21.
This study presents a modified QuEChERS protocol in which seven dSPE sorbent combinations were evaluated across six agricultural soils with varying pH, organic matter content, and texture. The study was based on the hypothesis that incorporating the magnesium silicate adsorbent into mixed-sorbent dSPE cleanup would enhance the removal of co-extracted matrix components from agricultural soil extracts. Sorbent selection was based on gravimetric assessment of co-extractive removal, and the combination providing the highest average cleanup efficiency was subsequently subjected to full analytical validation. The optimized procedure was validated for the simultaneous determination of 12 OPPs using internal standardization, matrix-matched calibration, and GC-MS/MS. In addition, analyte protectants (ethylglycerol, L-gulonic acid γ-lactone, D-sorbitol, and shikimic acid) were incorporated into the final protocol as a complementary strategy to minimize residual matrix-induced signal effects. By integrating systematic cleanup optimization with comprehensive analytical validation across soils with contrasting physicochemical properties, this protocol provides a robust and reproducible workflow that may facilitate pesticide residue determination in heterogeneous agricultural soils.
Protocol
The source data underlying the experimental optimization of the dSPE cleanup procedure, the matrix effect dataset, and the physicochemical characterization of the six agricultural soils have been deposited in Zenodo and are publicly available at DOI: 10.5281/zenodo.21644870. The details of the reagents and the equipment used are listed in the Table of Materials.
1. Soil sampling and preparation
NOTE: To ensure personal safety, wearing a lab coat, protective eyewear, and nitrile gloves is recommended throughout this protocol.
- Collect a bulk composite soil sample from the upper layer (0–10 cm) at each selected agricultural location by combining 8 individual subsamples gathered via a square-grid systematic sampling design22.
NOTE: The 8-point square-grid design aligns with New South Wales Environment Protection Authority (NSW EPA) recommendations for sites of approximately 1000 m2 (0.1 ha)22. - Combine and thoroughly mix these subsamples in the field to yield a single representative bulk sample (≥500 g) per location, establishing a homogenized matrix baseline for method performance evaluation.
NOTE: Composite sampling is utilized here solely to standardize matrix background effects for method optimization and validation. Under regulatory frameworks for unknown or real-world contaminated land assessments, composite sampling is strictly restricted by the NSW EPA due to chemical dilution risks22. For actual site characterization or hotspot detection, samples from the grid nodes must be kept discrete and analyzed individually to prevent false negatives and preserve spatial variance data. - Transport soil samples to the laboratory in airtight amber glass containers under dark conditions.
NOTE: Glass containers are preferred over polyethylene bags to minimize adsorption losses of hydrophobic or semi-volatile OPPs onto plastic surfaces and to reduce the risk of contaminant leaching or polymer-analyte interactions. Dark conditions minimize photodegradation of light-sensitive compounds during transport. - Air-dry samples at ambient temperature in the absence of direct light until constant weight is achieved.
NOTE: Air-drying is applied to standardize soil moisture content and ensure results are reported on a dry-weight basis, improving comparability across samples with different natural water contents. Forced oven drying is avoided to prevent potential losses of thermally labile or semi-volatile OPPs and alterations in soil organic matter structure and sorption properties. - Manually break soil aggregates and sieve through a 2 mm stainless steel mesh. Store homogenized soils in airtight amber glass containers under dark and refrigerated conditions at 4 °C until extraction.
NOTE: Physicochemical characteristics of the six soils used in this study were available from previous routine soil analyses. These data were used solely to select agricultural soils covering a broad range of pH (soil:H2O, 1:2)23, organic matter content (Walkey Black method)24, and texture (Bouyoucos method)25 for method evaluation.
2. Preparation of reagents, standards, and internal standard solutions
NOTE: Unless otherwise specified, individual pesticide stock solutions, mixed working standard solutions, procedural internal standard (P-IS) and injection internal standard (I-IS) solutions, recovery solutions, and calibration standard solutions are prepared in 10 mL volumetric flasks, transferred to amber glass vials, and stored at −20 °C until use. Matrix-matched calibration, analyte protectants, the P-IS, and the I-IS were incorporated because each addresses a different source of analytical variability, thereby improving the robustness of quantitative analysis in complex soil matrices.
- Prepare individual stock solutions of each of the 12 commercial OPP standards (see Table of Materials) at 1000 mg/L in toluene.
- Combine appropriate volumes of the individual stock solutions to prepare a mixed working standard solution in acetonitrile (ACN) at 400 mg/L.
NOTE: This mixed working standard solution is subsequently used for the preparation of recovery and calibration solutions. - Prepare chlorpyrifos-methyl-d10 as a P-IS in ACN at 750 mg/L. Add during extraction (step 3.2) to monitor and correct procedural variability.
NOTE: Chlorpyrifos-methyl-d10 was selected as the P-IS because, as an isotopically labelled OPP, it exhibits physicochemical behavior similar to that of the target analytes while remaining readily distinguishable by MS/MS. - Prepare triphenyl phosphate as an I-IS in ACN at 1050 mg/L. Add immediately prior to instrumental analysis (step 4.2.4) to correct for injection variability.
- Prepare stock recovery solutions in ACN acidified with 0.05% (v/v) formic acid to provide final soil-equivalent concentrations of 50 µg/kg, 200 µg/kg, and 400 µg/kg for the OPPs when 300 µL is added to 5 g of black soil prior to extraction. Prepare a separate P-IS solution corresponding to a 200 µg/kg sample equivalent.
NOTE: Acidification with formic acid improves the stability of OPPs during storage. - Prepare calibration solutions containing the 12 OPPs and chlorpyrifos-methyl-d10 in ACN with 0.05% (v/v) formic acid corresponding to final soil-equivalent concentrations of 5, 10, 25, 75, 200, 400, and 600 µg/kg for the analytes and 200 µg/kg for the P-IS.
NOTE: These solutions are subsequently used for the preparation of matrix-matched calibration curves for each soil matrix, which were fitted by unweighted linear regression. The limit of detection (LOD) and limit of quantification (LOQ) were defined according to the SANTE/2020/12830 (Rev.2) guidance document. The LOD was considered the lowest calibration level in the matrix, whereas the LOQ corresponded to the lowest validated concentration level, demonstrating acceptable recovery and precision. - Prepare an analyte protectant mixture consisting of ethylglycerol (100 g/L), L-gulonic acid γ-lactone (10 g/L), D-sorbitol (10 g/L), and shikimic acid (5 g/L) in ACN:water (1:1, v/v) acidified with 0.1% formic acid. Store at −20 °C. Add immediately prior to instrumental analysis (step 4.2.4) for ME mitigation.
3. QuEChERS extraction
- Weigh 5.00 g ± 0.01 g of air-dried and sieved soil into a 50 mL polypropylene centrifuge tube.
- For recovery experiments, add the P-IS solution (prepared in step 2.3) and the appropriate recovery solution (prepared in step 2.5) to obtain final concentrations of 200 µg/kg for chlorpyrifos-methyl-d10 and 50, 200, or 400 µg/kg for the target OPPs (n = 5 per recovery level for each soil).
NOTE: For recovery experiments, both the P-IS and pesticide recovery solutions are added before extraction as described in step 3.2. For routine analysis of soil samples, only the P-IS is added prior to extraction to compensate for procedural variability during sample preparation and analysis. For preparation of matrix-matched calibration extracts, neither the P-IS nor pesticide standards are added during extraction; blank soil extracts are prepared, and calibration standards containing both analytes and P-IS (prepared in step 2.6) are added after cleanup (see step 4.2.4). - Vortex for 30 s and allow the fortified samples to equilibrate for 10 min at room temperature.
NOTE: The equilibration period promotes interaction between the fortified analytes and the soil matrix before extraction, improving the representativeness of recovery experiments. - Add 10 mL of deionized water and shake manually for 30 s to ensure complete wetting of the soil matrix.
NOTE: Rehydration improves analyte desorption from soil particles and facilitates efficient partitioning during extraction. - Add 10 mL of ACN containing 1% (v/v) acetic acid. Immediately cap the tube and shake vigorously for 2 min.
- Add 6.0 g of anhydrous magnesium sulfate (MgSO4) and 1.5 g of sodium acetate, and immediately shake the tube vigorously for 1 min.
NOTE: Prompt agitation after salt addition is essential to ensure efficient phase partitioning and prevent the formation of salt aggregates. - Centrifuge at 1800 × g for 5 min.
- Transfer the upper ACN phase to a clean tube for subsequent dSPE cleanup.
4. Dispersive solid-phase extraction cleanup
NOTE: This section consists of two approaches. First, seven dSPE sorbent combinations were evaluated to identify the cleanup composition providing the highest average co-extractive removal across six agricultural soils. Subsequently, the selected sorbent combination was applied as the optimized cleanup procedure for method validation according to the European Commission Directorate-General for Health and Food Safety (DG SANTE) Guidance Document SANTE/2020/12830 (Rev.2)11.
- Optimization of dSPE sorbent combinations
NOTE: Gravimetric co-extractive removal was selected as the optimization criterion because it provides an analyte-independent measure of cleanup efficiency. The sorbent amounts evaluated correspond to the conventional proportions widely employed in QuEChERS-based dSPE procedures, thereby facilitating adoption of the proposed protocol in routine analytical laboratories.- Prepare 2 mL microcentrifuge tubes containing the following sorbent combinations: (i) 150 mg anhydrous MgSO4 + 50 mg PSA; (ii) 150 mg anhydrous MgSO4 + 50 mg C18; (iii) 150 mg anhydrous MgSO4 + 50 mg magnesium silicate adsorbent; (iv) 150 mg anhydrous MgSO4 + 50 mg PSA + 50 mg C18; (v) 150 mg anhydrous MgSO4 + 50 mg PSA + 50 mg magnesium silicate adsorbent; (vi) 150 mg anhydrous MgSO4 + 50 mg C18 + 50 mg magnesium silicate adsorbent; (vii) 150 mg anhydrous MgSO4 + 50 mg PSA + 50 mg C18 + 50 mg magnesium silicate adsorbent.
- Transfer 1.0 mL aliquots of the extract obtained in step 3.8 into each dSPE tube.
NOTE: Perform all sorbent evaluations in triplicate for each soil. Aliquots used for comparison should originate from the same extract to ensure that differences in co-extractive removal are attributable exclusively to the cleanup composition. - Vortex for 1 min and centrifuge at 1800 × g for 5 min.
- Transfer 1.0 mL of each cleaned extract into a previously dried and weighed glass test tube. Evaporate the solvent to dryness under a gentle nitrogen stream at 40 °C.
- Allow the test tube to cool in a desiccator to room temperature and determine the mass of the remaining residue. Calculate the mass of co-extractives by subtracting the initial weight of the empty test tube from the final weight after solvent evaporation.
- Determine the amount of co-extractives present in extracts without dSPE cleanup by evaporating equivalent aliquots of untreated extract under identical conditions.
- Calculate co-extractive removal according to Equation 126:

- Calculate the mean co-extractive removal from triplicate determinations for each sorbent combination and soil. Then, calculate the average removal across the six agricultural soils for each sorbent combination.
- Evaluate differences among sorbent combinations using analysis of variance (ANOVA) under a randomized complete block design (RCBD), considering sorbent combination as the treatment factor and soil matrix as the blocking factor. Prior to ANOVA, assess residual normality and homogeneity of variances using the Shapiro-Wilk and Levene tests, respectively. Perform pairwise comparisons using Tukey´s HSD test at a significance level of α = 0.05.
- Select the cleanup composition based on the combined evaluation of the statistical analysis and the overall mean co-extractive removal.
NOTE: Reducing the co-extractive load minimizes the introduction of matrix components into the chromatographic system, thereby improving chromatographic performance, reducing contamination of the GC-MS/MS system, and lowering instrument maintenance requirements.
NOTE: The combination containing PSA, C18, and the magnesium silicate adsorbent (50 mg each, with anhydrous 150 mg MgSO4) achieved the highest average co-extractive removal and was therefore selected as the optimized cleanup procedure for all subsequent analyses.
- Application of the optimized dSPE cleanup procedure
- Transfer 1.0 mL of the extract obtained in step 3.8 into a 2 mL microcentrifuge tube containing 150 mg anhydrous MgSO4, 50 mg PSA, 50 mg C18, and 50 mg magnesium silicate adsorbent.
- Vortex for 1 min to ensure complete interaction between the extract and sorbents.
- Centrifuge at 1800 × g for 5 min.
- Transfer 200 µL of the cleaned supernatant to an autosampler vial and add 20 µL of the analyte protectant mixture prepared in step 2.7 and 50 µL of the triphenyl phosphate solution prepared in step 2.4. Mix thoroughly before instrumental analysis.
NOTE: For matrix-matched calibration, prepare blank extracts from each soil following the extraction and cleanup procedures described in steps 3 and 4.2, without addition of pesticides or the P-IS. After cleanup, transfer 200 µL of the cleaned blank extract to seven separate autosampler vials and add the calibration solutions prepared in step 2.6 to obtain final concentrations of 5, 10, 25, 75, 200, 400, and 600 µg/kg for the analytes and 200 µg/kg for the P-IS. Add 20 µL of the analyte protectant mixture and 50 µL of the triphenyl phosphate to each vial as described in step 4.2.4, resulting in a final vial volume of 270 µL. Construct independent matrix-matched calibration curves for each soil matrix. Soil-equivalent concentrations are based on the 200 µL aliquot of cleaned extract, which represents the extract obtained from the original 5 g soil sample. The subsequent addition of analyte protectants and the I-IS increases the final vial volume but does not modify the amount of soil represented by the extract aliquot. For solvent-based calibration, replace the 200 µL aliquot of cleaned soil extract with 200 µL of ACN and prepare calibration vials using the same analyte concentrations, P-IS concentration, I-IS concentration, and analyte protectant mixture employed for matrix-matched calibration. These solvent-based calibration curves are subsequently used for ME evaluation. - Perform instrumental analysis using a GC-MS/MS system.
5. GC-MS/MS analysis and data acquisition
NOTE: Detailed descriptions of the GC-MS/MS configuration and data acquisition procedures are available in Varela-Martínez et al.27. The principal chromatographic and mass spectrometric parameters are summarized below.
- Use a GC-MS/MS system equipped with a triple quadrupole mass spectrometer, an electron ionization (EI) source operated at −70 eV, and an autosampler.
- Install a low-polarity fused silica capillary column (30 m × 0.25 mm i.d. × 0.25 µm film thickness) and use helium as carrier gas at a constant flow rate of 1.2 mL/min.
- Prior to analysis, verify instrument readiness, including carrier gas supply, vacuum system performance, syringe condition, and autosampler wash solvent levels. Perform instrument tuning according to the manufacturer´s recommendations.
NOTE: Verify that the operating vacuum meets the specifications recommended by the instrument manufacturer before initiating any analytical sequence. - Set the GC oven temperature program as follows: initial temperature of 50 °C for 1 min; increase to 180 °C at 25 °C/min; then to 230 °C at 5 °C/min; and finally to 290 °C at 25 °C/min. Maintain the final temperature for 6 min. The total run time is 24.6 min.
- Set the injection port temperature to 250 °C and perform 1 µL injections in splitless mode. Open the split vent 1 min after injection.
NOTE: To minimize carryover, rinse the autosampler syringe sequentially with methanol, ethyl acetate, and ACN between injections. - Set the MS transfer line temperature to 250 °C and the ion source temperature to 300 °C.
- Acquire data in multiple reaction monitoring (MRM) mode using the precursor-product ion transitions listed in Table 1.
- Quantify analytes using matrix-matched calibration curves prepared for each soil matrix. Calculate analyte concentrations from the ratio between the analyte peak area and the peak area of chlorpyrifos-methyl-d10.
- Use triphenyl phosphate as the I-IS to verify injection consistency throughout the analytical sequence.
- Calculate MEs according to Equation 228:
![Matrix effect formula, ME(%)=[Slope_matrix/Slope_solvent-1]x100, analytical chemistry formula.](/files/ftp_upload/72745/72745eq2.jpg "figure-protocol-2")
where negative values indicate signal suppression and positive values indicate signal enhancement.
NOTE: A schematic overview of the complete analytical workflow is presented in Figure 1.
Results
The six agricultural soils selected for method evaluation represented a broad range of soil properties (see Table 2), including pH (soil:H2O, 1:2) values ranging from 4.67 to 7.31, organic matter contents from 0.18% to 6.46%, and clay fractions from 22.9% to 48.5%. Five soils originated from agricultural regions of Colombia and one from Spain. This diversity was intentionally incorporated to evaluate the robustness of the proposed cleanup procedure across contrasting soil matrices, given that soil properties such as pH, organic matter content, and texture are known to influence co-extraction, MEs, and analyte recovery during pesticide residue analysis.
Seven dSPE sorbent combinations were evaluated using gravimetric determination of co-extractive removal (see Figure 2). Among the individual sorbents, Florisil achieved the highest average co-extractive removal (71%), followed by PSA (58%) and C18 (41%). The magnesium silicate adsorbent reached complete co-extractive removal in S2 (100%) and showed values above 90% in S3 (91%) and S4 (91%). In contrast, PSA exhibited greater variability among soils, with removal efficiencies ranging from 21% in S4 to complete removal in S6. C18 exhibited the lowest and most variable performance, ranging from 0% in S1 and S2 to 93% in S4. Among the mixed-sorbent combinations, PSA+Adsorbent achieved an average co-extractive removal of 80%. The combinations PSA+Adsorbent and C18+Adsorbent resulted in lower average removals of 73% and 74%, respectively. Incorporation of the magnesium silicate adsorbent into the PSA+C18 mixture further increased the average removal to 88%, representing the highest value obtained among all evaluated cleanup configurations. The PSA+C18+Adsorbent combination achieved removal values above 80% in five of the six soils and reached complete co-extractive removal in S2 and S6. Statistical analysis using an ANOVA under an RCBD revealed a significant effect of sorbent combination on co-extractive removal (p = 0.0432). Statistical groupings obtained using Tukey´s HSD test are presented in Figure 2.
Method selectivity was demonstrated by the absence of interfering chromatographic peaks at the expected retention times of the target analytes. Matrix-matched calibration curves were constructed for each analyte and soil matrix over the concentration range of 5–600 µg/kg, with a LOD of 5 µg/kg (see Table 3). No interfering peaks were observed at the retention times corresponding to the target analytes. Excellent linearity was obtained for the vast majority of analyte-soil combinations. Only three calibration curves exhibited coefficients of determination (R2) below 0.9933, all corresponding to fenamiphos, in S1 (R2 = 0.9888), S3 (R2 = 0.9606), and the solvent-based calibration (R2 = 0.9871). Regarding MEs, based on the average values across the six soils (see Figure 3), signal suppression (ME < 0) was observed for 10 of the 12 target OPPs, whereas signal enhancement (ME > 0) was observed only for malathion (+3%) and fenamiphos (+25%). Most analytes exhibited soft MEs, with average ME values ranging from −25% for methidathion and −23% for parathion-methyl to −5% for ethion. Fenamiphos showed the highest average enhancement (+25%), whereas malathion exhibited only a slight enhancement (+3%). At the individual soil level, the strongest signal suppression was observed for pirimiphos-ethyl in S5 (−60%) and parathion-methyl in S1 (−44%). In contrast, fenamiphos exhibited signal enhancement in five of the six soils, reaching a maximum ME value of +58% in S2, while malathion showed enhancement in four soils, with a maximum value of +16% in S4.
Recovery and precision results obtained at the three fortification levels are summarized in Table 4. The lowest fortification level corresponded to the target method LOQ of 50 µg/kg. Most analyte-soil combinations met the SANTE/2020/12830 (Rev.2) performance criteria11, with mean recoveries between 70% and 120% and relative standard deviations (RSDs) ≤ 20%. Fenamiphos exhibited recoveries below 70% in S1, S2, and S4. Pirimiphos-ethyl exhibited recoveries below 70% in S1 and S6, while ethion showed recoveries below 70% in S1. For the remaining analytes, recoveries generally fell within the acceptable range across all soils and fortification levels. RSD values remained below the 20% acceptance criterion in most cases, demonstrating satisfactory method precision over the evaluated concentration range.
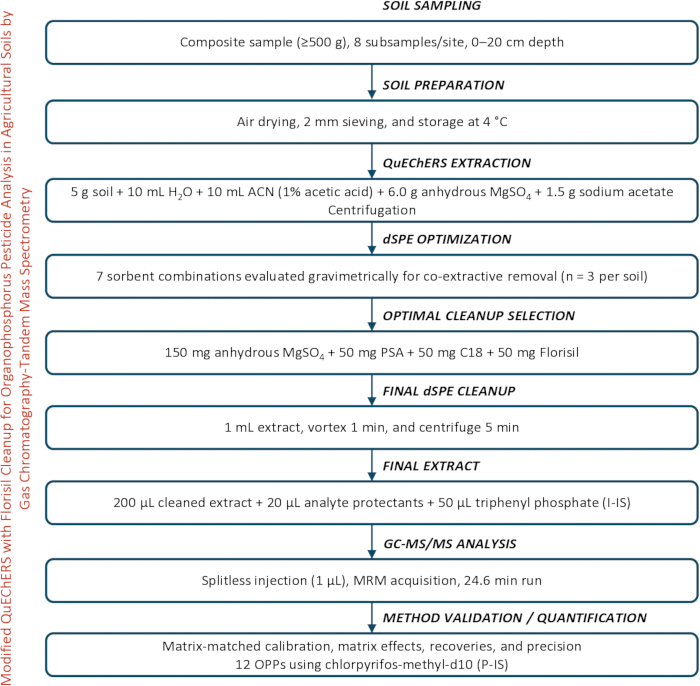
Figure 1: Schematic workflow for the determination of OPPs in agricultural soils using QuEChERS extraction, optimized dSPE cleanup, and GC-MS/MS analysis. Composite soil samples were processed (homogenized, air-dried, and sieved) prior to QuEChERS extraction using acidified ACN and salting-out partitioning. Seven dSPE sorbent combinations were evaluated gravimetrically to optimize cleanup, and the selected mixture (150 mg MgSO4 + 50 mg PSA + 50 mg C18 + 50 mg magnesium silicate adsorbent) was used for method validation. Final extracts were analyzed by GC-MS/MS using analyte protectants and I-IS. Method performance for 12 OPPs was assessed in terms of matrix-matched calibration, MEs, recoveries, and precision using P-IS. Abbreviations: QuEChERS = Quick-Easy-Cheap-Effective-Rugged-Safe; ACN = acetonitrile; PSA = primary-secondary amine; C18 = octadecylsilane; dSPE = dispersive solid-phase extraction; I-IS = injection internal standard; GC-MS/MS = gas chromatography-tandem mass spectrometry; MRM = multiple reaction monitoring; OPPs = organophosphorus pesticides; P-IS = procedural internal standard. Please click here to view a larger version of this figure.
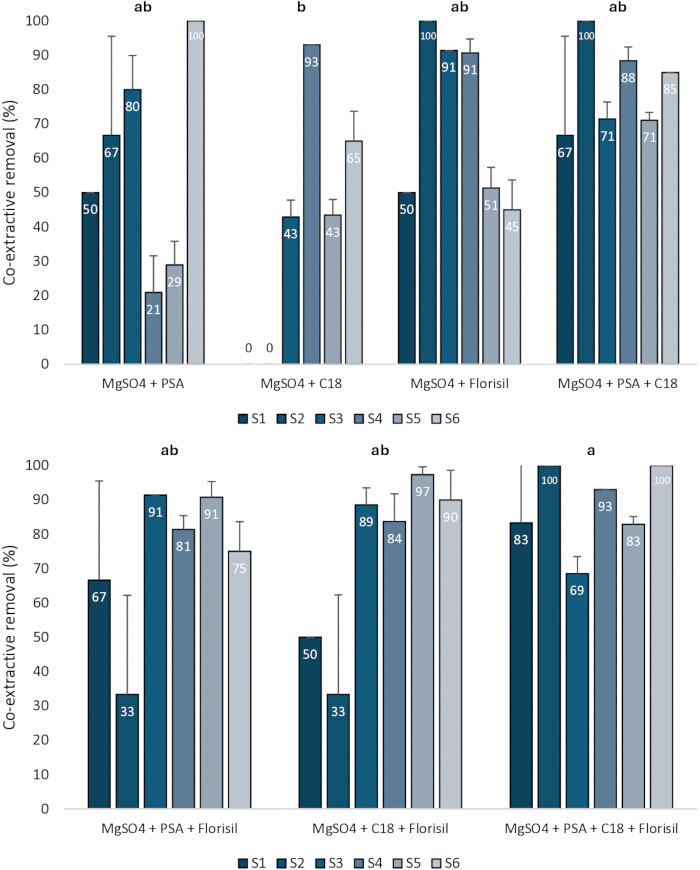
Figure 2: Co-extractive removal achieved by seven dSPE sorbent combinations across six agricultural soils (S1–S6). Co-extractive removal was determined gravimetrically after QuEChERS extraction and dSPE cleanup. Seven sorbent combinations were evaluated: PSA, C18, magnesium silicate adsorbent, PSA+C18, PSA+Adsorbent, C18+Adsorbent, and PSA+C18+Adsorbent (50 mg each, with 150 mg anhydrous MgSO4). Removal percentages were calculated relative to untreated extracts according to Equation 1. Values represent the mean of triplicate determinations for each soil matrix, and error bars indicate the standard deviation. S1: Villavicencio (Meta, Colombia); S2: Sabana Bogotá (Cundinamarca, Colombia); S3: Floresta (Boyacá, Colombia); S4: Guasca (Cundinamarca, Colombia); S5: Santa Rosa de Viterbo (Boyacá, Colombia); S6: La Laguna (Canarias, España). Different lowercase letters above each sorbent combination indicate statistically significant differences among the treatment means according to ANOVA under an RCBD followed by Tukey´s HSD test (p < 0.05). Statistical comparisons were performed using the treatment means across the six soil matrices. Abbreviations: PSA = primary-secondary amine; C18 = octadecylsilane. Please click here to view a larger version of this figure.
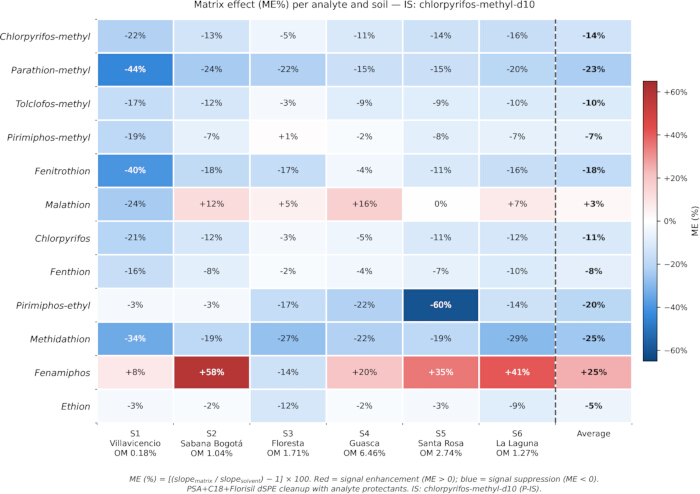
Figure 3: Heatmap of matrix effects (ME%) for 12 OPPs across six soil matrices (S1–S6). ME was calculated as the relative difference between matrix and solvent calibration slopes, according to Equation 2. Positive values indicate signal enhancement (red), whereas negative values indicate signal suppression (blue). Abbreviations: OPPs = organophosphorus pesticides; IS = internal standard; OM = organic matter. Please click here to view a larger version of this figure.
| Analyte | tR (min) | Quantifier (m/z) | CE (V) | Qualifier 1 (m/z) | CE (V) | Qualifier 2 (m/z) | CE (V) | ||
| Chlorpyrifos-methyl | 11.720 | 288 286 286 | 5 | 28693 | 25 | 286125 | 25 | ||
| Parathion-methyl | 11.868 | 263109 | 15 | 10979 | 10 | 263125 | 10 | ||
| Tolclofos-methyl | 11.915 | 265250 | 15 | 267265 | 5 | 265125 | 5 | ||
| Pirimiphos-methyl | 12.431 | 290233 | 10 | 305290 | 10 | 290276 | 10 | ||
| Fenitrothion | 12.526 | 277260 | 5 | 277109 | 20 | 125109 | 15 | ||
| Malathion | 12.727 | 12799 | 5 | 173127 | 5 | 12593 | 5 | ||
| Chlorpyrifos | 12.976 | 314258 | 15 | 199171 | 15 | 19797 | 15 | ||
| Fenthion | 13.083 | 278109 | 20 | 278169 | 20 | 278245 | 10 | ||
| Pirimiphos-ethyl | 13.571 | 333168 | 25 | 333318 | 10 | 318180 | 10 | ||
| Methidathion | 14.856 | 14585 | 10 | 14558 | 15 | 14593 | 10 | ||
| Fenamiphos | 15.519 | 303288 | 10 | 303154 | 20 | 303217 | 10 | ||
| Ethion | 16.148 | 153125 | 10 | 153125 | 5 | 231153 | 5 | ||
| Chlorpyrifos-methyl-d10 (P-IS) | 12.862 | 324260 | 25 | 324195 | 25 | 324292 | 10 | ||
| Triphenyl phosphate (I-IS) | 18.187 | 326325 | 5 | 326169 | 25 | 326215 | 25 | ||
Table 1: Retention times, quantifier transitions, qualifier transitions, and collision energies in GC-MS/MS analyses for the 12 target OPPs, chlorpyrifos-methyl-d10 (P-IS), and triphenyl phosphate (I-IS). Abbreviations: GC-MS/MS = gas chromatography-tandem mass spectrometry; OPPs = organophosphorus pesticides; P-IS = procedural internal standard; I-IS = injection internal standard; tR = retention time; CE (V) = collision energy (volts); m/z = mass-to-charge ratio. Please click here to download this Table.
| Soil | Origin | pH soil:H2O (1:2) | Organic matter (%) | Clay (%) | Textural class |
| S1 | Villavicencio (Meta, Colombia) | 5.51 | 0.18 | 48.5 | Clay |
| S2 | Sabana Bogotá (Cundinamarca, Colombia) | 4.67 | 1.04 | 37.4 | Clay loam |
| S3 | Floresta (Boyacá, Colombia) | 5.53 | 1.71 | 28.2 | Clay loam |
| S4 | Guasca (Cundinamarca, Colombia) | 4.89 | 6.46 | 22.9 | Sandy clay loam |
| S5 | Santa Rosa de Viterbo (Boyacá, Colombia) | 4.76 | 2.74 | 27.5 | Sandy clay loam |
| S6 | La Laguna (Canarias, España) | 7.31 | 1.27 | 39.6 | Clay loam |
Table 2: Origin and physicochemical properties of the six agricultural soils (S1–S6) used for method evaluation. Data include pH (soil:H2O, 1:2), organic matter content (Walkley–Black method), clay fraction (Bouyoucos method), and textural class. The diverse soils were selected to ensure a wide range of physicochemical conditions for method assessment. Please click here to download this Table.
| Analyte | Sample | Range (µg/kg) | b ± sb·t(0.05;7) | a ± sa·t(0.05;7) | sy/x | R² | ME (%) | ||
| Chlorpyrifos-methyl | Soil 1 | 5–600 | 1.50·10⁻² ± 1.75·10⁻⁴ | 2.39·10⁻² ± 5.02·10⁻² | 3.61·10⁻² | 0.9999 | -22 | ||
| Soil 2 | 5–600 | 1.68·10⁻² ± 3.21·10⁻⁴ | 8.31·10⁻³ ± 9.20·10⁻² | 6.62·10⁻² | 0.9997 | -13 | |||
| Soil 3 | 5–600 | 1.83·10⁻² ± 5.62·10⁻⁴ | −6.60·10⁻² ± 1.61·10⁻¹ | 1.26·10⁻¹ | 0.9991 | -5 | |||
| Soil 4 | 5–600 | 1.72·10⁻² ± 1.59·10⁻⁴ | −2.40·10⁻² ± 4.56·10⁻² | 3.54·10⁻² | 0.9999 | -11 | |||
| Soil 5 | 5–600 | 1.66·10⁻² ± 9.51·10⁻⁴ | −6.65·10⁻² ± 2.71·10⁻¹ | 2.09·10⁻¹ | 0.9975 | -14 | |||
| Soil 6 | 5–600 | 1.62·10⁻² ± 2.28·10⁻⁴ | 1.15·10⁻² ± 6.52·10⁻² | 4.99·10⁻² | 0.9998 | -16 | |||
| Solvent | 5–600 | 1.93·10⁻² ± 1.19·10⁻³ | −1.23·10⁻¹ ± 3.41·10⁻¹ | 2.46·10⁻¹ | 0.9971 | — | |||
| Parathion-methyl | Soil 1 | 5–600 | 3.80·10⁻³ ± 1.42·10⁻⁴ | −3.10·10⁻² ± 4.05·10⁻² | 2.92·10⁻² | 0.9989 | -44 | ||
| Soil 2 | 5–600 | 5.16·10⁻³ ± 1.70·10⁻⁴ | −3.24·10⁻² ± 4.86·10⁻² | 3.50·10⁻² | 0.9992 | -24 | |||
| Soil 3 | 5–600 | 5.27·10⁻³ ± 1.76·10⁻⁴ | −1.93·10⁻² ± 5.02·10⁻² | 3.93·10⁻² | 0.9990 | -22 | |||
| Soil 4 | 5–600 | 5.77·10⁻³ ± 1.00·10⁻⁴ | −3.06·10⁻² ± 2.87·10⁻² | 2.23·10⁻² | 0.9997 | -15 | |||
| Soil 5 | 5–600 | 5.80·10⁻³ ± 3.16·10⁻⁴ | −5.68·10⁻² ± 9.00·10⁻² | 6.96·10⁻² | 0.9978 | -15 | |||
| Soil 6 | 5–600 | 5.45·10⁻³ ± 1.46·10⁻⁴ | −2.40·10⁻² ± 4.18·10⁻² | 3.20·10⁻² | 0.9994 | -20 | |||
| Solvent | 5–600 | 6.80·10⁻³ ± 4.74·10⁻⁴ | −7.73·10⁻² ± 1.36·10⁻¹ | 9.76·10⁻² | 0.9963 | — | |||
| Tolclofos-methyl | Soil 1 | 5–600 | 1.78·10⁻² ± 2.78·10⁻⁴ | −4.35·10⁻⁴ ± 7.94·10⁻² | 5.72·10⁻² | 0.9998 | -17 | ||
| Soil 2 | 5–600 | 1.90·10⁻² ± 2.25·10⁻⁴ | 1.40·10⁻² ± 6.44·10⁻² | 4.64·10⁻² | 0.9999 | -12 | |||
| Soil 3 | 5–600 | 2.10·10⁻² ± 2.15·10⁻⁴ | −4.10·10⁻³ ± 6.15·10⁻² | 4.81·10⁻² | 0.9999 | -3 | |||
| Soil 4 | 5–600 | 1.97·10⁻² ± 3.08·10⁻⁴ | 3.68·10⁻² ± 8.82·10⁻² | 6.85·10⁻² | 0.9998 | -9 | |||
| Soil 5 | 5–600 | 1.97·10⁻² ± 1.01·10⁻³ | −1.08·10⁻¹ ± 2.88·10⁻¹ | 2.23·10⁻¹ | 0.9980 | -9 | |||
| Soil 6 | 5–600 | 1.95·10⁻² ± 1.68·10⁻⁴ | 7.35·10⁻³ ± 4.80·10⁻² | 3.67·10⁻² | 0.9999 | -10 | |||
| Solvent | 5–600 | 2.16·10⁻² ± 9.90·10⁻⁴ | −9.16·10⁻² ± 2.83·10⁻¹ | 2.04·10⁻¹ | 0.9984 | — | |||
| Pirimiphos-methyl | Soil 1 | 5–600 | 6.48·10⁻³ ± 1.09·10⁻⁴ | −3.28·10⁻² ± 3.11·10⁻² | 2.24·10⁻² | 0.9998 | -19 | ||
| Soil 2 | 5–600 | 7.41·10⁻³ ± 6.28·10⁻⁵ | −2.13·10⁻² ± 1.80·10⁻² | 1.30·10⁻² | 0.9999 | -7 | |||
| Soil 3 | 5–600 | 8.00·10⁻³ ± 1.29·10⁻⁴ | −1.76·10⁻² ± 3.68·10⁻² | 2.88·10⁻² | 0.9998 | 1 | |||
| Soil 4 | 5–600 | 7.80·10⁻³ ± 1.52·10⁻⁴ | −5.27·10⁻³ ± 4.36·10⁻² | 3.38·10⁻² | 0.9997 | -2 | |||
| Soil 5 | 5–600 | 7.33·10⁻³ ± 3.71·10⁻⁴ | −6.17·10⁻² ± 1.06·10⁻¹ | 8.16·10⁻² | 0.9981 | -8 | |||
| Soil 6 | 5–600 | 7.42·10⁻³ ± 8.58·10⁻⁵ | −2.18·10⁻² ± 2.46·10⁻² | 1.88·10⁻² | 0.9999 | -7 | |||
| Solvent | 5–600 | 7.96·10⁻³ ± 4.79·10⁻⁴ | −6.77·10⁻² ± 1.37·10⁻¹ | 9.88·10⁻² | 0.9972 | — | |||
| Fenitrothion | Soil 1 | 5–600 | 4.65·10⁻³ ± 2.84·10⁻⁴ | −4.91·10⁻² ± 8.12·10⁻² | 5.85·10⁻² | 0.9971 | -40 | ||
| Soil 2 | 5–600 | 6.34·10⁻³ ± 2.12·10⁻⁴ | −5.64·10⁻² ± 6.06·10⁻² | 4.36·10⁻² | 0.9991 | -18 | |||
| Soil 3 | 5–600 | 6.43·10⁻³ ± 2.20·10⁻⁴ | −2.81·10⁻² ± 6.31·10⁻² | 4.94·10⁻² | 0.9989 | -17 | |||
| Soil 4 | 5–600 | 7.41·10⁻³ ± 1.83·10⁻⁴ | −5.38·10⁻² ± 5.23·10⁻² | 4.07·10⁻² | 0.9995 | -4 | |||
| Soil 5 | 5–600 | 6.84·10⁻³ ± 4.22·10⁻⁴ | −8.07·10⁻² ± 1.20·10⁻¹ | 9.28·10⁻² | 0.9971 | -11 | |||
| Soil 6 | 5–600 | 6.50·10⁻³ ± 1.48·10⁻⁴ | −5.02·10⁻² ± 4.24·10⁻² | 3.25·10⁻² | 0.9995 | -16 | |||
| Solvent | 5–600 | 7.71·10⁻³ ± 7.02·10⁻⁴ | −1.06·10⁻¹ ± 2.01·10⁻¹ | 1.45·10⁻¹ | 0.9937 | — | |||
| Malathion | Soil 1 | 5–600 | 1.20·10⁻² ± 4.06·10⁻⁴ | −4.45·10⁻² ± 1.16·10⁻¹ | 8.37·10⁻² | 0.9991 | -24 | ||
| Soil 2 | 5–600 | 1.78·10⁻² ± 2.03·10⁻⁴ | −4.55·10⁻² ± 5.81·10⁻² | 4.19·10⁻² | 0.9999 | 12 | |||
| Soil 3 | 5–600 | 1.67·10⁻² ± 1.44·10⁻³ | 1.00·10⁻¹ ± 4.11·10⁻¹ | 3.21·10⁻¹ | 0.9933 | 5 | |||
| Soil 4 | 5–600 | 1.83·10⁻² ± 1.44·10⁻⁴ | −2.48·10⁻² ± 4.12·10⁻² | 3.20·10⁻² | 0.9999 | 16 | |||
| Soil 5 | 5–600 | 1.58·10⁻² ± 8.21·10⁻⁴ | −9.07·10⁻² ± 2.33·10⁻¹ | 1.81·10⁻¹ | 0.9980 | 0 | |||
| Soil 6 | 5–600 | 1.69·10⁻² ± 2.54·10⁻⁴ | −2.97·10⁻² ± 7.28·10⁻² | 5.57·10⁻² | 0.9998 | 7 | |||
| Solvent | 5–600 | 1.58·10⁻² ± 7.45·10⁻⁴ | −8.76·10⁻² ± 2.13·10⁻¹ | 1.53·10⁻¹ | 0.9983 | — | |||
| Chlorpyrifos | Soil 1 | 5–600 | 1.03·10⁻² ± 1.59·10⁻⁴ | −1.62·10⁻² ± 4.54·10⁻² | 3.27·10⁻² | 0.9998 | -21 | ||
| Soil 2 | 5–600 | 1.15·10⁻² ± 1.96·10⁻⁴ | 4.71·10⁻¹ ± 5.62·10⁻² | 4.04·10⁻² | 0.9998 | -12 | |||
| Soil 3 | 5–600 | 1.26·10⁻² ± 9.94·10⁻⁵ | −1.12·10⁻² ± 2.84·10⁻² | 2.23·10⁻² | 0.9999 | -3 | |||
| Soil 4 | 5–600 | 1.24·10⁻² ± 1.76·10⁻⁴ | −1.44·10⁻⁴ ± 5.04·10⁻² | 3.92·10⁻² | 0.9998 | -5 | |||
| Soil 5 | 5–600 | 1.16·10⁻² ± 6.33·10⁻⁴ | −8.42·10⁻² ± 1.80·10⁻¹ | 1.39·10⁻¹ | 0.9977 | -11 | |||
| Soil 6 | 5–600 | 1.14·10⁻² ± 2.29·10⁻⁴ | 7.10·10⁻⁴ ± 6.57·10⁻² | 5.02·10⁻² | 0.9996 | -12 | |||
| Solvent | 5–600 | 1.30·10⁻² ± 5.48·10⁻⁴ | −7.41·10⁻² ± 1.57·10⁻¹ | 1.13·10⁻¹ | 0.9986 | — | |||
| Fenthion | Soil 1 | 5–600 | 1.71·10⁻² ± 3.38·10⁻⁴ | −3.26·10⁻² ± 9.68·10⁻² | 6.97·10⁻² | 0.9997 | -16 | ||
| Soil 2 | 5–600 | 1.88·10⁻² ± 1.89·10⁻⁴ | −2.84·10⁻² ± 5.40·10⁻² | 3.89·10⁻² | 0.9999 | -8 | |||
| Soil 3 | 5–600 | 2.01·10⁻² ± 4.45·10⁻⁴ | −1.38·10⁻² ± 1.27·10⁻¹ | 9.95·10⁻² | 0.9996 | -2 | |||
| Soil 4 | 5–600 | 1.96·10⁻² ± 2.89·10⁻⁴ | −8.63·10⁻⁴ ± 8.27·10⁻² | 6.42·10⁻² | 0.9998 | -4 | |||
| Soil 5 | 5–600 | 1.89·10⁻² ± 9.10·10⁻⁴ | −1.33·10⁻¹ ± 2.59·10⁻¹ | 2.00·10⁻¹ | 0.9983 | -7 | |||
| Soil 6 | 5–600 | 1.84·10⁻² ± 1.16·10⁻⁴ | −4.97·10⁻² ± 3.31·10⁻² | 2.54·10⁻² | 0.9999 | -10 | |||
| Solvent | 5–600 | 2.05·10⁻² ± 9.70·10⁻⁴ | −1.27·10⁻¹ ± 2.78·10⁻¹ | 2.00·10⁻¹ | 0.9983 | — | |||
| Pirimiphos-ethyl | Soil 1 | 5–600 | 3.30·10⁻³ ± 6.51·10⁻⁵ | −2.54·10⁻² ± 1.86·10⁻² | 1.34·10⁻² | 0.9997 | -3 | ||
| Soil 2 | 5–600 | 3.30·10⁻³ ± 3.66·10⁻⁵ | −5.05·10⁻³ ± 1.05·10⁻² | 7.55·10⁻³ | 0.9999 | -3 | |||
| Soil 3 | 5–600 | 2.80·10⁻³ ± 1.78·10⁻⁴ | 1.98·10⁻³ ± 5.10·10⁻² | 3.99·10⁻² | 0.9963 | -17 | |||
| Soil 4 | 5–600 | 2.64·10⁻³ ± 5.18·10⁻⁵ | 2.01·10⁻³ ± 1.48·10⁻² | 1.15·10⁻² | 0.9997 | -22 | |||
| Soil 5 | 5–600 | 1.36·10⁻³ ± 6.77·10⁻⁵ | 4.60·10⁻⁴ ± 1.93·10⁻² | 1.49·10⁻² | 0.9981 | -60 | |||
| Soil 6 | 5–600 | 2.92·10⁻³ ± 1.23·10⁻⁴ | −9.09·10⁻³ ± 3.51·10⁻² | 2.69·10⁻² | 0.9985 | -14 | |||
| Solvent | 5–600 | 3.39·10⁻³ ± 1.46·10⁻⁴ | −2.62·10⁻² ± 4.18·10⁻² | 3.01·10⁻² | 0.9986 | — | |||
| Methidathion | Soil 1 | 5–600 | 2.12·10⁻² ± 7.46·10⁻⁴ | −9.50·10⁻² ± 2.13·10⁻¹ | 1.54·10⁻¹ | 0.9990 | -34 | ||
| Soil 2 | 5–600 | 2.59·10⁻² ± 5.46·10⁻⁴ | −1.20·10⁻¹ ± 1.56·10⁻¹ | 1.12·10⁻¹ | 0.9997 | -19 | |||
| Soil 3 | 5–600 | 2.33·10⁻² ± 1.54·10⁻³ | 6.34·10⁻² ± 4.41·10⁻¹ | 3.45·10⁻¹ | 0.9961 | -27 | |||
| Soil 4 | 5–600 | 2.51·10⁻² ± 3.38·10⁻⁴ | −5.47·10⁻² ± 9.66·10⁻² | 7.51·10⁻² | 0.9998 | -22 | |||
| Soil 5 | 5–600 | 2.59·10⁻² ± 1.32·10⁻³ | −2.06·10⁻¹ ± 3.75·10⁻¹ | 2.90·10⁻¹ | 0.9980 | -19 | |||
| Soil 6 | 5–600 | 2.27·10⁻² ± 3.71·10⁻⁴ | −6.62·10⁻² ± 1.06·10⁻¹ | 8.13·10⁻² | 0.9998 | -29 | |||
| Solvent | 5–600 | 3.21·10⁻² ± 1.75·10⁻³ | −2.83·10⁻¹ ± 5.00·10⁻¹ | 3.60·10⁻¹ | 0.9977 | — | |||
| Fenamiphos | Soil 1 | 5–600 | 2.36·10⁻³ ± 2.87·10⁻⁴ | −4.42·10⁻² ± 8.20·10⁻² | 5.91·10⁻² | 0.9888 | 8 | ||
| Soil 2 | 5–600 | 3.47·10⁻³ ± 1.21·10⁻⁴ | −2.82·10⁻² ± 3.46·10⁻² | 2.49·10⁻² | 0.9991 | 58 | |||
| Soil 3 | 5–600 | 1.89·10⁻³ ± 4.02·10⁻⁴ | 9.58·10⁻³ ± 1.15·10⁻¹ | 8.99·10⁻² | 0.9606 | -14 | |||
| Soil 4 | 5–600 | 2.63·10⁻³ ± 7.66·10⁻⁵ | −2.51·10⁻² ± 2.19·10⁻² | 1.70·10⁻² | 0.9992 | 20 | |||
| Soil 5 | 5–600 | 2.95·10⁻³ ± 1.91·10⁻⁴ | −3.58·10⁻² ± 5.43·10⁻² | 4.20·10⁻² | 0.9969 | 35 | |||
| Soil 6 | 5–600 | 3.09·10⁻³ ± 5.98·10⁻⁵ | −2.12·10⁻² ± 1.71·10⁻² | 1.31·10⁻² | 0.9997 | 41 | |||
| Solvent | 5–600 | 2.19·10⁻³ ± 2.87·10⁻⁴ | −4.33·10⁻² ± 8.20·10⁻² | 5.91·10⁻² | 0.9871 | — | |||
| Ethion | Soil 1 | 5–600 | 5.02·10⁻³ ± 1.00·10⁻⁴ | −1.16·10⁻² ± 2.87·10⁻² | 2.07·10⁻² | 0.9997 | -3 | ||
| Soil 2 | 5–600 | 5.07·10⁻³ ± 2.15·10⁻⁴ | −1.06·10⁻² ± 6.16·10⁻² | 4.43·10⁻² | 0.9986 | -2 | |||
| Soil 3 | 5–600 | 4.58·10⁻³ ± 2.21·10⁻⁴ | 9.11·10⁻⁴ ± 6.32·10⁻² | 4.95·10⁻² | 0.9979 | -12 | |||
| Soil 4 | 5–600 | 5.07·10⁻³ ± 7.18·10⁻⁵ | −1.21·10⁻² ± 2.05·10⁻² | 1.60·10⁻² | 0.9998 | -2 | |||
| Soil 5 | 5–600 | 5.00·10⁻³ ± 2.32·10⁻⁴ | −2.72·10⁻² ± 6.61·10⁻² | 5.11·10⁻² | 0.9984 | -3 | |||
| Soil 6 | 5–600 | 4.73·10⁻³ ± 8.29·10⁻⁵ | −6.89·10⁻³ ± 2.37·10⁻² | 1.81·10⁻² | 0.9997 | -9 | |||
| Solvent | 5–600 | 5.18·10⁻³ ± 2.24·10⁻⁴ | −2.80·10⁻² ± 6.40·10⁻² | 4.61·10⁻² | 0.9986 | — | |||
Table 3: Matrix-matched calibration parameters and MEs for the 12 target OPPs in six agricultural soils. Abbreviations: OPPs = organophosphorus pesticides; b = slope; sb = standard deviation of the slope; a = intercept; sa = standard deviation of the intercept; R2 = determination coefficient; sy/x = standard deviation of the estimate; ME = matrix effect. Please click here to download this Table.
| Analyte | S1 | S2 | S3 | S4 | S5 | S6 | |||||||||||||
| 50 µg/kg | 200 µg/kg | 400 µg/kg | 50 µg/kg | 200 µg/kg | 400 µg/kg | 50 µg/kg | 200 µg/kg | 400 µg/kg | 50 µg/kg | 200 µg/kg | 400 µg/kg | 50 µg/kg | 200 µg/kg | 400 µg/kg | 50 µg/kg | 200 µg/kg | 400 µg/kg | ||
| Chlorpyrifos-methyl | 106 (4) | 102 (2) | 103 (1) | 110 (17) | 99 (2) | 101 (2) | 105 (5) | 104 (2) | 110 (10) | 105 (4) | 98 (3) | 100 (4) | 107 (4) | 107 (3) | 100 (4) | 114 (4) | 102 (3) | 114 (4) | |
| Parathion-methyl | 96 (3) | 96 (0) | 99 (1) | 97 (17) | 92 (3) | 97 (2) | 116 (4) | 104 (6) | 121 (5) | 103 (6) | 87 (4) | 95 (6) | 117 (6) | 110 (4) | 107 (6) | 107 (6) | 100 (4) | 108 (6) | |
| Tolclofos-methyl | 113 (3) | 107 (2) | 104 (1) | 110 (15) | 100 (2) | 105 (3) | 101 (6) | 97 (2) | 104 (10) | 100 (7) | 98 (3) | 102 (2) | 106 (7) | 104 (3) | 101 (2) | 110 (7) | 103 (3) | 108 (2) | |
| Pirimiphos-methyl | 78 (12) | 79 (3) | 89 (2) | 106 (22) | 95 (1) | 99 (3) | 102 (7) | 97 (3) | 104 (9) | 101 (5) | 97 (2) | 100 (3) | 104 (5) | 101 (2) | 98 (3) | 113 (5) | 102 (2) | 104 (3) | |
| Fenitrothion | 91 (4) | 90 (2) | 98 (2) | 104 (25) | 90 (3) | 95 (2) | 116 (5) | 105 (4) | 118 (5) | 101 (6) | 90 (3) | 96 (7) | 111 (6) | 107 (3) | 103 (7) | 118 (6) | 101 (3) | 103 (7) | |
| Malathion | 89 (3) | 81 (1) | 87 (4) | 108 (18) | 90 (2) | 92 (2) | 118 (7) | 110 (4) | 119 (5) | 106 (5) | 96 (4) | 97 (5) | 122 (5) | 110 (4) | 102 (5) | 122 (5) | 102 (4) | 103 (5) | |
| Chlorpyrifos | 97 (4) | 96 (2) | 97 (1) | 160 (13) | 117 (5) | 112 (4) | 97 (6) | 95 (3) | 103 (10) | 102 (6) | 95 (2) | 98 (4) | 105 (6) | 98 (2) | 96 (4) | 108 (6) | 97 (2) | 103 (4) | |
| Fenthion | 101 (2) | 99 (1) | 98 (2) | 99 (3) | 98 (2) | 103 (2) | 100 (7) | 101 (3) | 106 (8) | 102 (6) | 94 (2) | 97 (4) | 104 (6) | 100 (2) | 100 (4) | 110 (6) | 100 (2) | 104 (4) | |
| Pirimiphos-ethyl | 63 (14) | 66 (5) | 85 (2) | 100 (21) | 93 (3) | 101 (3) | 70 (12) | 78 (3) | 93 (8) | 105 (9) | 104 (8) | 108 (7) | 113 (9) | 103 (8) | 103 (7) | 55 (9) | 33 (8) | 34 (7) | |
| Methidathion | 92 (3) | 80 (16) | 91 (3) | 103 (16) | 87 (2) | 90 (2) | 125 (8) | 113 (5) | 125 (5) | 90 (12) | 85 (5) | 92 (8) | 97 (12) | 97 (5) | 97 (8) | 113 (12) | 100 (5) | 104 (8) | |
| Fenamiphos | 5 (38) | 1 (38) | 3 (52) | 58 (18) | 58 (8) | 56 (6) | 140 (16) | 117 (3) | 126 (2) | 65 (15) | 50 (19) | 40 (20) | 82 (15) | 62 (19) | 69 (20) | 88 (15) | 70 (19) | 70 (20) | |
| Ethion | 59 (15) | 42 (11) | 59 (15) | 83 (12) | 82 (3) | 87 (3) | 93 (11) | 97 (4) | 103 (7) | 80 (10) | 78 (6) | 81 (4) | 83 (10) | 77 (6) | 87 (4) | 96 (10) | 87 (6) | 89 (4) | |
Table 4: Mean recoveries (%) and RSDs (%, in parentheses) for the 12 target OPPs in six agricultural soils (S1–S6) at three fortification levels. Recovery experiments were conducted at 50, 200, and 400 µg/kg (n = 5 per level) with chlorpyrifos-methyl-d10 as P-IS. Both pesticide fortification and P-IS solutions were added prior to extraction. According to SANTE/2020/12830 (Rev.2) performance criteria, acceptable recoveries ranged from 70 to 120% with RSDs ≤20%. S1: Villavicencio (Meta, Colombia); S2: Sabana Bogotá (Cundinamarca, Colombia); S3: Floresta (Boyacá, Colombia); S4: Guasca (Cundinamarca, Colombia); S5: Santa Rosa de Viterbo (Boyacá, Colombia); S6: La Laguna (Canarias, España). Abbreviations: RSD = relative standard deviation; OPPs = organophosphorus pesticides; P-IS = procedural internal standard. Please click here to download this Table.
Discussion
The determination of pesticide residues in soils remains analytically challenging due to the high variability in soil physicochemical properties and the resulting differences in co-extractive composition4,5,6,14,17,18,19,20,21. Although QuEChERS-based methods have been widely applied to food and plant matrices, fewer studies have systematically optimized dSPE cleanup for agricultural soils exhibiting diverse soil properties4. In the present study, seven dSPE sorbent combinations were evaluated using six agricultural soils selected to represent a distinct range of edaphic conditions. The results demonstrated that the composition of the cleanup step substantially influenced the removal of co-extracted matrix components. Although co-extractive removal was used as an analyte-independent criterion to select the most efficient dSPE configuration, the analytical performance of the optimized cleanup procedure was subsequently assessed through ME evaluation and method validation. By identifying an optimized dSPE configuration and integrating it with analyte protectants, a deuterated P-IS, matrix-matched calibration, and validation according to the SANTE/2020/12830 (Rev.2) guidance, this protocol provides a complete, practical, and analytical workflow for the simultaneous determination of OPPs across agricultural soils with contrasting soil properties. Rather than representing an optimization for a single soil matrix, the protocol was designed to provide a robust and readily transferable methodology suitable for routine environmental laboratories.
The superior performance of the PSA+C18+Adsorbent combination can be attributed to the complementary retention mechanisms provided by the three sorbents. PSA primarily contributes to the removal of acidic polar co-extractives through weak anion-exchange interactions, whereas C18 retains nonpolar compounds through hydrophobic partitioning12,13. Florisil, a magnesium silicate sorbent, provides additional retention of polar and moderately polar matrix constituents through hydrogen-bonding, dipole-dipole, and Lewis acid-base interactions15,16. The results support this complementary behavior. The adsorbent alone produced a higher average co-extractive removal than either PSA or C18 individually. Moreover, adding the adsorbent to either PSA or C18 alone produced only marginal changes in average cleanup efficiency, whereas its incorporation into the PSA+C18 combination resulted in the highest overall co-extractive removal among all seven dSPE configurations evaluated. This pattern is more consistent with the adsorbent contributing complementary retention of matrix constituents not efficiently removed by PSA or C18, rather than acting solely as an additional sorbent mass. Such complementarity is particularly relevant for agricultural soils, where variations in organic matter content, mineral composition, and texture result in highly heterogeneous co-extractive profiles.
Because the purpose of this study was to establish a single cleanup protocol applicable to agricultural soils with different physicochemical characteristics, the final sorbent selection considered both the statistical comparison among the evaluated cleanup configurations and the analytical rationale provided by the complementary retention mechanisms of the three sorbents. The MgSO4+PSA+C18+Adsorbent combination achieved the highest overall average co-extractive removal while providing the broadest physicochemical coverage of matrix co-extractives among the evaluated dSPE configurations. Accordingly, this combination was selected for subsequent method validation.
MEs remain one of the principal sources of uncertainty in GC-MS/MS determination of pesticide residues, particularly in heterogeneous matrices such as soils4,5. Although signal suppression was the predominant phenomenon observed in this study, most analytes exhibited average ME values within the range generally considered soft to moderate (−20% to +20% and −20% to −50%, respectively)14,28. This outcome is consistent with an effective reduction of the co-extractive burden reaching the chromatographic system. Nevertheless, analyte-dependent variability was still observed. For example, methidathion, parathion-methyl, and pirimiphos-ethyl showed the strongest average signal suppression, whereas fenamiphos exhibited signal enhancement. MEs in GC-MS/MS are inherently compound-dependent and arise from interactions among analytes, residual matrix constituents, and active sites within the injection system and chromatographic pathway. Consequently, residual matrix components may either decrease or increase detector response depending on the physicochemical properties of each analyte and its susceptibility to surface interactions. The contrasting responses observed among the evaluated OPPs therefore reflect predominantly analyte-dependent behavior superimposed on differences in soil matrix composition. In addition to dSPE cleanup, the analytical workflow incorporated an analyte protectant mixture previously reported to reduce analyte interactions with active sites in GC systems and to improve chromatographic performance for pesticide residue analysis28,29. The persistence of analyte-specific MEs despite these measures highlights the complexity of soil matrices and supports the use of matrix-matched calibration for reliable quantification of OPPs in soils with differing matrix composition.
Recovery experiments demonstrated that the optimized method provides accurate and precise quantification for most of the target OPPs across a diverse range of agricultural soil conditions. The majority of analyte-soil combinations satisfied the SANTE/2020/12830 (Rev.2) acceptance criteria11, with recoveries between 70% and 120% and RSDs below 20%. Nevertheless, some deviations from the recommended recovery range were observed for a limited number of analyte-soil combinations. The most relevant deviations were associated with fenamiphos, pirimiphos-ethyl, and ethion, which showed low recoveries in specific soil matrices. Additional isolated deviations, mainly involving recoveries slightly above the upper acceptance limit at individual fortification levels, were observed for chlorpyrifos, parathion-methyl, malathion, and methidathion. Because these deviations were not consistently observed across soil matrices, the observed behavior is likely related to compound-dependent characteristics combined with MEs. A higher number of deviations was observed in S1, which contained the highest clay content (48.5%) among the matrices evaluated, suggesting that soil physicochemical characteristics may have contributed to reduced extraction efficiency for certain analytes. Clay minerals provide numerous adsorption sites that may retain pesticide molecules through surface interactions, thereby decreasing their desorption during extraction. The extent of these interactions is also expected to depend on analyte physicochemical properties, including their affinity for mineral surfaces. However, the absence of a similar pattern in all clay-rich soils indicates that no single soil parameter fully explains the observed deviations. Furthermore, since the same adsorbent-based cleanup procedure provided satisfactory performance for the majority of analyte-soil combinations, no evidence of systematic losses associated with the cleanup step was observed. Although the individual contribution of the adsorbent to analyte retention was not independently evaluated during sorbent optimization, the satisfactory recovery performance obtained with the optimized procedure suggests that the inclusion of this sorbent did not compromise analyte determination. Overall, these results demonstrate the suitability of the proposed method while highlighting the influence of analyte-matrix interactions on the performance of specific compounds.
Although the method showed satisfactory performance across the six agricultural soils evaluated, its applicability to soils with extreme properties, such as saline soils, peat soils, soils with very high organic matter contents, highly alkaline soils, or matrices enriched in carbonaceous materials, remains to be established. In addition, the present validation was performed using fortified agricultural soils, and therefore, the applicability of the method to naturally contaminated field samples remains to be confirmed. Furthermore, because the method was developed and validated exclusively for OPPs, its suitability for other pesticide classes cannot be assumed. Despite these limitations, the protocol provides a standardized approach for the determination of OPP residues in agricultural soils and may be applied in environmental monitoring programs, pesticide fate and transport studies, risk assessment investigations, and regulatory surveillance activities. Future research should evaluate the transferability of the optimized cleanup strategy to additional soil types and pesticide classes, as well as explore refinements aimed at improving recoveries for compounds exhibiting reduced extraction efficiency in clay-rich matrices.
Overall, the proposed workflow combines optimized dSPE cleanup, matrix-matched calibration, internal standardization, and analyte protectants into a single validated protocol for the simultaneous determination of OPPs in agricultural soils. The systematic evaluation of sorbent combinations across soils with contrasting physicochemical properties provides practical guidance for selecting cleanup conditions capable of minimizing MEs while maintaining satisfactory analytical performance. The protocol, therefore, offers a reproducible approach that may support environmental monitoring, pesticide fate studies, and routine residue determination in agricultural soils with diverse soil characteristics.
Disclosures
During the preparation of this work, the authors used the free version of Claude (Anthropic) to assist in the design of the graphical layout of Figure 3 and the free version of ChatGPT (GPT-5.5, OpenAI) to assist with grammar and spelling. After using these tools, the authors carefully reviewed and edited all content as needed. All scientific content, data, analyses, and conclusions were generated, verified, and approved by the authors, who take full responsibility for the accuracy and integrity of the published article.
Acknowledgements
The authors gratefully acknowledge EAN University and its Research and Transfer Management Office for supporting this research. The authors also thank the EAN University Laboratories for providing the analytical facilities and technical resources necessary to conduct this work, including access to the GC-MS/MS instrumentation employed throughout the study. This work was supported by the Research and Transfer Management, Universidad EAN, Bogotá D.C., Colombia.
Materials
| Name | Company | Catalog Number | Comments |
|---|---|---|---|
| 3-Ethoxy-1,2-propanediol (ethylglycerol) | Sigma Aldrich | 260428-1G | |
| Acetic acid | Sigma Aldrich | 695092 | |
| Acetonitrile | Merck | 1006652500 | |
| AOAC 20i/s autosampler | Shimadzu | 221-723115-58 | |
| Balance | OHAUS | PA224 | |
| C18 | Sigma Aldrich | 52600-U | |
| Centrifuge tubes, 2 mL | Eppendorf | 4610-1815 | |
| Centrifuge tubes, 50 mL | Nest | 602002 | |
| Centrifuge Z206A | MERMLE | 6019500118 | |
| Column SH-Rxi-5sil MS, 30 m x 0.25 mm, 0.25 µm | Shimadzu | 221-75954-30 | |
| Container, with cap, amber glass, 1000 mL | Sigma Aldrich | Z674176 | |
| Desiccator | Simax | 415262302 | |
| Dispensette 5-50 mL | BRAND | 4600361 | |
| D-Sorbitol | Sigma Aldrich | 240850-5G | |
| Ethyl acetate | Merk | 1313181212 | |
| Florisil <200 mesh, fine powder | Sigma Aldrich | 288705-50G | |
| Formic acid | Merck | 1002641000 | |
| GCMS-TQ8040 | Shimadzu | 211552 | |
| Injection syringe | Shimadzu | LC2213461800 | |
| L-Gulonic acid γ-lactone | Sigma Aldrich | 310301-5G | |
| Linner splitless | Shimadzu | 221-4887-02 | |
| Magnesium sulfate (anhydrous) | Sigma Aldrich | M7506-2KG | |
| Methanol | Panreac | 131091.12.12 | |
| Milli-Q ultrapure (type 1) water | Millipore | F4H4783518 | |
| Pipette tips 10 - 100 µL | Biologix | 200010 | |
| Pipette tips 100 - 1000 µL | Brand | 541287 | |
| Pipette tips 20 - 200 µL | Brand | 732028 | |
| Pipettes Pasteur | NORMAX | 5426023 | |
| Pippette Transferpette S variabel 10 - 100 µL | BRAND | 704774 | |
| Pippette Transferpette S variabel 100 - 1000 µL | BRAND | 704780 | |
| Pippette Transferpette S variabel 20 - 200 µL | SCILOGEX | 712111099999 | |
| Primary-secondary amine (PSA) | Sigma Aldrich | 52738-U | |
| Refrigerator/freezer | Haceb | NEV ALC 404 | |
| Shikimic acid | Sigma Aldrich | S5375-1G | |
| Sodium acetate | Sigma Aldrich | 241245-1KG | |
| Software GCMSsolution | Shimadzu | 223-18472-92 | |
| Stainless steel 2 mm mesh | Pinzuar | PS33N10 | |
| Test tube, glass, 10 mL | Sigma Aldrich | BR114508 | |
| Toluene | Merck | 1083252500 | |
| Triphenyl phosphate (I-IS) | Sigma Aldrich | 241288-50G | |
| Vials with fused-in insert, 0.3 mL | Sigma Aldrich | 29398-U | |
| Vials, screw top, amber glass, 15 mL | Sigma Aldrich | 27088-U | |
| Volumetric flask, 10 mL | Sigma Aldrich | DWK28017-10 | |
| Vortex | Scilogex | 82120004 | |
| Pesticides | |||
| Chlorpyrifos | Sigma Aldrich | 45395-100MG | 2921-88-2 |
| Chlorpyrifos-methyl | Sigma Aldrich | 45396-250MG | 5598-13-0 |
| Chlorpyrifos-methyl-d10 (P-IS) | Sigma Aldrich | 90047-5MG | 285138-81-0 |
| Ethion | Sigma Aldrich | 45477-250MG | 563-12-2 |
| Fenamiphos | Sigma Aldrich | 45483-250MG | 22224-92-6 |
| Fenitrothion | Sigma Aldrich | 45487-250MG | 122-14-5 |
| Fenthion | Sigma Aldrich | 36552-250MG | 55-38-9 |
| Malathion | Sigma Aldrich | 36143-100MG | 121-75-5 |
| Methidathion | Sigma Aldrich | 36158-100MG | 950-37-8 |
| Parathion-methyl | Sigma Aldrich | 36187-100MG | 298-00-0 |
| Pirimiphos-ethyl | Sigma Aldrich | 45628-250MG | 23505-41-1 |
| Pirimiphos-methyl | Sigma Aldrich | 32058-250MG | 29232-93-7 |
| Tolclofos-methyl | Sigma Aldrich | 31209-250MG | 5701804-9 |
References
- Saad H, Elfeky SA, El-Gamel NE, Dena ASA. Organophosphate pesticides: a review on classification, synthesis, toxicity, remediation and analysis. RSC Adv. 2025;15(48):40802-40822.
- Mali H, et al. Organophosphate pesticides an emerging environmental contaminant: Pollution, toxicity, bioremediation progress, and remaining challenges. J Environ Sci. 2023;127:234-250.
- Dhuldhaj UP, Singh R, Singh VK. Pesticide contamination in agro-ecosystems: toxicity, impacts, and bio-based management strategies. Environ Sci Pollut Res. 2023;30:9243-9270.
- González-Curbelo MÁ, Varela-Martínez DA, Riaño-Herrera DA. Pesticide-residue analysis in soils by the QuEChERS method: A review. Molecules. 2022;27(13):4323.
- Wang J, et al. Multiresidue analysis method for the determination of 477 pesticides in soil based on thorough method validation. J Agric Food Chem. 2025;73(27):17269-17286.
- Mohamed AH, et al. Sampling and sample preparation techniques for the analysis of organophosphorus pesticides in soil matrices. Crit Rev Anal Chem. 2023;53(4):906-927.
- Bhattu M, Kathuria D, Billing BK, Verma M. Chromatographic techniques for the analysis of organophosphate pesticides with their extraction approach: a review (2015–2020). Anal Methods. 2022;14(4):322-358.
- Wondimu KT, Geletu AK, Kedir WM. Recent developments in monitoring of organophosphorus pesticides in food samples. J Agric Food Res. 2025;19:101709.
- Bulaić Nevistić M, Kovač Tomas M. Matrix effect evaluation in GC/MS-MS analysis of multiple pesticide residues in selected food matrices. Foods. 2023;12(21):3991.
- Damale RD, et al. Multiresidue analysis of pesticides in four different pomegranate cultivars: Investigating matrix effect variability by GC-MS/MS and LC-MS/MS. Food Chem. 2023;407:135179.
- European Commission. Guidance document on pesticide analytical methods for risk assessment and post-approval control and monitoring purposes (SANTE/2020/12830, Rev. 2). 2023. Available from: https://food.ec.europa.eu/system/files/2021-03/pesticides_ppp_app-proc_guide_res_mrl-guidelines-2020-12830.pdf
- González-Curbelo MÁ, et al. Evolution and applications of the QuEChERS method. Trends Anal Chem. 2015;71:169-185.
- Varela-Martinez DA, Gonzalez-Salamo J, Gonzalez-Curbelo MÁ, Hernandez-Borges J. Quick, easy, cheap, effective, rugged, and safe (QuEChERS) extraction. In: Liquid-phase Extraction. Elsevier; 2020. p. 399-437.
- González-Curbelo MÁ. Analysis of organochlorine pesticides in a soil sample by a modified QuEChERS approach using ammonium formate. J Vis Exp. 2023;191:e64901.
- Jin Q, et al. Simultaneous determination of six acidic herbicides and metabolites in plant origin matrices by QuEChERS-UPLC-MS/MS. Molecules. 2025;30(4):852.
- Zhu L, et al. Establishment and validation of anticoagulant rodenticides in animal samples by HPLC-MS/MS, focusing on evaluating the effect of modified QuEChERS protocol on matrix effect reduction. ACS Omega. 2022;7(21):18146-18158.
- do Amaral B, Peralta-Zamora P, Nagata N. Simultaneous multi-residue pesticide analysis in southern Brazilian soil based on chemometric tools and QuEChERS-LC-DAD/FLD method. Environ Sci Pollut Res. 2022;29:39102-39115.
- Łozowicka B, et al. The fate of spirotetramat and dissipation metabolites in Apiaceae and Brassicaceae leaf-root and soil system under greenhouse conditions estimated by modified QuEChERS/LC-MS/MS. Sci Total Environ. 2017;603:178-184.
- Dong B, Shao X, Lin H, Hu J. Dissipation, residues and risk assessment of metaldehyde and niclosamide ethanolamine in pakchoi after field application. Food Chem. 2017;229:604-609.
- Guan J, Li D, Guo Y, Shi S, Yan F. Simultaneous determination of seven pesticide residues in soil samples using ultrasound-assisted dispersive solid-phase extraction combined with UHPLC-MS/MS. Sep Sci Plus. 2018;1(4):296-305.
- Kaczyński P, Łozowicka B, Jankowska M, Hrynko I. Rapid determination of acid herbicides in soil by liquid chromatography with tandem mass spectrometric detection based on dispersive solid phase extraction. Talanta. 2016;152:127-136.
- NSW Environment Protection Authority. Sampling design part 1 - application: Contaminated land guidelines (EPA 2022P3915). 2022. Available from: https://hdp-au-prod-app-nswepa-yoursay-files.s3.ap-southeast-2.amazonaws.com/9116/6027/3560/22p3915-sampling-design-guidelines-part1.pdf
- Eckert D, Sims JT. Recommended soil pH and lime requirement tests. In: Recommended Soil Test Procedures for the Northeastern United States. Cooperative Bulletin No. 493; 2009. p. 19-26.
- Schulte EE, Hoskins B. Recommended soil organic matter tests. In: Recommended Soil Test Procedures for the Northeastern United States. 2011. p. 52-60.
- Ashworth J, Keyes D, Kirk R, Lessard R. Standard procedure in the hydrometer method for particle size analysis. Commun Soil Sci Plant Anal. 2001;32(5-6):633-642.
- González-Curbelo MÁ, Hernández-Borges J, Borges-Miquel TM, Rodríguez-Delgado MÁ. Determination of pesticides and their metabolites in processed cereal samples. Food Addit Contam A. 2012;29(1):104-116.
- Varela-Martínez DA, González-Curbelo MÁ, González-Sálamo J, Hernández-Borges J. Determination of 45 pesticides in avocado varieties by the QuEChERS method and gas chromatography-tandem mass spectrometry. J Vis Exp. 2023;202:e66082.
- Varela-Martínez DA, González-Curbelo MÁ, González-Sálamo J, Hernández-Borges J. High-throughput analysis of pesticides in minor tropical fruits from Colombia. Food Chem. 2019;280:221-230.
- Varela-Martínez DA, González-Curbelo MÁ, González-Sálamo J, Hernández-Borges J. Analysis of pesticides in cherimoya and gulupa minor tropical fruits using AOAC 2007.1 and ammonium formate QuEChERS versions: A comparative study. Microchem J. 2020;157:104950.