This protocol describes targeted HPLC quantification of rutin and quercetin in Styphnolobium japonicum bud extract and evaluates the extract in microglial, microglia-neuron co-culture, and nitric oxide-deficiency hypertension models. The workflow links extract preparation with neuroinflammatory, neuronal-stress, blood-pressure, and paraventricular-nucleus endpoints.
Research Article
HPLC-Quantified Styphnolobium japonicum Extract Attenuates Microglial Inflammation and Hypertension in L-NAME-Treated Rats
* These authors contributed equally
In This Article
Summary
Abstract
Neuroinflammation in the hypothalamic paraventricular nucleus (PVN) can contribute to sympathetic excitation and hypertension. We evaluated a Styphnolobium japonicum bud extract (SJBE; historically Sophora japonica) quantified for rutin and quercetin by targeted high-performance liquid chromatography (HPLC). The extract was tested in angiotensin II (Ang II)-stimulated BV-2 microglia, BV-2/mHypoA-2/10 soluble-factor co-cultures, an in vitro high-sodium neuronal-stress condition, and rats with Nω-nitro-L-arginine methyl ester (L-NAME)-induced nitric-oxide-deficiency hypertension. At non-cytotoxic working concentrations, SJBE reduced inflammatory and oxidative-stress endpoints in BV-2 cells and was associated with higher angiotensin-converting enzyme 2 (ACE2), Mas receptor (MasR), and angiotensin-(1-7) [Ang-(1-7)] markers. In co-culture, SJBE reduced inflammatory transfer and neuronal stress. Oral SJBE lowered tail-cuff blood-pressure measurements and was associated with higher PVN ACE2/MasR and Ang-(1-7), lower Iba-1 and c-Fos staining, and lower circulating norepinephrine and cytokines. MLN-4760 provided in vitro functional support for ACE2 involvement, but no in vivo pathway blockade or brain-exposure pharmacokinetics were performed. The results therefore support an association between SJBE treatment, reduced neuroinflammatory signaling, and lower blood pressure, without establishing central-pathway causality.
Introduction
Botanical extracts are increasingly studied as multi-component modulators of vascular and neuroimmune disease. Their interpretation depends on clear source identity, analytical scope, and chemical consistency. Styphnolobium japonicum (L.) Schott, historically known as Sophora japonica L., yields the dried flower-bud material Flos Sophorae Immaturus or Huai Mi1,2. Rutin is a major quality marker of this material, which also contains other bioactive flavonoids3. Extraction studies have evaluated conventional and intensified approaches for recovering rutin and related flavonoids4,5,6. A recent study also describes a greener rutin-extraction workflow for S. japonicum7. Targeted HPLC provides efficient quantification of predefined markers, whereas chromatographic fingerprinting or multi-component profiling is required to assess broader chemical and batch-to-batch consistency; therefore, the present rutin and quercetin measurements should not be interpreted as a complete phytochemical profile.
Rutin and quercetin provide a plausible pharmacological basis for studying S. japonicum-derived extracts in neurovascular inflammation. Rutin and S. japonicum flower preparations have been associated with reduced inflammatory signaling, including NF-kappaB-linked responses and neuroinflammation8. Experimental models further link rutin to reduced neuroinflammation and NF-kappaB-associated tissue injury9. Quercetin has also been linked to cardiovascular bioactivity and improved inflammatory-redox balance10,11. In microglial models, quercetin can restrain activation, oxidative stress, and Toll-like receptor 4 (TLR4)-associated inflammatory signaling12,13.
Hypertension is not only a vascular disorder. Central inflammatory circuits can also sustain sympathetic drive. The paraventricular nucleus (PVN) integrates neuroendocrine and autonomic signals that regulate cardiovascular tone. Brain and PVN microglial cytokines have been linked to neurogenic hypertension14, and PVN microglia can sense hemodynamic disturbance and promote sympathetic excitation15. These observations place microglia-neuron communication within the PVN as a relevant target for interventions that aim to reduce neurogenic blood-pressure elevation16.
The ACE2/Ang-(1-7)/Mas receptor (MasR) arm of the renin-angiotensin system provides one protective pathway within this central network17,18. ACE2 overexpression in the PVN attenuates angiotensin II-induced hypertension and has been linked to reduced neuroinflammation19. Endogenous Ang-(1-7) signaling in the PVN also modulates sympathetic outflow20. Ang II can engage angiotensin II type 1 receptor (AT1)/TLR4-related redox pathways in PVN microglia, linking renin-angiotensin stress with neuroinflammation21. The high-sodium cell condition was used only as an in vitro stress challenge, not as a surrogate for the L-NAME animal model. Whether S. japonicum bud extract (SJBE), quantified for rutin and quercetin by targeted HPLC, can restrain microglial inflammation at this microglia-neuron interface remains unresolved. The present workflow combines targeted marker quantification with microglial, soluble-factor co-culture, and L-NAME-induced nitric-oxide-deficiency hypertension models. It is intended for hypothesis-driven comparison of a defined SJBE preparation, not for comprehensive phytochemical profiling or demonstration of brain exposure; the L-NAME experiment does not specifically model PVN-driven neurogenic hypertension. Here, we tested whether SJBE suppresses Ang II-driven microglial inflammation, limits inflammatory signaling in hypothalamic neurons, and lowers blood pressure in L-NAME-treated rats, and whether these outcomes are associated with ACE2/Ang-(1-7)/MasR markers.
Protocol
All animal procedures were approved by the Biomedical Research Ethics Review Committee of Shanxi Datong University (Approval No. 2021029; approval period, August 2021 to February 2024) and were conducted in accordance with institutional guidelines for the care and use of laboratory animals. The reagents and the equipment used are listed in the Table of Materials.
Materials and reagents
Dried, unopened flower buds of Styphnolobium japonicum (L.) Schott (syn. Sophora japonica L.; Fabaceae; Flos Sophorae Immaturus/Huai Mi) was used. The botanical material was authenticated by comparison with certified Sophorae Flos reference material from the National Institutes for Food and Drug Control (NIFDC), Beijing, China (Cat. No. 121270; Batch No. 121270-201403), before extraction. Rutin (98%, HPLC) and quercetin (98%, HPLC) served as reference standards. Ang II, MLN-4760, L-NAME, and valsartan were used as indicated. Other reagents and equipment are listed in the Table of Materials.
Preparation and quality control of S. japonicum bud extract
The flower buds were oven-dried at 80 °C to constant weight, ground, and passed through an 85-mesh sieve. The powder was reflux-extracted twice with 85% ethanol at a material-to-solvent ratio of 1:20 (w/v) at 80 °C for 1.5 h per extraction. The filtrates were combined and concentrated under reduced pressure at 60 °C to a thick extract, pre-frozen at −80 °C, and lyophilized for 48–72 h. The extraction yield was calculated as the dry extract mass divided by the dry crude-drug mass, and aliquoted SJBE powder was stored under conditions that prevented repeated freeze-thaw cycles or moisture exposure.
High-performance liquid chromatography (HPLC) was performed using equipment equipped with a UV-visible photodiode-array detector. Analytes were separated on a C18 reversed-phase column (250 mm × 4.6 mm, 5 µm) with methanol-water (65:35, v/v) delivered isocratically at 1.0 mL/min. The column was maintained at 35 °C, detection was set at 360 nm, the injection volume was 20 µL, and the acquisition time was 20 min. SJBE was prepared at 1.0 mg/mL in methanol. Seven rutin calibration levels were prepared at 10 µg/mL, 25 µg/mL, 50 µg/mL, 100 µg/mL, 200 µg/mL, 300 µg/mL, and 400 µg/mL, and seven quercetin calibration levels were prepared at 0.5 µg/mL, 1 µg/mL, 2.5 µg/mL, 5 µg/mL, 10 µg/mL, 25 µg/mL, and 50 µg/mL. Standards and samples were passed through 0.22 µm polytetrafluoroethylene membrane filters, the first 0.5 mL of filtrate was discarded, and the remainder was transferred to HPLC vials. Each calibration level was injected in duplicate, and each SJBE preparation was injected in triplicate. Rutin and quercetin were identified by retention-time matching to authentic standards within ±2% and by concordant photodiode-array spectra. Each marker was quantified by external-standard calibration, and diluted samples were reanalyzed when the detector response fell outside the applicable calibration range.
Analytical performance, system suitability, and batch assessment
Linearity was evaluated by least-squares regression of peak area against concentration across the seven specified levels. Calibration was accepted when R2 was at least 0.999, and the residual plot showed no systematic trend. The limit of detection and limit of quantification were determined at signal-to-noise ratios of approximately 3 and 10, respectively. Specificity was demonstrated using a methanol blank, mixed-standard solution, and SJBE sample; the absence of coeluting interference and concordance of analyte spectra with the reference standards were confirmed.
Injection precision was assessed using six consecutive injections of a mixed standard. Intra-day precision was assessed using six determinations performed on the same day, and inter-day precision was assessed over three consecutive days. Repeatability was evaluated using six independently prepared SJBE solutions, and autosampler stability was assessed at 0 h, 4 h, 8 h, 12 h, and 24 h. Recovery was evaluated at 80%, 100%, and 120% of the native marker level using three independently spiked preparations at each level. Injection precision was accepted at peak-area RSD ≤2.0%; precision, repeatability, and stability were accepted at RSD ≤3.0%; and mean recovery was accepted at 95.0%–105.0% with recovery RSD ≤3.0%.
Before each analytical sequence, the mixed standard was injected six times. System suitability was accepted when retention-time RSD was ≤1.0%, peak-area RSD was ≤2.0%, resolution was ≥1.5, the tailing factor was ≤2.0, and the number of theoretical plates for the rutin peak was at least 5,000. The column was re-equilibrated, and system-suitability testing was repeated whenever any criterion was not met.
Three independent SJBE extraction batches were prepared and analyzed. The complete 360 nm chromatogram was recorded for each batch, rutin was defined as the reference peak, reproducible common peaks were aligned, and relative retention time, relative peak area, and whole-profile similarity were calculated. Batch-level fingerprint consistency was accepted at similarity ≥0.90, common-peak relative-retention-time RSD ≤2.0%, and relative-peak-area RSD ≤5.0%. Rutin and quercetin contents were reported for each batch together with the overall mean, standard deviation, and coefficient of variation.
Cell culture and treatments
The mouse BV-2 microglial cell line and the mouse mHypoA-2/10 hypothalamic neuronal cell line were obtained from commercial sources. Cells were thawed from supplier-authenticated stocks, expanded for two passages, verified for species identity using a species-specific PCR method, and confirmed to be mycoplasma-negative before experiments and after thawing each new vial. Cells between passages 3 and 20 were used.
BV-2 and mHypoA-2/10 cells were cultured in high-glucose DMEM supplemented with 10% fetal bovine serum and 1% penicillin-streptomycin at 37 °C in a humidified 5% CO₂ incubator. The medium was replaced every 2 d, and cells were passaged at 70%–80% confluence using 0.25% trypsin-EDTA. Cells were seeded 24 h before treatment, and experiments were initiated at 70%–80% confluence.
For viability screening, BV-2 cells were exposed to SJBE at 0 µg/mL, 25 µg/mL, 50 µg/mL, 100 µg/mL, 200 µg/mL, or 400 µg/mL for 24 h. For inflammatory experiments, cells were preincubated with SJBE at the figure-specified concentration or rutin (50 µmol/L) for 1 h, after which Ang II (100 nmol/L) was added without medium replacement for a further 24 h. For ACE2 inhibition experiments, MLN-4760 (10 µmol/L) was added 30 min before SJBE, followed by Ang II 1 h after SJBE, and all agents were maintained for the 24 h stimulation period. SJBE was used at 100 µg/mL for downstream mechanistic experiments. Ang II and SJBE were prepared in sterile culture medium, whereas MLN-4760 and rutin were prepared as dimethyl sulfoxide stocks. The final dimethyl sulfoxide concentration was maintained at 0.1% (v/v) in every applicable group, including the vehicle control. Three independent culture experiments were performed, and technical wells within each experiment were averaged.
Cell viability assay
BV-2 cells were seeded in 96-well plates at 5 × 10³ cells/well and cultured for 24 h. The medium was replaced with fresh medium containing 0 µg/mL, 25 µg/mL, 50 µg/mL, 100 µg/mL, 200 µg/mL, or 400 µg/mL SJBE. After 24 h, 10 µL CCK-8 reagent was added, and the cells were incubated at 37 °C for 1 h. Absorbance was measured at 450 nm, and cell viability was expressed relative to untreated control wells. Independent culture preparations were used as biological replicates, and technical wells were used only for within-experiment averaging.
ROS level detection
After treatment, BV-2 cells were incubated with serum-free medium containing 10 µmol/L DCFH-DA at 37 °C in the dark for 30 min. Cells were washed twice with PBS, detached, passed through a 40 µm cell strainer, and resuspended in ice-cold PBS. At least 10,000 singlet events per sample were acquired using a flow cytometer, with 488 nm excitation and the FITC/530 ± 15 nm emission channel. The main cell population was gated based on forward- and side-scatter area, doublets were excluded using forward-scatter area versus height, and the fluorescence boundary was established using an unstained control. Spectral compensation was not required for this single-color assay. The same gate template was applied to all coded samples, and the mean fluorescence intensity was reported.
TUNEL staining
After co-culture, lower-chamber neuronal cells were fixed with 4% paraformaldehyde for 30 min, washed three times with PBS, and permeabilized with 0.3% Triton X-100 in PBS for 5 min. A total of 50 µL of TUNEL reaction mixture was added per well, and the cells were incubated at 37 °C in the dark for 60 min. Samples were washed three times, nuclei were counterstained with 1 µg/mL DAPI for 10 min, and the samples were mounted. For each of five independently prepared co-cultures per group, three preselected, non-overlapping fields were acquired at 200× magnification using identical exposure settings. TUNEL-positive nuclei were quantified as a percentage of DAPI-positive nuclei using a fixed threshold in ImageJ. The three fields were averaged to obtain one culture-level value before statistical analysis.
Neuron–microglia co-culture experiment
Twenty-four-well Transwell inserts with 0.4 µm polycarbonate membranes and a growth area of approximately 0.33 cm2 were used to model non-contact communication mediated by soluble factors. mHypoA-2/10 cells were seeded in the lower wells at 1 × 10⁵ cells in 600 µL medium, and BV-2 cells were seeded in the inserts at 2 × 10⁵ cells in 100 µL medium. Cells were cultured overnight before assembly. Ang II, SJBE, MLN-4760, rutin, and their matched vehicles were applied to the upper BV-2 compartment according to the treatment sequence described above. For the additional high-sodium stress groups, NaCl was added to the lower neuronal compartment to increase the final concentration by 30 mmol/L. The assembled co-cultures were maintained for 24 h.
Upper-chamber medium and BV-2 cells were collected for microglial cytokine and signaling analyses, whereas lower-chamber medium and neuronal cells were collected separately for Ang-(1-7), qPCR, immunoblotting, and TUNEL analyses. One assembled insert–lower-well pair was considered one experimental unit, and three independent co-culture experiments were performed. This configuration assessed soluble-factor exchange but could not establish microglia as the exclusive direct target of SJBE. Because no iso-osmotic control was included, the NaCl condition could not distinguish sodium-specific effects from osmotic effects.
Hypertension animal model
Specific-pathogen-free male Wistar rats aged 6–8 weeks and weighing 180–220 g were obtained from commercial sources. Three rats were housed per cage at 22 °C ± 2 °C and 50%–60% relative humidity under a 12 h light/dark cycle with free access to food and water. Bedding was replaced twice weekly, and animals were acclimatized for 7 d. Animals were observed daily, and body weight was recorded twice weekly. Nitric oxide deficiency-induced hypertension was established by oral gavage of L-NAME (40 mg/kg/day in 0.5% CMC-Na; 10 mL/kg) for 3 weeks. Model eligibility was defined before randomization as systolic blood pressure ≥140 mmHg on two consecutive measurements. This model reproduced nitric oxide deficiency-induced hypertension and was not specific for neurogenic hypertension.
Grouping, administration, and sample collection
Rats were allocated to a normal control group and an L-NAME modeling cohort. After model eligibility was established, eligible hypertensive rats were assigned to the model vehicle, SJBE 100 mg/kg/day, 200 mg/kg/day, or 400 mg/kg/day, or valsartan 10 mg/kg/day groups. All gavage formulations were administered once daily at 10 mL/kg, and control groups received the same volume of 0.5% CMC-Na. Six rats per group (36 rats total) constituted the final analyzed sample. Initial enrollment, deaths, and exclusions were reported by group and reason. Daily gavage was continued for 6 weeks while model-derived groups remained under the L-NAME protocol.
At the endpoint, rats were anesthetized with pentobarbital sodium (50 mg/kg, intraperitoneally), and loss of the pedal-withdrawal reflex was confirmed. Blood (4–6 mL) was collected from the abdominal aorta into EDTA tubes. Rats were euthanized by exsanguination under deep anesthesia and transcardially perfused with approximately 200 mL ice-cold 0.9% saline. Blood samples were centrifuged at 2,000 × g for 15 min at 4 °C, and plasma was stored at −80 °C. The brains were removed immediately. Using a rat brain atlas, a coronal block spanning approximately −1.3 mm to −2.1 mm from bregma was prepared, and the bilateral paraventricular nuclei (PVN) were microdissected within approximately 0.3–0.6 mm lateral to the midline and 7.4–8.2 mm ventral to the skull surface. Tissue was snap-frozen for RNA and protein analyses or embedded for preparation of 20 µm frozen sections.
Randomization, allocation concealment, blinding, and exclusion criteria
Eligible hypertensive rats were stratified by body weight and baseline systolic blood pressure and allocated using a computer-generated block-randomization list with blocks of six. An investigator who did not perform dosing or outcome assessment generated the sequence, prepared sequential group codes, and concealed the allocation list until all animals had met the eligibility criteria. The animal was considered the experimental unit for blood-pressure, molecular, biochemical, and histological endpoints.
Gavage formulations, sample tubes, tissue aliquots, sections, images, and assay plates were labeled with randomized three-digit animal codes. Investigators performing blood-pressure measurements, densitometry, ELISA, image acquisition, and image analysis were blinded to treatment allocation. The code was broken only after completion of the prespecified quality checks and primary analysis. Animals were excluded only because of non-treatment-related death, severe illness or injury, >20% body-weight loss, failed gavage, failed model induction, inadequate tail-cuff traces after the repeat procedure, sample loss, or documented assay failure. All exclusions were reported by group and reason. Because no a priori power calculation was available, n = 6/group was treated as an exploratory mechanistic sample.
Tail-cuff blood pressure measurement
Blood pressure was measured using a noninvasive tail-cuff system in a quiet room between 09:00 and 12:00. Rats were habituated for 5 consecutive days by placement in the restrainer for 15 min/day. On each measurement day, animals were warmed at 33 °C ± 1 °C for 10 min, followed by an additional 5 min in the restrainer. The first five inflation-deflation cycles were discarded, and 10–15 additional cycles were recorded. A session was accepted when at least five technically valid readings had a coefficient of variation ≤10%. The animal-level blood pressure value was calculated as the mean of the valid readings. When this criterion was not met, the animal was rested for 10 min, and one cycle set was repeated. If the criterion remained unmet, the session was repeated on the following day, and the original session was recorded as missing rather than individual readings being selectively removed. Tail-cuff measurements provided intermittent estimates of blood pressure and did not provide continuous telemetry.
ELISA
Cell-culture supernatants, PVN homogenate supernatants, and plasma were processed using analyte- and species-matched assay kits: mouse TNF-α, mouse IL-1β, mouse IL-6, rat TNF-α, rat IL-1β, Ang-(1-7), and norepinephrine. Cell supernatants were clarified at 1,000 × g for 10 min at 4 °C. PVN tissue was homogenized at 1:9 (w/v) in ice-cold PBS containing protease inhibitors and centrifuged at 12,000 × g for 15 min at 4 °C. Plasma was thawed only once on ice. Reagents were brought to room temperature for 30 min. A volume of 100 µL of standards and samples was added in technical duplicate and incubated for 2 h at 37 °C, followed by five washes with 300 µL wash buffer. Subsequently, 100 µL biotinylated detection antibody was added and incubated for 1 h at 37 °C. Plates were washed five times, followed by the addition of 100 µL horseradish-peroxidase conjugate and incubation for 30 min at 37 °C. After another washing step, 90 µL TMB substrate was added, and plates were developed for 15 min in the dark. A volume of 50 µL stop solution was then added, and absorbance was measured at 450 nm within 5 min using a microplate reader. Concentrations were calculated using a four-parameter logistic standard curve. Duplicate measurements were accepted when the coefficient of variation was ≤15%; samples outside the calibrated range were diluted and reassayed.
Quantitative Real-Time PCR
Total RNA was extracted from cells or PVN tissue using TRIzol reagent. RNA purity was assessed using the A260/A280 ratio, and 1 µg RNA was used for cDNA synthesis with Evo M-MLV reverse-transcription premix. Each 20 µL qPCR reaction contained 10 µL 2× SYBR Green master mix, 0.4 µL each of 10 µmol/L forward and reverse primers, 2 µL diluted cDNA, and 7.2 µL nuclease-free water. Reactions were performed in technical triplicate on a real-time PCR detection system. The cycling conditions were 95 °C for 30 s, followed by 40 cycles of 95 °C for 5 s and 60 °C for 30 s. A melt curve was subsequently generated from 65 °C to 95 °C in 0.5 °C increments. No-template and no-reverse-transcription controls were included. An assay was accepted only when a single melt peak and a standard-curve efficiency of 90%–110% were observed. Relative gene expression was calculated using the 2⁻ΔΔCt method with Gapdh as the reference gene. Primer sequences used in the study are listed in Table 1.
Western blot
Total protein was extracted from cells or PVN tissue using ice-cold RIPA buffer containing protease and phosphatase inhibitors. Lysates were clarified at 12,000 × g for 15 min at 4 °C, and protein concentration was determined using a BCA assay. A total of 30 µg protein per lane was loaded onto an 8%–12% SDS-polyacrylamide gel selected according to the molecular weight of the target protein and transferred to a 0.45 µm PVDF membrane at 300 mA for 90 min on ice. Membranes were blocked for 1 h at room temperature in 5% bovine serum albumin for phosphoproteins or 5% nonfat milk for other targets. Primary antibodies were incubated overnight at 4 °C at the dilutions specified in the Table of Materials, including total CREB antibody. Membranes were washed three times for 10 min with TBST and incubated with the appropriate horseradish-peroxidase-conjugated secondary antibody (1:5,000) for 1 h at room temperature, followed by additional washing. Bands were detected by enhanced chemiluminescence using nonsaturated exposures. Band density was quantified using ImageJ. Phosphoproteins were normalized to the corresponding total protein, whereas other target proteins were normalized to GAPDH.
Immunofluorescence staining
Coronal frozen sections (20 µm) through the PVN were prepared from approximately −1.3 to −2.1 mm relative to bregma. Three anatomically matched sections per rat were selected at 120 µm intervals. Sections were equilibrated for 20 min at room temperature, washed three times with PBS, and blocked and permeabilized with 0.3% Triton X-100 and 5% goat serum for 1 h. Sections were incubated with Iba-1 or c-Fos primary antibody overnight at 4 °C, washed, and incubated with the appropriate fluorescent secondary antibody for 1 h at room temperature in the dark. Nuclei were counterstained with DAPI for 10 min. Bilateral PVN images were acquired at 200× magnification using an inverted fluorescence microscope, with identical exposure and gain settings maintained within each marker. A predefined ImageJ threshold was applied to coded images, and the Iba-1-positive area or c-Fos-positive nuclei were quantified. Measurements from the three sections were averaged to obtain one animal-level value.
Safety and waste disposal
Methanol, ethanol, paraformaldehyde, DCFH-DA, electrophoresis reagents, and animal tissues were handled in accordance with institutional chemical and biosafety procedures. Volatile solvents and paraformaldehyde were handled in a certified chemical hood, and appropriate personal protective equipment was worn. Halogen-free organic solvent waste and formaldehyde-containing waste were segregated, biological waste was decontaminated, and sharps and animal carcasses were disposed of through approved institutional routes. Local waste categories and emergency procedures were confirmed before use.
Statistical analysis
Data were presented as mean ± standard deviation and analyzed using statistical and graphing software. The independent culture preparation or animal was used as the biological experimental unit, and technical wells, fields, or repeated measurements were averaged within each unit before statistical inference. Distributional assumptions and variance patterns were assessed before parametric analyses. Multi-group endpoint datasets were analyzed using one-way analysis of variance followed by Tukey’s multiplicity-adjusted comparisons. Longitudinal systolic blood pressure was presented descriptively as mean ± standard deviation, and endpoint blood-pressure outcomes were analyzed using one-way analysis of variance with Tukey’s adjustment. Adjusted p values, mean differences, and 95% confidence intervals were reported. A two-sided p < 0.05 was considered statistically significant, and all exclusions and missing values were reported.
Results
Targeted HPLC-quantified SJBE inhibits Ang II-induced microglial inflammation
Ethanol reflux extraction yielded SJBE powder at 25.5 ± 0.7% of the starting material (Figure 1A). Targeted HPLC analysis quantified rutin and quercetin at 276.1 mg/g ± 9.2 mg/g and 12.5 mg/g ± 0.9 mg/g, respectively (Figure 1B), providing quantitative marker characterization of the SJBE preparation used throughout the biological experiments.
SJBE showed no detectable effect on BV-2 cell viability at concentrations up to 200 µg/mL, whereas a significant reduction in viability was observed at 400 µg/mL (Figure 1C). Based on these findings, 100 µg/mL was selected for subsequent mechanistic experiments. Ang II markedly increased the release of TNF-α and IL-1β from BV-2 cells, while SJBE reduced both inflammatory cytokines across the tested non-cytotoxic concentration range (Figure 1D,E), indicating a concentration-dependent anti-inflammatory effect under Ang II stimulation.
SJBE is associated with higher ACE2/MasR markers and lower NF-κB signaling and oxidative stress
Ang II stimulation reduced ACE2 and MasR expression at both the protein and mRNA levels and was accompanied by increased phosphorylation of NF-κB p65. SJBE treatment reversed these changes, increasing ACE2 and MasR expression while reducing p65 phosphorylation (Figure 2A–E).
Consistent with these molecular changes, SJBE reduced TNF-α concentrations from 135 pg/mL ± 12 pg/mL to 55 pg/mL ± 6 pg/mL and IL-1β concentrations from 102 pg/mL ± 10 pg/mL to 42 pg/mL ± 5 pg/mL in Ang II-stimulated culture supernatants. Addition of the ACE2 inhibitor MLN-4760 substantially attenuated these effects, with TNF-α and IL-1β increasing to 125 pg/mL ± 11 pg/mL and 95 pg/mL ± 9 pg/mL, respectively. Rutin treatment reproduced part of the anti-inflammatory response observed with the complete extract (Figure 2F).
SJBE also markedly reduced intracellular DCFH-DA fluorescence after Ang II stimulation, indicating lower intracellular reactive oxygen species accumulation. This reduction was attenuated by MLN-4760 (Figure 2G,H). Together, these findings indicate that the anti-inflammatory and antioxidative effects of SJBE in Ang II-stimulated BV-2 cells are accompanied by restoration of ACE2/MasR signaling and are sensitive to pharmacological inhibition of ACE2.
SJBE limits inflammatory transfer from microglia to hypothalamic neurons
To examine whether the anti-inflammatory effects of SJBE influence microglia-neuron communication, BV-2 cells and mHypoA-2/10 hypothalamic neurons were cultured in a non-contact Transwell system. Ang II stimulation increased TNF-α and IL-1β concentrations in the co-culture system, whereas SJBE reduced TNF-α from 150 ± pg/mL 15 pg/mL to 65 pg/mL ± 8 pg/mL and IL-1β from 110 pg/mL ± 12 pg/mL to 48 pg/mL ± 6 pg/mL (Figure 3A). Ang II also decreased Ace2 and Mas1 expression, both of which were restored toward control levels following SJBE treatment (Figure 3B).
Corresponding changes were observed in hypothalamic neurons cultured in the lower chamber. Exposure to the Ang II-stimulated co-culture environment increased c-Fos and COX-2 expression and altered Avp and Oxtr expression, whereas SJBE attenuated these responses (Figure 3C–G). The protective pattern was weakened by MLN-4760, further linking ACE2 activity to the effects observed in the co-culture system.
These findings demonstrate that SJBE suppresses the inflammatory milieu generated under Ang II stimulation and is accompanied by reduced activation of downstream hypothalamic neuronal responses in the Transwell model.
SJBE is associated with Ang-(1-7) signaling and lower neuronal injury under combined high-sodium/Ang II stress
Ang II exposure reduced Ang-(1-7) concentrations in the co-culture supernatant and increased the neuronal phospho-CREB/CREB ratio. SJBE treatment increased Ang-(1-7) and reduced CREB phosphorylation toward control levels (Figure 4A–C), consistent with restoration of the ACE2/Ang-(1-7)/MasR-associated signaling profile observed in the preceding experiments.
Under combined 30 mmol/L NaCl and Ang II stimulation, hypothalamic neurons exhibited increased Avp expression and a higher proportion of TUNEL-positive cells. SJBE significantly attenuated both responses (Figure 4D–F), indicating reduced neuronal stress and injury under the combined challenge. For the TUNEL analysis, each value represents an independently prepared co-culture, with three microscopic fields averaged within each biological replicate before statistical analysis (n = 5 per group).
SJBE lowers tail-cuff blood pressure and is associated with higher PVN ACE2/Ang-(1-7)/MasR markers in L-NAME-treated rats
Daily L-NAME administration produced a progressive increase in systolic blood pressure during model induction. Following the establishment of hypertension, SJBE treatment reduced weekly tail-cuff blood pressure over the subsequent 6-week intervention period, with the most pronounced response observed in the high-dose group (Figure 5A).
At the study endpoint, systolic blood pressure was 165 ± 8 mmHg in the L-NAME model group compared with 115 mmHg ± 5 mmHg in control rats. High-dose SJBE reduced systolic blood pressure to 130 mmHg ± 6 mmHg. Diastolic blood pressure decreased from 110 mmHg ± 6 mmHg to 85 mmHg ± 4 mmHg, while mean arterial pressure decreased from 128 mmHg ± 7 mmHg to 100 mmHg ± 5 mmHg after high-dose SJBE treatment (all adjusted p < 0.0001 versus the model group; Figure 5B). These findings demonstrate a sustained antihypertensive response to SJBE during the intervention period.
Analysis of PVN tissue revealed parallel molecular changes. L-NAME treatment reduced ACE2 and MasR protein expression as well as Ang-(1-7) concentrations, whereas SJBE restored all three markers in a dose-responsive pattern. In the high-dose group, ACE2 increased from 0.40 ± 0.07 to 1.50 ± 0.18-fold relative expression, MasR increased from 0.45 ± 0.08 to 1.35 ± 0.16-fold, and Ang-(1-7) increased from 9 pg/mg ± 2 pg/mg to 32 pg/mg ± 5 pg/mg protein compared with the model group (Figure 5C–E). Thus, the blood-pressure-lowering effect of SJBE was accompanied by restoration of the ACE2/Ang-(1-7)/MasR-associated molecular profile within the PVN.
SJBE is associated with lower PVN inflammatory-activation and systemic sympathetic-output markers
L-NAME-induced hypertension was accompanied by marked inflammatory activation within the PVN. Tnf and Il1b mRNA levels were elevated in model rats, whereas high-dose SJBE reduced Tnf expression from 4.5 ± 0.5 to 1.8 ± 0.2-fold and Il1b expression from 3.8 ± 0.4 to 1.6 ± 0.18-fold (Figure 6A).
Immunofluorescence analysis showed concordant cellular changes. Iba-1 staining, indicative of microglial activation, was increased in the PVN of L-NAME-treated rats and decreased following SJBE administration. c-Fos staining showed a similar pattern, with lower neuronal activation after SJBE treatment than in the untreated model group (Figure 6B–D).
These central inflammatory changes were accompanied by improvements in circulating inflammatory and sympathetic markers. Plasma TNF-α and IL-1β concentrations were elevated in model rats and substantially reduced following SJBE treatment. In the high-dose group, TNF-α decreased from 45 pg/mL ± 6 pg/mL to 20 pg/mL ± 3 pg/mL and IL-1β from 35 pg/mL ± 5 pg/mL to 15 pg/mL ± 3 pg/mL (Figure 6E). Plasma norepinephrine similarly decreased from 400 pg/mL ± 45 pg/mL to 180 pg/mL ± 25 pg/mL (Figure 6F).
Collectively, these in vivo findings show that SJBE treatment reduces blood pressure in L-NAME-treated rats in parallel with restoration of PVN ACE2/Ang-(1-7)/MasR-associated markers, attenuation of PVN inflammatory activation, and reductions in circulating inflammatory cytokines and norepinephrine.
DATA AVAILABILITY:
The numerical source data underlying the figures and the associated statistical outputs are provided in Supplementary File 1.
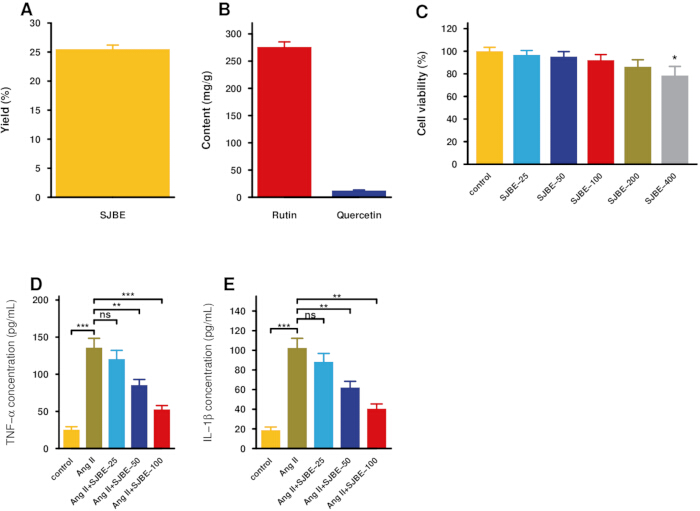
Figure 1: Targeted HPLC quantification and initial BV-2 experiments. (A) Extraction yield. (B) Rutin and quercetin contents in SJBE quantified by targeted HPLC. (C) BV-2 viability after 24 h exposure to SJBE. (D,E) TNF-α and IL-1β in Ang II-stimulated BV-2 supernatants. Data are mean ± SD; n = 3 independent experiments for available quantitative panels. One-way ANOVA with Tukey-adjusted comparisons was used. Abbreviation: ns, not significant; *p < 0.05, **p < 0.01, *** p < 0.001, **** p < 0.0001. Please click here to view a larger version of this figure.
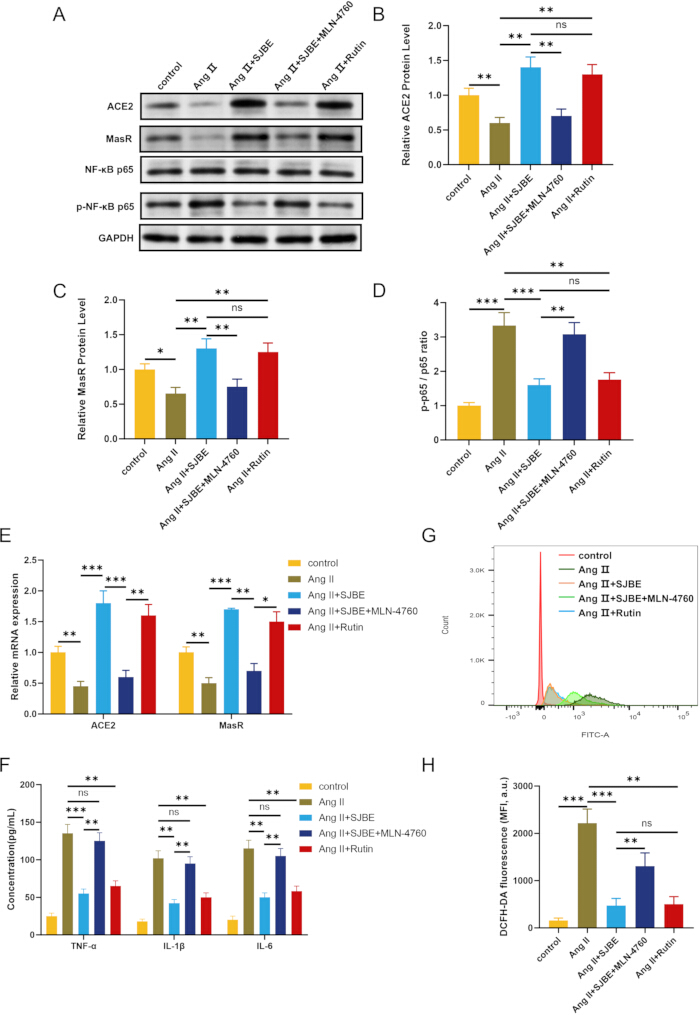
Figure 2: SJBE is associated with higher ACE2/MasR markers and lower NF-κB signaling and oxidative stress in BV-2 cells. (A–D) ACE2, MasR, phospho-p65, and total p65 immunoblots and quantification. (E) Ace2 and Mas1 mRNA. (F) TNF-α, IL-1β, and IL-6. (G,H) ROS flow-cytometry output and fluorescence quantification. Data are mean ± SD; n = 3 independent experiments. One-way ANOVA with Tukey-adjusted comparisons was used. ns, not significant; *p < 0.05, **p < 0.01, ***p < 0.001, ****p < 0.0001. Please click here to view a larger version of this figure.
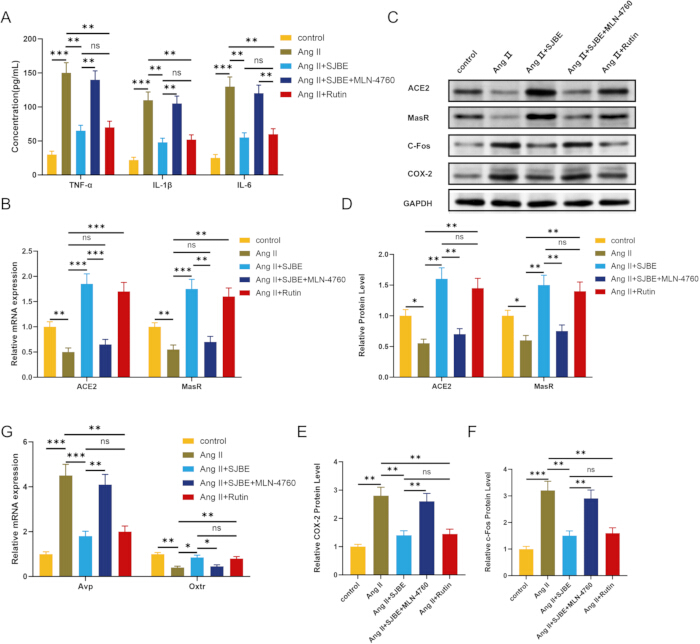
Figure 3: SJBE limits inflammatory signaling in a BV-2/mHypoA-2/10 soluble-factor co-culture model. (A) Cytokines in co-culture supernatant. (B) Ace2 and Mas1 mRNA. (C–F) ACE2, MasR, c-Fos, and COX-2 immunoblots and quantification. (G) Avp and Oxtr expression in lower-chamber neurons. Data are mean ± SD; n = 3 independent experiments. One-way ANOVA with Tukey-adjusted comparisons was used. ns, not significant; *p < 0.05, **p < 0.01, ***p <0.001, ****p < 0.0001. Please click here to view a larger version of this figure.
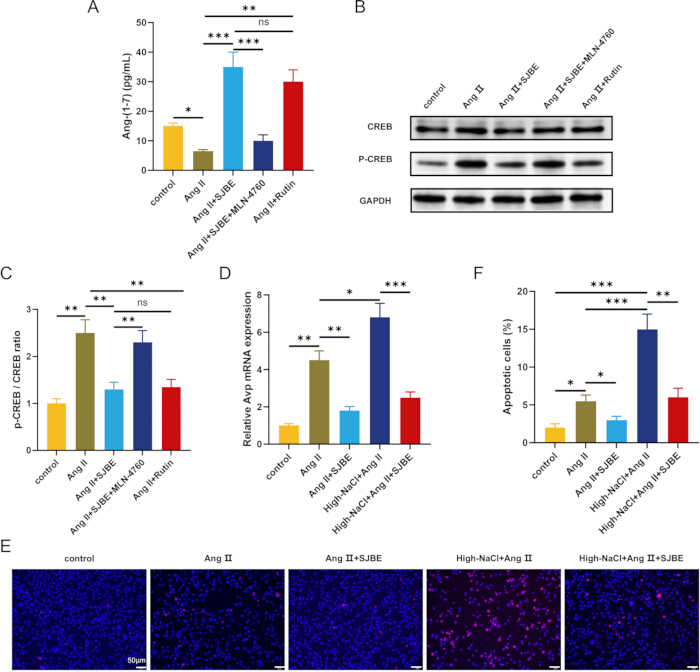
Figure 4: SJBE is associated with Ang-(1-7) signaling and lower stress-associated neuronal injury. (A) Ang-(1-7) in co-culture supernatant. (B,C) Phospho-CREB and total CREB in lower-chamber neurons. (D) Avp under the combined NaCl/Ang II stress condition. (E,F) Representative TUNEL images and quantification; scale bar, 50 µm. Data are mean ± SD; n = 3 independent experiments for panels A, C, and D; n = 5 independent co-culture preparations for panel F, with three fields averaged per preparation. One-way ANOVA with Tukey-adjusted comparisons was used. ns, not significant; *p < 0.05, **p < 0.01, ***p < 0.001, ****p < 0.0001. Please click here to view a larger version of this figure.
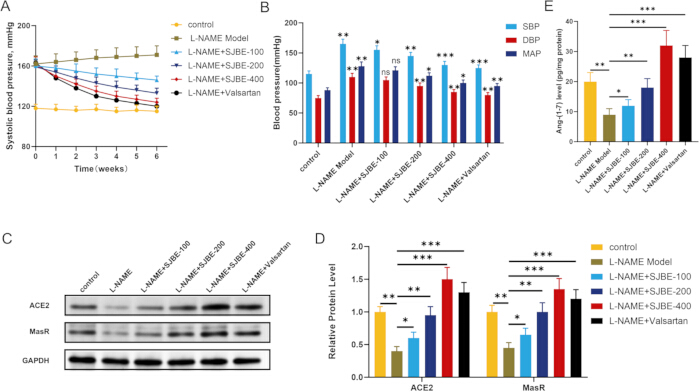
Figure 5: SJBE lowers tail-cuff blood pressure and is associated with higher PVN ACE2/Ang-(1-7)/MasR markers in L-NAME-treated rats. (A) Longitudinal systolic blood pressure. (B) Endpoint systolic, diastolic, and mean arterial pressure. (C,D) ACE2 and MasR immunoblots and quantification in PVN tissue. (E) Ang-(1-7) in PVN homogenates. Data are mean ± SD; n = 6 rats/group. Longitudinal SBP is presented descriptively; endpoint outcomes used one-way ANOVA with Tukey-adjusted comparisons. ns, not significant; *p < 0.05, **p < 0.01, ***p < 0.001, ****p < 0.0001. Please click here to view a larger version of this figure.
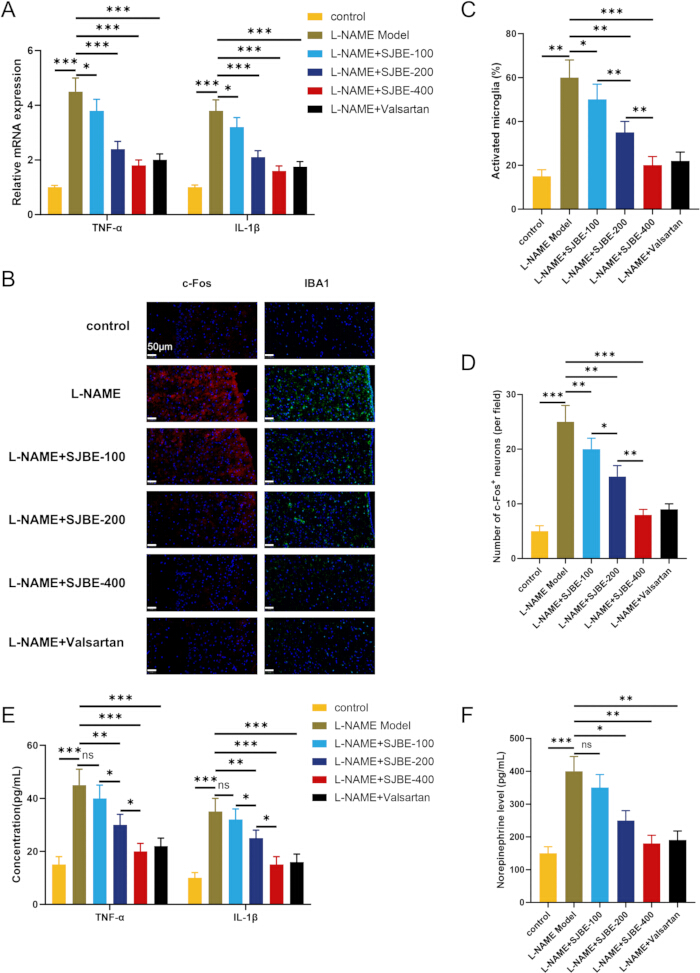
Figure 6: SJBE is associated with lower PVN inflammatory-activation and systemic sympathetic-output markers in L-NAME-treated rats. (A) Tnf and Il1b mRNA in PVN tissue. (B–D) Iba-1 and c-Fos immunofluorescence and quantification; scale bars, 50 µm. (E) Plasma TNF-α and IL-1β. (F) Plasma norepinephrine. Data are mean ± SD; n = 6 rats/group. One-way ANOVA with Tukey-adjusted comparisons was used. *p < 0.05, **p < 0.01, ***p < 0.001, ****p < 0.0001. Please click here to view a larger version of this figure.
| Gene | Forward primer (5'-3') | Reverse primer (5'-3') |
| Gapdh | CACCCACTCCTCCACCTTTGAC | GTCCACCACCCTGTTGCTGTAG |
| Tnf | CCTGCTGCACTTTGGAGTGA | GCTTGAGGGTTTGCTACAACA |
| Il1b | CAGTGAGGAGAATGACCTGTTC | CGAGATGCTGCTGTGAGATT |
| Ace2 | TCCATTGGTCTTCTGCCATCCG | AGACCATCCACCTCCACTTCTC |
| Mas1 | TCCACCATCAATAGCAGCG | AAGCCACCCACATTCAGGC |
| Avp | TCGCCATGATGCTCAACACTACGC | ACACTGTCTCAGCTCCATGTCGGATG |
| Oxtr | GTGTCGAGTTGGACCTCGGG | CCAGGAACAGAATGAGGCACAG |
Table 1: Primer sequences used in the study.
Supplementary File 1: The numerical source data underlying the figures and the associated statistical outputs. Please click here to download this file.
Discussion
This study associates targeted HPLC-quantified S. japonicum bud extract with lower inflammatory signaling in microglial and soluble-factor co-culture models and with lower tail-cuff blood pressure in L-NAME-treated rats. Across the experimental systems, SJBE treatment coincided with higher ACE2/Ang-(1-7)/MasR markers, lower NF-κB activation and oxidative stress, and lower PVN inflammatory-activation markers. These convergent observations support a neuroimmune hypothesis but do not establish that the central pathway mediates the antihypertensive effect.
The results are consistent with reports that S. japonicum flower constituents and rutin reduce inflammatory signaling and neuroinflammation8,9,22, and with evidence that quercetin modulates cardiovascular inflammatory tone and microglial redox signaling12,13. The present study extends these observations to hypothalamic neuroimmune models using a whole botanical extract. Because MLN-4760 weakened the protective response only in vitro, ACE2 is best interpreted as a functional contributor to the cellular anti-inflammatory response rather than as the established mediator of the in vivo blood-pressure effect.
The PVN findings place the cellular observations within a cardiovascular-control region. Previous studies show that microglia and inflammatory cytokines contribute to neurogenic hypertension and sympathetic excitation23,24. Ang-(1-7) signaling within the PVN can regulate sympathetic outflow, whereas Ang II can drive AT1/TLR4-dependent microglial redox stress20,21. Accordingly, the reductions in Iba-1, c-Fos, inflammatory cytokines, and plasma norepinephrine after SJBE treatment are consistent with lower PVN inflammatory activation, but the data do not establish whether these changes caused the reduction in blood pressure or followed systemic improvement.
The Ang II and L-NAME models provide complementary stress contexts rather than identical disease mechanisms. Ang II stimulation induces renin-angiotensin-driven microglial inflammation, whereas L-NAME models nitric-oxide-deficiency hypertension with vascular dysfunction and oxidative stress25,26. Other models also implicate PVN microglial activation in sympathetic regulation14,27, but the present L-NAME study is not specific for PVN-driven neurogenic hypertension. The high-sodium co-culture condition was an in vitro neuronal-stress challenge without an iso-osmotic control and should not be interpreted as an in vivo salt-hypertension model.
For reproducible application, the most critical steps are botanical source documentation, consistent extraction and storage, standardized cell density and treatment timing, correct Transwell compartment assignment, tail-cuff habituation and warming, accurate PVN sampling, and blinded endpoint quantification. Variable extraction yield should prompt checks of material moisture, solvent ratio, reflux conditions, filtration, and lyophilization; HPLC retention shifts should prompt checks of standard preparation, mobile phase, flow rate, temperature, column equilibration, and system suitability. Inconsistent co-culture or tail-cuff results should be addressed by checking insert integrity and treatment placement or by repeating standardized habituation, rather than by selectively excluding measurements. Chromatographic fingerprinting or LC-MS/MS, primary or cell-selective co-culture designs, telemetry, brain/plasma pharmacokinetics, and central ACE2/MasR loss-of-function experiments are appropriate alternatives for questions beyond this protocol. Emerging cross-disciplinary work on neuron–microenvironment remodeling and imaging/artificial-intelligence integration illustrates broader methodological directions for interrogating complex biological systems28,29.
Several limitations define the range of application. MLN-4760 supplied only in vitro functional evidence; no in vivo ACE2/MasR blockade or plasma, brain, or PVN exposure measurement was performed. The 100 µg/mL concentration is therefore a non-cytotoxic in vitro working concentration rather than an in vivo-equivalent exposure. The Transwell design cannot prove microglia-specific action, and the small, non-prospectively powered animal cohort limits precision. Tail-cuff measurements are intermittent and restraint-sensitive. Finally, targeted rutin/quercetin quantification does not establish a chemical fingerprint, full analytical validation, constituent attribution, or independent-batch consistency. Within these boundaries, the protocol supports hypothesis generation regarding SJBE, neuroinflammatory signaling, and blood-pressure regulation rather than a definitive causal or translational claim.
Disclosures
The authors declare no competing interests.
Acknowledgements
The authors acknowledge the institutional and technical support associated with the participating laboratories.
Funding:
This work was supported by the National Natural Science Foundation of China (No. 82600861); the Youth Project of the Fundamental Research Program of Shanxi Province (Nos. 202203021212491, 202303021222205); the General Project of the Fundamental Research Program of Shanxi Province (No. 202203021221210); and the Doctoral Research Startup Project of Shanxi Datong University (No. 2018-B-36).
Materials
| Name | Company | Catalog Number | Comments |
|---|---|---|---|
| 0.4 µm Transwell inserts | Corning Incorporated | 3413 | 24-well polycarbonate membrane insert for BV-2/mHypoA-2/10 non-contact co-culture |
| ACE2 antibody | Cell Signaling Technology | 92485; RRID: AB_3741093 | ACE2 (E5O6J) rabbit mAb; WB 1:1,000; IHC/IF 1:100–1:200 |
| Alexa Fluor 488 anti-rabbit IgG | Cell Signaling Technology | 4412; RRID: AB_1904025 | Immunofluorescence secondary antibody; 1:500 |
| Alexa Fluor 594 anti-rabbit IgG | Cell Signaling Technology | 8889; RRID: AB_2716249 | Immunofluorescence secondary antibody; 1:500 |
| Angiotensin II | Sigma-Aldrich | A9525 | Synthetic Ang II peptide; microglial stimulation |
| Angiotensin-(1-7) assay kit | Cloud-Clone Corp. | CES085Mi | Quantification of Ang-(1-7) |
| BCA protein assay kit | Beyotime Biotechnology | P0012 | Protein quantification |
| BV-2 cells | Procell Life Science & Technology Co., Ltd. | CL-0493; RRID: CVCL_0182 | Mouse microglial cell line; passages 3–20 |
| C18 HPLC column | Shimadzu Corporation | Shim-pack GIST C18; P/N 227-30017-08 | 250 × 4.6 mm, 5 µm; methanol–water (65:35, v/v), 1.0 mL/min, 35 °C |
| CCK-8 reagent | Beyotime Biotechnology | C0038 | Cell viability assay |
| c-Fos antibody | Cell Signaling Technology | 2250; RRID: AB_2247211 | c-Fos (9F6) rabbit mAb; WB 1:1,000; IF 1:200 |
| COX-2 antibody | Cell Signaling Technology | 12282; RRID: AB_2571729 | COX-2 (D5H5) rabbit mAb; WB 1:1,000; IHC/IF 1:200 |
| DCFH-DA probe | Beyotime Biotechnology | S0033S | ROS detection by flow cytometry |
| DMEM, high glucose | Gibco/Thermo Fisher Scientific | 11965092 | Cell culture medium |
| Evo M-MLV Reverse Transcription Premix Kit | Accurate Biotechnology | AG11706 | cDNA synthesis for qPCR |
| Fetal bovine serum | Gibco/Thermo Fisher Scientific | 10099141 | Cell culture supplement |
| Flow cytometer | BD Biosciences | BD Accuri C6 Plus | ROS fluorescence acquisition |
| Fluorescence microscope | Olympus/Evident Scientific | IX73 | Inverted fluorescence microscope for TUNEL and PVN imaging |
| GAPDH antibody | Cell Signaling Technology | 5174; RRID: AB_10622025 | GAPDH (D16H11) rabbit mAb; WB 1:1,000–1:5,000 |
| Goat serum | Beyotime Biotechnology | C0265 | Immunofluorescence blocking reagent |
| HPLC system | Shimadzu Corporation, Kyoto, Japan | Prominence LC-20A | Targeted rutin/quercetin quality-control assay |
| HRP-linked anti-mouse IgG | Cell Signaling Technology | 7076; RRID: AB_330924 | Western blot secondary antibody; 1:3,000–1:5,000 |
| HRP-linked anti-rabbit IgG | Cell Signaling Technology | 7074; RRID: AB_2099233 | Western blot secondary antibody; 1:3,000–1:5,000 |
| Iba-1/AIF-1 antibody | Cell Signaling Technology | 17198; RRID: AB_2820254 | Iba-1/AIF-1 (E4O4W) rabbit mAb; WB 1:1,000; IHC/IF 1:200 |
| IL-6 ELISA kit | Beyotime Biotechnology | PY2782 | Mouse IL-6 quantification |
| L-NAME | Beyotime Biotechnology | S0006 | NOS inhibitor for nitric-oxide-deficiency hypertension |
| Male Wistar rats | Beijing HFK Bioscience Co., Ltd. | Wistar; SCXK (Jing) 2019-0008 | Specific-pathogen-free males, 6–8 weeks, 180–220 g |
| MasR antibody | Alomone Labs | AAR-013; RRID: AB_2039972 | Anti-Mas receptor antibody; WB 1:200; IHC/IF 1:100 |
| mHypoA-2/10 cells | Cedarlane Laboratories Ltd. | CLU176; RRID: CVCL_D384 | Mouse hypothalamic neuronal cell line; passages 3–20 |
| Microplate reader | Thermo Scientific | Multiskan FC; Cat. No. 51119000 | CCK-8 and ELISA absorbance measurements |
| MLN-4760 | Beyotime Biotechnology | SF1197 | ACE2 inhibitor; 10 µmol/L in cell experiments |
| Mouse IL-1β ELISA kit | Invitrogen/Thermo Fisher Scientific | 88-7013A-88 | Mouse IL-1β quantification |
| Mouse TNF-α ELISA kit | Beyotime Biotechnology | PT512 | Mouse TNF-α quantification |
| NF-κB p65 antibody | Cell Signaling Technology | 8242; RRID: AB_10859369 | NF-κB p65 (D14E12) XP rabbit mAb; WB 1:1,000 |
| Noninvasive tail-cuff system | Visitech Systems | BP-2000-R-4 | Rat tail-cuff blood-pressure acquisition and warming system |
| Norepinephrine assay kit | Cloud-Clone Corp. | HEA907Ge | Norepinephrine quantification |
| p-CREB antibody | Cell Signaling Technology | 9198; RRID: AB_2561044 | Phospho-CREB (Ser133) (87G3) rabbit mAb; WB 1:1,000 |
| Penicillin–streptomycin | Gibco/Thermo Fisher Scientific | 15140122 | Cell culture antibiotic supplement |
| Photodiode-array detector | Shimadzu Corporation | SPD-M20A | HPLC UV–visible/PDA detection at 360 nm |
| p-NF-κB p65 antibody | Cell Signaling Technology | 3031; RRID: AB_330559 | Phospho-NF-κB p65 (Ser536) antibody; WB 1:1,000 |
| PVDF membrane | Beyotime Biotechnology | FFP77 | 0.45 µm Western blot membrane |
| Quercetin standard | Beyotime Biotechnology | SM2147 | Quercetin reference standard; 98% purity by HPLC |
| Rat IL-1β ELISA kit | Elabscience Biotechnology Inc. | E-HSEL-R0002 | Rat IL-1β quantification |
| Rat TNF-α ELISA kit | Elabscience Biotechnology Inc. | E-HSEL-R0001 | Rat TNF-α quantification |
| Real-time PCR system | Bio-Rad Laboratories, Inc. | CFX96 Touch; Cat. No. 1855195 | Real-time qPCR amplification and melt-curve analysis |
| RIPA lysis buffer | Beyotime Biotechnology | P0013B | Protein extraction |
| Rutin standard | Beyotime Biotechnology | SM2159 | Rutin reference standard; 98% purity by HPLC |
| Sophorae Flos reference material | National Institutes for Food and Drug Control (NIFDC), Beijing, China | 121270; Batch No. 121270-201403 | Certified botanical reference material for authentication of S. japonicum flower buds |
| Styphnolobium japonicum flower buds | Study botanical material | Not applicable | Dried unopened flower buds authenticated against NIFDC Sophorae Flos reference material |
| Total CREB antibody | Proteintech Group, Inc. | 12208-1-AP; RRID: AB_2245417 | Total CREB rabbit polyclonal antibody for phospho-CREB normalization |
| TRIzol reagent | Invitrogen/Thermo Fisher Scientific | 15596026 | RNA isolation |
| TUNEL apoptosis detection kit | Beyotime Biotechnology | C1086 | Neuronal apoptosis detection |
| Valsartan | Sigma-Aldrich | SML0142 | AT1 receptor antagonist; positive antihypertensive control |
References
- He X, et al. Local and traditional uses, phytochemistry, and pharmacology of Sophora japonica L.: a review. J Ethnopharmacol. 2016;187:160-182.
- Madden E, McLachlan C, Oketch-Rabah H, Calderon AI. United States Pharmacopeia comprehensive safety review of Styphnolobium japonicum flower and flower bud. Phytother Res. 2022;36(5):2061-2071.
- Shi W, et al. Bioactive flavonoids from Flos Sophorae. J Nat Med. 2017;71(3):513-22.
- Paniwnyk L, Beaufoy E, Lorimer JP, Mason TJ. The extraction of rutin from flower buds of Sophora japonica. Ultrason Sonochem. 2001;8(3):299-301.
- Xie Z, et al. Extraction and isolation of flavonoid glycosides from Flos Sophorae Immaturus using ultrasonic-assisted extraction followed by high-speed countercurrent chromatography. J Sep Sci. 2014;37(8):957-965.
- Wang G, et al. Efficient extraction of flavonoids from Flos Sophorae Immaturus by tailored and sustainable deep eutectic solvent as green extraction media. J Pharm Biomed Anal. 2019;170:285-294.
- Le NT, Nguyen TPD, Ho DV, Phung HT, Nguyen HT. A green method to extract rutin from Sophora japonica L. MethodsX. 2023;11:102479.
- Liu Y, et al. Sophora japonica flowers and their main phytochemical, rutin, regulate chemically induced murine colitis in association with targeting the NF-kappaB signaling pathway and gut microbiota. Food Chem. 2022;393:133395.
- Hao G, et al. Rutin inhibits neuroinflammation and provides neuroprotection in an experimental rat model of subarachnoid hemorrhage, possibly through suppressing the RAGE-NF-kappaB inflammatory signaling pathway. Neurochem Res. 2016;41(6):1496-1504.
- Dabeek WM, Marra MV. Dietary quercetin and kaempferol: bioavailability and potential cardiovascular-related bioactivity in humans. Nutrients. 2019;11(10):2288.
- Patel RV, et al. Therapeutic potential of quercetin as a cardiovascular agent. Eur J Med Chem. 2018;155:889-904.
- Han X, et al. Quercetin hinders microglial activation to alleviate neurotoxicity via the interplay between NLRP3 inflammasome and mitophagy. Redox Biol. 2021;44:102010.
- Le K, et al. Quercetin alleviates neonatal hypoxic-ischemic brain injury by inhibiting microglia-derived oxidative stress and TLR4-mediated inflammation. Inflamm Res. 2020;69(12):1201-1213.
- Mi Y, Wu Q, Yuan W, Chen F, Du D. Role of microglia M1/M2 polarisation in the paraventricular nucleus: new insight into the development of stress-induced hypertension in rats. Auton Neurosci. 2018;213:71-80.
- Wei B, et al. Microglia in the hypothalamic paraventricular nucleus sense hemodynamic disturbance and promote sympathetic excitation in hypertension. Immunity. 2024;57(9):2030-42.e8.
- Wang M, et al. Microglia-mediated neuroinflammation: a potential target for the treatment of cardiovascular diseases. J Inflamm Res. 2022;15:3083-3094.
- Xu P, Sriramula S, Lazartigues E. ACE2/ANG-(1-7)/Mas pathway in the brain: the axis of good. Am J Physiol Regul Integr Comp Physiol. 2011;300(4):R804-817.
- Bader M. ACE2, angiotensin-(1-7), and Mas: the other side of the coin. Pflugers Arch. 2013;465(1):79-85.
- Sriramula S, Cardinale JP, Lazartigues E, Francis J. ACE2 overexpression in the paraventricular nucleus attenuates angiotensin II-induced hypertension. Cardiovasc Res. 2011;92(3):401-408.
- Silva AQ, Santos RA, Fontes MA. Blockade of endogenous angiotensin-(1-7) in the hypothalamic paraventricular nucleus reduces renal sympathetic tone. Hypertension. 2005;46(2):341-348.
- Biancardi VC, Stranahan AM, Krause EG, de Kloet AD, Stern JE. Cross talk between AT1 receptors and Toll-like receptor 4 in microglia contributes to angiotensin II-derived ROS production in the hypothalamic paraventricular nucleus. Am J Physiol Heart Circ Physiol. 2016;310(3):H404-115.
- Sun XY, et al. Rutin prevents tau pathology and neuroinflammation in a mouse model of Alzheimer’s disease. J Neuroinflammation. 2021;18(1):131.
- Shi P, et al. Brain microglial cytokines in neurogenic hypertension. Hypertension. 2010;56(2):297-303.
- Shen XZ, et al. Microglia participate in neurogenic regulation of hypertension. Hypertension. 2015;66(2):309-316.
- Simko F, et al. Effect of melatonin on the renin-angiotensin-aldosterone system in L-NAME-induced hypertension. Molecules. 2018;23(2):265.
- Selamoglu Talas Z. Propolis reduces oxidative stress in L-NAME-induced hypertension rats. Cell Biochem Funct. 2014;32(2):150-154.
- Moreira JD, et al. Inhibition of microglial activation in rats attenuates paraventricular nucleus inflammation in Gαi2 protein-dependent, salt-sensitive hypertension. Exp Physiol. 2019;104(12):1892-910.
- Wu Y, Sun R, Ren S, Zengin G, Li M. Neuronal reshaping of the tumor microenvironment in tumorigenesis and metastasis: bench to clinic. Medicine Advances. 2025;3(4):364-371.
- Xu J et al. Advancements in imaging technologies and AI integration for neurodegenerative disease management: a narrative review. Mol Imaging. 2025;24:15353508251393056.