This study presents a reproducible workflow for optimizing immersive exhibition layouts by combining adaptive simulated annealing, stage-dependent proposal selection, and reheating control. The selected layout was implemented in a virtual-reality exhibition environment and evaluated using spatial-cost metrics, participant behavioral logs, and post-experience ratings.
Research Article
Optimizing Immersive Exhibition Space Design Using Adaptive Simulated Annealing with Reheating and Virtual Reality Evaluation
In This Article
Summary
Abstract
Immersive exhibition spaces require layouts that support efficient circulation, clear wayfinding, balanced interaction, and comfortable environmental experience. However, exhibition layouts are often developed through manual design decisions, which makes it difficult to simultaneously evaluate route length, visual accessibility, crowding risk, environmental comfort, and interaction-node distribution. This study developed and evaluated a spatial-design optimization workflow based on adaptive simulated annealing with stage-dependent proposal selection and reheating control. A 36 m x 24 m immersive exhibition hall was constructed with six thematic zones, transition corridors, one rest area, and multiple interaction nodes. Three layout conditions were compared: manual layout, standard simulated annealing layout, and adaptive simulated annealing layout with reheating. The optimization model minimized a weighted spatial cost function that incorporated walking distance, visual accessibility, crowding, environmental comfort, and interaction balance. The selected layouts were implemented in virtual-reality exhibition scenes and evaluated through participant behavioral logs and post-experience ratings. The adaptive algorithm produced a lower final spatial cost, a higher improvement percentage, and fewer iterations to the best solution than standard simulated annealing, with a modest increase in computation time. Participants assigned to the adaptive layout reported higher satisfaction, stronger presence, clearer wayfinding, lower perceived crowding, and lower cognitive load, and they completed the route with shorter walking distance, fewer hesitations, longer dwell time, and broader heatmap coverage. These findings support the workflow as a decision-support approach for the tested exhibition scenario; they do not establish a universally optimal exhibition layout or superiority over all alternative metaheuristics.
Introduction
Immersive exhibition spaces increasingly combine spatial design, digital media, interactive displays, and virtual-reality technologies to create environments in which visitors do not simply observe content but move through, respond to, and interpret the exhibition as a spatial experience. In such settings, the quality of the experience depends not only on the richness of visual or interactive content but also on route continuity, visibility, crowding, environmental comfort, and the distribution of interaction opportunities. Exhibition-space design, therefore, involves a multi-variable problem: a layout must guide visitors efficiently while preserving narrative sequence, perceptual openness, and opportunities for engagement. Studies of museum and exhibition behavior have long shown that visitor experience is shaped by spatial organization, circulation structure, and interpretive accessibility rather than by exhibit content alone1.
Spatial-configuration theory provides a useful foundation for treating exhibition layout as an analyzable design problem. From this perspective, space is not a passive container for objects; it organizes movement, encounter, visibility, and choice. Architectural configuration can influence how people move through an environment and how easily they understand the relationship among spaces2. Visibility-based spatial analysis further supports this view by showing that visual fields and line-of-sight relationships can be modeled as measurable features of spatial cognition and navigation3. These ideas are particularly relevant to immersive exhibitions because visitors must continuously integrate visual information, route decisions, interaction cues, and environmental stimuli as they move through the exhibition.
At the same time, immersive technologies have expanded the ways in which exhibition environments can be designed and tested before physical implementation. Virtual and immersive interfaces allow researchers and designers to examine how users perceive and behave under controlled spatial conditions, enabling comparisons of alternative layouts while keeping content and environmental settings constant4. Reviews of immersive virtual-reality applications show that spatial structure, interaction design, and task clarity are important determinants of user engagement and learning quality5. Meta-analytic evidence also suggests that the level and type of immersion can influence presence, but immersion alone does not guarantee better outcomes if the environment is poorly organized or difficult to navigate6.
The user experience of an immersive exhibition is closely related to presence, cognitive load, and physical comfort. Presence reflects the extent to which users experience themselves as being located within a mediated environment, making it a key outcome in virtual and immersive settings7. However, immersive environments can also create cognitive burden when navigation, interaction, or sensory information is not well coordinated8. For this reason, exhibition-space optimization should not only increase interaction density or visual stimulation. It should support coherent spatial experience, reduce unnecessary route decisions, and minimize avoidable fatigue. Simulator sickness must also be monitored because discomfort can affect both the safety of virtual-reality exposure and the interpretation of user-experience outcomes9.
Despite these requirements, many exhibition layouts are still developed through designers' experience, iterative manual adjustments, or post hoc visitor observation. These approaches remain valuable, but they make it difficult to evaluate multiple layout constraints simultaneously. Spatial design for immersive exhibitions can be formulated as a constrained optimization problem that considers route length, visibility, crowding, comfort, and interaction distribution jointly. Simulated annealing is suitable for this type of problem because it can search large, irregular solution spaces while allowing the controlled acceptance of non-improving intermediate solutions, thereby helping to escape local optima10. Its acceptance logic follows the Metropolis rule11, while the more general Metropolis-Hastings framework introduces a forward-to-reverse proposal density ratio when the proposal kernel is asymmetric12. In the present implementation, the four conditional proposal kernels are symmetric; therefore, formal derivation shows that the Hastings ratio is unity for reversible feasible moves. The method is consequently described as adaptive simulated annealing with Metropolis acceptance and reheating rather than as a distinct Metropolis-Hastings sampler.
Adaptive simulated-annealing variants have long employed nonuniform neighborhood selection, cooling-schedule modification, reheating, restart strategies, and hybrid search components13,14. The present implementation should therefore be read as an application-specific configuration rather than as a new metaheuristic primitive. Its contribution is the explicit coupling of a stage-dependent four-move proposal schedule and reheating with exhibition-specific feasibility constraints, a transparent multi-component spatial-cost function, and participant-level virtual-reality validation15. This narrower positioning directly distinguishes the present workflow from claims of a fundamentally new optimization principle. Stage-dependent proposal selection was expected to shift the search from broader sequence/pathway exploration to local spatial refinement, while reheating restored search mobility after stagnation. This exploration–exploitation balance was expected to reduce premature trapping in local minima and increase the likelihood of reaching a lower-cost feasible layout within the same nominal iteration budget.
This study proposes a reproducible workflow that integrates adaptive simulated annealing, stage-dependent proposal selection, reheating control, a multi-component spatial-cost model, and participant-level virtual-reality evaluation. The methodological contribution is application-oriented and reproducibility-focused rather than a claim of a fundamentally new optimization principle16. The method compares a manual layout, a standard simulated annealing layout, and an adaptive simulated annealing with reheating layout in a controlled virtual-reality exhibition environment. The study examines both algorithmic outcomes and participant-level outcomes, including final spatial cost, improvement percentage, presence, wayfinding clarity, satisfaction, cognitive load, walking distance, hesitation count, dwell time, and heatmap coverage. The primary hypothesis was that the adaptive method would achieve a lower final spatial cost than standard simulated annealing; at the participant level, the corresponding layout was expected to improve overall satisfaction and route-efficiency outcomes relative to the manual and standard simulated annealing layouts. This framing follows the broader logic of metaheuristic design methods, in which computational search supports rather than replaces human design judgment17.
Protocol
The study protocol was reviewed by Henan Agricultural University and was determined to be exempt from formal ethics review on December 20, 2025. No separate ethics approval or exemption reference number was issued by the reviewing body. Written informed consent was obtained from all participants before enrollment.
Participant preparation
Adult participants aged 18–60 years with normal or corrected-to-normal vision were recruited. Participants who reported severe vestibular disorders, uncontrolled epilepsy, severe visual impairment, recent major surgery, or previous serious discomfort during virtual-reality exposure were excluded. Each participant completed a screening form before the experiment. Age group, gender, education level, prior virtual-reality experience, and prior museum or exhibition-visiting frequency were recorded as control variables.
Participants were assigned to one of three layout conditions using a computer-generated randomization list: manual layout, standard simulated annealing layout, or adaptive simulated annealing with reheating layout. A between-subject design was used to avoid learning effects across layouts. The allocation ratio was set to 1:1:1, with 60 participants assigned to each condition and 180 participants in total. Age group, gender, education level, previous virtual-reality experience, and museum/exhibition-visiting frequency were recorded before allocation for descriptive assessment of participant characteristics; these variables were not used as post-randomization exclusion criteria.
Exhibition-space model preparation
A rectangular immersive exhibition hall measuring 36 m x 24 m with a ceiling height of 4.5 m was constructed. The total usable floor area was set to 864 m2. One entrance and one exit were placed on opposite short sides of the hall. Both the entrance and exit widths were set to 3.0 m and were kept fixed across all layout conditions.
The exhibition hall was divided into six thematic exhibition zones, two transition corridors, one rest area, and one main visitor route. The allowable area for each thematic zone was set to 80–130 m2, and the rest-area allocation was set to 40 m2. The allowable main-pathway width was set to 1.8–3.5 m. Eight to twelve interaction nodes were placed in each layout. Each interaction node was defined as a point where participants could stop, activate digital content, view an exhibit, or change direction.
The floor plan was discretized into 0.5 m x 0.5 m grid cells. The grid was used for visibility analysis, route-continuity checking, heatmap coverage calculation, and local density estimation. Each thematic zone was represented by its center coordinate, boundary polygon, area, and route-sequence position. Each interaction node was represented by its coordinate, associated zone, trigger radius, and clearance area.
Spatial configuration was treated as the core design variable because exhibition layout, visibility, and route structure affect visitor movement, wayfinding, and spatial cognition18. The complete workflow, from spatial model construction to layout optimization, virtual-scene implementation, participant testing, and statistical analysis, is shown in Figure 1.
Layout parameters and feasibility constraints
The same feasibility constraints were applied to all layout conditions. First, all thematic zones were required to remain inside the 36 m x 24 m boundary. Second, thematic zones were not allowed to overlap. Third, the main visitor route was required to connect the entrance, six thematic zones, a rest area, and the exit without interruption. Fourth, interaction nodes were not allowed to block the main path. Fifth, each interaction node was required to retain a clearance radius of at least 1.2 m. Sixth, the predicted local density on the main route was required to be no more than 1.50 persons/m2. Seventh, the final route was required to contain no dead ends or disconnected subpaths.
The same scene scale, route rules, environmental targets, and interaction settings were used across the three layout conditions. Before the optimization algorithms were run, the hall dimensions, functional-zone parameters, pathway-width range, interaction-node settings, feasibility thresholds, virtual-reality settings, objective-function weights, algorithm parameters, and outcome definitions were recorded. These parameters defined the reproducible boundary of the protocol and are summarized in Table 1.
Spatial-cost function
Each candidate layout was evaluated using the weighted spatial-cost function:

where F(x) is the total spatial cost of layout x. Cdistance(x) is the walking-distance cost, Cvisibility(x) is the visual-accessibility cost, Ccrowding(x) is the crowding cost, Ccomfort(x) is the environmental-comfort penalty, and Cinteraction(x) is the interaction-balance penalty. A lower F(x) indicates a more favorable layout.
The walking-distance cost was calculated as:

where Lx is the total route length of layout x in meters. A reference maximum route length of 120 m was used.
The visual-accessibility cost was calculated as:
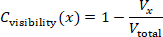
where Vx is the thematic-zone frontage visible from the main route, and Vtotal is the total frontage length of all thematic zones. Line-of-sight rays were emitted every 0.5 m along the visitor route. Exhibition partitions, walls, and zone boundaries were treated as occluding objects.
The crowding cost was calculated as:
Ccrowding(x) = min(Dmax / 1.50, 1)
where Dmax is the maximum predicted local density in persons/m2. An upper density threshold of 1.50 persons/m2 was used for the main route.
The environmental-comfort penalty was calculated as:

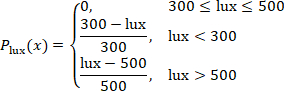
The illuminance penalty was set as:
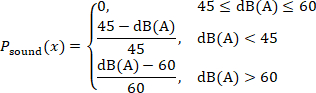
The sound-pressure penalty was set as:
The carbon dioxide penalty was set as:

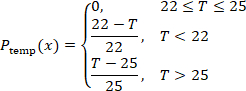
The temperature penalty was set as:
The interaction-balance penalty was calculated as:

where sk is the route distance between two adjacent interaction nodes. A lower value indicates a more even distribution of interaction opportunities along the visitor route.
Environmental comfort is included because lighting, sound, air quality, and temperature influence fatigue, comfort, and willingness to remain in exhibition environments19. The environmental ranges are protocol control targets rather than universal regulatory limits. The 300–500 lx illuminance band is consistent with current Chinese building and museum-lighting guidance; the carbon-dioxide target of <900 ppm is deliberately more conservative than the 1,000 ppm daily-average limit in GB/T 18883-202220,21; the 22–25 °C temperature band is within commonly accepted thermal-comfort conditions for lightly active occupants22; and 45–60 dB(A) is used as a controlled ambient-sound band rather than as a statutory indoor-noise limit23,24.
The objective-function weights were selected as explicit, scenario-specific design priorities rather than as universal coefficients or preference estimates fitted from participant outcomes. Walking distance and crowding each received a weight of 0.25 because route efficiency and congestion control were treated as the two primary operational constraints; visual accessibility received 0.20 because visibility affects orientation and exhibits exposure; environmental comfort and interaction each received 0.15 so that these factors influence the search without dominating circulation-related terms. Because exhibition priorities can differ by context, the protocol tests local weight robustness by perturbing each weight by ±10% individually and proportionally renormalizing the remaining weights so that the total remains 1.00. The resulting coefficients should therefore be interpreted as protocol-specific design settings that can be recalibrated for artistic, historical, scientific, or commercial exhibitions.
Manual layout generation
The manual layout was created as the baseline condition. The six thematic zones were arranged in a conventional narrative sequence from entrance to exit. The rest area was placed near the middle section of the route. The initial main-pathway width was set to 2.2 m. Interaction nodes were placed near the entrance of each thematic zone and at major route-turning points. The manual layout was checked against all feasibility constraints. Zone boundaries were adjusted only when a constraint was violated. After the layout became feasible, total route length, visible frontage ratio, maximum local density, environmental-comfort penalty, interaction-spacing coefficient, and total spatial cost were recorded.
Standard simulated annealing
The feasible manual layout was used as the initial state. The initial temperature was set to 100, the cooling coefficient to 0.95, the maximum number of iterations to 1,500, and the stagnation threshold to 200 iterations. The algorithm was run with 30 independent random seeds. These values were operational protocol settings used to define a matched computational budget; they were not presented as literature-derived universal constants or outcome-tuned optima. T₀ = 100 permitted broad early exploration, α = 0.95 provided gradual cooling, 1,500 iterations provided each run with the same upper search budget, and the 200-iteration stagnation threshold prevented prolonged continuation after no improvement. The same temperature and maximum-iteration settings were used for the adaptive method so that differences were attributable to proposal scheduling and reheating rather than to a larger nominal search budget.
At each iteration, one neighboring layout was generated by applying one move: moving one thematic zone by 0.5–2.0 m, swapping the sequence positions of two thematic zones, adjusting one pathway segment by 0.1–0.3 m, or moving one interaction node by 0.5–1.5 m. A proposed layout was rejected immediately if it violated any feasibility constraint.
If the proposed layout was feasible and had a lower spatial cost, it was accepted. If it had a higher spatial cost, it was accepted according to the probability equation:
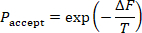
where ΔF is the increase in spatial cost, and T is the current temperature. The temperature after each iteration was updated using:
Tnew = 0.95Told
Each run was stopped when the maximum iteration count was reached or when the best spatial cost did not improve for 200 consecutive iterations. Simulated annealing was considered suitable for this task because exhibition layout optimization is a combinatorial spatial problem that cannot be solved efficiently by exhaustive search.
Standard simulated annealing was used as the primary numerical algorithmic benchmark because it shared the same layout encoding, feasibility rules, objective function, initialization, temperature schedule, and computational budget as the adaptive condition. Standard simulated annealing was the sole numerical metaheuristic comparator in this study and therefore functioned as a matched ablation-like baseline for the added proposal scheduling and reheating at the workflow level. Genetic algorithms, particle swarm optimization, ant colony optimization, and learning-based optimizers were not part of the experiment; accordingly, performance claims were restricted to the matched standard-SA baseline. For each run, the random seed, initial spatial cost, final spatial cost, improvement percentage, number of iterations to the best solution, runtime, acceptance rate, and feasibility status were stored. Improvement percentage was calculated using the equation:

Adaptive simulated annealing with reheating
The same initial layout, feasibility constraints, initial temperature, cooling coefficient, maximum iteration count, and 30 random seeds as the standard simulated annealing condition were used. The adaptive algorithm differed only in its stage-dependent move-class probabilities and reheating rule, while retaining the standard Metropolis acceptance rule for feasible candidate layouts. Four proposal move classes were defined: local displacement (L), zone-sequence swap (S), pathway-width adjustment (W), and interaction-node relocation (N). During the first 40% of iterations, the move-class probabilities were set to pL = 0.20, pS = 0.35, pW = 0.30, and pN = 0.15. During the final 60%, they were set to pL = 0.35, pS = 0.15, pW = 0.20, and pN = 0.30. This change in move-class frequency shifted the search from broader sequence/pathway exploration toward local spatial refinement and adjustment of interaction nodes.
At iteration t, the full proposal density was expressed as q(x′|x,t) = pm(t)qm(x′|x), where m ∈ {L,S,W,N} represented the selected move class and pm(t) represented its phase-specific probability. For local displacement, one of six thematic zones was selected uniformly, a displacement direction was drawn uniformly on [0,2π), and a displacement magnitude was drawn uniformly on [0.5,2.0] m; therefore, qL was proportional to (1/6)(1/2π)(1/1.5). For a zone-sequence swap, one of the 15 unordered zone pairs was selected uniformly, giving qS = 1/15. For pathway-width adjustment, one of J adjustable pathway segments was selected uniformly, and a signed change was drawn uniformly from [−0.3,−0.1] ∪ [0.1,0.3] m, giving qW = (1/J)(1/0.4). For interaction-node relocation, one of K current interaction nodes was selected uniformly, a direction was drawn uniformly on [0,2π), and a displacement magnitude was drawn uniformly on [0.5,1.5] m, giving qN proportional to (1/K)(1/2π)(1/1.0). Constraint-violating proposals were rejected and contributed a self-transition.

For every reversible feasible move in this implementation, the conditional proposal kernel was symmetric: qm(x′|x) = qm(x|x′). Because the same phase-specific move-class probability pm(t) was applied to the forward and reverse transition at a given iteration, q(x|x′,t)/q(x′|x,t) = 1. The acceptance probability, therefore, is reduced to the standard simulated-annealing Metropolis rule, A(x→x′) = min{1, exp[−(C(x′)−C(x))/T]}. No non-trivial Hastings correction was applied; the method is therefore termed adaptive simulated annealing with reheating rather than a Metropolis-Hastings sampler25.
Reheating was applied when the best spatial cost did not improve for 150 consecutive iterations, thereby intentionally intervening before the 200-iteration stagnation stop used in standard simulated annealing. The current temperature was increased by 10%, and up to 3 reheating events were allowed per run. The same algorithm-performance variables as in the standard simulated annealing condition were stored. The experiment evaluated the combined stage-dependent proposal schedule plus reheating configuration and therefore did not estimate the independent causal contribution of each component. Stepwise pseudocode for the exact proposal, feasibility, Metropolis acceptance, temperature update, reheating, and output storage sequence was provided in Supplementary File 3.
Treheated = 1.10Tcurrent
Final layouts
One final layout was selected for each condition. The feasible manual layout was used for the manual condition. Under the standard simulated annealing conditions, the run with the lowest final spatial cost among the 30 runs was selected. For the adaptive simulated annealing with reheating condition, the feasible run with the lowest final spatial cost among the 30 runs was selected. Before the selected layouts were exported, a final feasibility check confirmed that all zones were inside the boundary, no zones overlapped, the route was continuous, the entrance and exit were unchanged, interaction-node clearance was at least 1.2 m, maximum density remained below 1.50 persons/m2, and all thematic zones were reachable from the main route.
Virtual exhibition scenes
Three virtual exhibition scenes were built in Unity 2022.3.22f1 LTS (Unity Technologies) using XR Interaction Toolkit 2.5.4. The scenes were presented through a Meta Quest 2 head-mounted display (Meta Platforms) using six-degree-of-freedom head and controller tracking. Exhibition content, visual style, object models, signage style, lighting assets, ambient sound, interaction mechanism, and navigation instructions were kept identical across the three scenes. Only spatial arrangement, route sequence, pathway width, and interaction-node placement varied.
The virtual camera height was set to 1.65 m, and the walking speed was set to 1.2 m/s. Teleportation was disabled. The same starting trigger at the entrance and the same completion trigger at the exit were used. The interaction-node trigger radius was set to 1.0 m. Whether each interaction node was visited was recorded.
The same six thematic contents were used in all scenes. Each theme was assigned to its corresponding zone, regardless of layout conditions. Wall height, partition style, media display size, text density, and exhibit object scale were kept constant. Virtual-reality environments were considered appropriate for this protocol because they enabled the examination of spatial presence, route clarity, and visitor experience under controlled layout conditions26.
The hardware, software, environmental-monitoring tools, questionnaire/codebook files, and analysis resources required to reproduce the protocol were listed in the Table of Materials and organized as Supplementary Files 1–3. Research resources with registered Research Resource Identifiers (RRIDs) were listed by RRID in the Table of Materials.
Participant session
One participant was tested at a time. The participant sat for 2 min before the session. The head-mounted display was fitted, and the interpupillary distance was adjusted according to the participant's comfort. A 2 min practice scene that was not part of the exhibition was provided. The practice scene was used only to familiarize the participant with movement and interaction.
Because one participant was tested at a time, crowding in the protocol was represented by model-based density estimates rather than emergent simultaneous group movement. Multi-user co-presence, interpersonal avoidance, and dynamic crowd interactions were therefore not directly simulated and were considered when interpreting crowd-related outcomes.
After practice, the assigned exhibition scene was started. The participant was instructed to enter the exhibition, follow the route naturally, interact with marked nodes, and exit after completing all six thematic zones. Additional route guidance was provided only if the participant could not proceed for more than 30 s. Completion time, dwell time, walking distance, hesitation count, interaction-node visits, and trajectory coordinates were recorded automatically.
The session ended when the participant reached the exit trigger. The head-mounted display was removed, and the participant was allowed to rest for 3 min. The participant completed the post-experience questionnaire immediately after the rest period.
Behavioral, environmental, and questionnaire outcomes
Completion time was defined as the time from entrance-trigger activation to exit-trigger activation. Dwell time was defined as the total time spent inside thematic zones and interaction-node areas. Walking distance was defined as cumulative path length from trajectory coordinates. Hesitation count was defined as the number of pauses longer than 3 s outside interaction-node areas. Heatmap coverage was calculated using:

Average illuminance was recorded using a Testo 540 illuminance meter (Testo SE & Co. KGaA), sound pressure level using a Testo 816-1 Class 2 sound level meter (Testo SE & Co. KGaA), carbon-dioxide concentration using a Testo 535 CO₂ measuring instrument (Testo SE & Co. KGaA), and ambient temperature using a Testo 605i thermohygrometer (Testo SE & Co. KGaA). The same monitoring positions were used across the three scene conditions. Illuminance was recorded in lx, sound pressure level in dB(A), carbon dioxide in ppm, and temperature in °C.
Presence and spatial-presence domains were measured using the 7-point scoring structure specified in the study protocol. These constructs were interpreted with reference to the validated Presence Questionnaire (PQ) framework of Witmer and Singer and the Igroup Presence Questionnaire (IPQ) framework of Schubert et al.27. The study variables were reported as domain-level 7-point scores rather than as standard PQ or IPQ total scores. For simulator sickness, the Simulator Sickness Questionnaire symptom framework was used together with the prespecified 0–30 study summary variable; higher values indicated greater discomfort. This 0–30 study summary was reported separately from the standard weighted SSQ Total Severity score, consistent with the distinction between simulator-sickness measurement conventions and cybersickness reporting28. Interaction quality, wayfinding clarity, visual comfort, acoustic comfort, thermal comfort, perceived crowding, cognitive load, and overall satisfaction were measured using the study-specific, multi-item, 7-point rating scales. Supplementary File 2 documented the construct source, score range, and reporting convention for each domain.
Study outcomes
The primary algorithmic outcome was defined as the final spatial cost. The primary visitor-experience outcome was defined as overall satisfaction. Secondary algorithmic outcomes were defined as the improvement percentage, the number of iterations to the best solution, the runtime, and the acceptance rate. Secondary visitor-experience outcomes were defined as presence, spatial presence, interaction quality, wayfinding clarity, visual comfort, acoustic comfort, thermal comfort, perceived crowding, cognitive load, simulator sickness, completion time, dwell time, walking distance, hesitation count, and heatmap coverage. Completion time and walking distance were used to evaluate route efficiency. Hesitation count and wayfinding clarity were used to evaluate navigation quality. Presence, spatial presence, interaction quality, and dwell time were used to evaluate immersive engagement. Perceived crowding, cognitive load, comfort ratings, and simulator sickness were used to evaluate experiential burden.
Data cleaning and quality control
All participant records were checked before analysis. It was confirmed that each record had a single participant identifier, a single condition label, complete behavioral logs and questionnaire scores, and no duplicate identifiers. Presence, spatial-presence, and study-specific experience ratings were restricted to their defined 1–7 ranges. The simulator-sickness study summary variable was restricted to its prespecified 0–30 range. The questionnaire/codebook file was checked to confirm that it documented the construct source, response range, domain construction, and derived-score definitions used in the analysis.
A participant record was excluded if the session was not completed, completion time was less than 3 min or greater than 25 min, heatmap coverage was less than 10%, the trajectory log was incomplete or technically invalid, walking distance was less than 20 m in conjunction with an incomplete/invalid trajectory record, or the participant requested early termination. No upper walking-distance cutoff was applied; walking distance was retained as a continuous study outcome across its valid observed range. An algorithm run was excluded from layout selection if it violated any feasibility constraint. Random seeds, layout files, algorithm outputs, questionnaire/codebook files, and analysis scripts were preserved for reproducibility. Random-seed preservation was necessary because stochastic optimization outputs could vary with initialization and proposal behavior29.
Algorithm performance
The 30 standard simulated annealing runs and 30 adaptive simulated annealing with reheating runs were analyzed. Initial spatial cost, final spatial cost, improvement percentage, iterations to best solution, runtime, and acceptance rate were summarized as mean ± standard deviation (SD), and 95% confidence intervals were reported for the group means and between-algorithm differences.
Normality was assessed using quantile-quantile (Q-Q) plots and the Shapiro-Wilk test. Homogeneity of variance was assessed using Levene's test. The two algorithmic conditions were compared using independent-samples t tests when assumptions were met. Mann-Whitney U tests were used when assumptions were not met. Two-sided p values, 95% confidence intervals, and effect sizes were reported. Cohen's d was calculated using the equation

where:

Rank-biserial correlation was used for nonparametric comparisons. Sensitivity analysis was conducted by changing each objective-function weight by ±10% individually and proportionally renormalizing the remaining four weights so that the total remained 1.00. The final spatial cost and improvement percentage were recalculated for each alternative weight vector. The algorithmic comparison was considered stable when the adaptive simulated annealing with reheating condition retained a lower final spatial cost across the alternative weight settings.
Participant outcome analysis
Participant outcomes across the three layout conditions were analyzed using IBM SPSS Statistics 27.0 (IBM Corp.). Continuous variables were reported as mean ± SD, and categorical variables were reported as counts and percentages. Normality was assessed using Q-Q plots and the Shapiro-Wilk test. Homogeneity of variance was assessed using Levene's test. One-way analysis of variance (ANOVA) was used for normally distributed outcomes with acceptable homogeneity of variance. Welch's ANOVA was used when the assumption of homogeneity of variance was violated. Kruskal-Wallis tests were used for non-normal outcomes.
Pairwise comparisons were conducted among the manual layout, standard simulated annealing layout, and adaptive simulated annealing with reheating layout. The three pairwise comparisons within each outcome were adjusted using the Holm method. The 95% confidence intervals were reported together with adjusted p-values. Eta-squared was reported for standard ANOVA, omega-squared for Welch's ANOVA, epsilon-squared for Kruskal-Wallis tests, and standardized mean differences for pairwise comparisons. As a supplementary robustness analysis, pairwise Welch contrasts were calculated from the group mean, SD, and n = 60 per group. Welch degrees of freedom, two-sided p values, Holm-adjusted p values, 95% CIs for mean differences, and Hedges g were calculated. This supplementary analysis used the group-level statistics and was presented in Supplementary Table 1.
The randomized 1:1:1 three-group comparison was treated as the primary analysis. Age group, gender, education level, previous virtual-reality experience, and museum/exhibition-visiting frequency were recorded before allocation to characterize the sample and identify obvious imbalance. The trial was not designed or powered for subgroup interaction tests, and no prespecified moderator model was included; these characteristics were therefore treated as contextual variables rather than demonstrated moderators. Random allocation provided design-based control over baseline characteristics, while the residual influence of prior VR familiarity was explicitly retained as a limitation. Eta-squared was calculated using
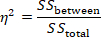
Epsilon-squared for Kruskal-Wallis tests was calculated as:
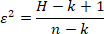
where H is the Kruskal-Wallis test statistic, k is the number of groups, and n is the total sample size.
Overall satisfaction, presence, wayfinding clarity, perceived crowding, cognitive load, completion time, walking distance, hesitation count, and heatmap coverage were prioritized in the interpretation because these variables directly reflected spatial efficiency and immersive visitor experience.
Results
Participant flow and data completeness
A total of 180 participants completed the immersive exhibition experiment and were included in the final analysis. The three layout conditions were balanced, with 60 participants assigned to the manual layout, 60 to the standard simulated annealing layout, and 60 to the adaptive simulated annealing with reheating layout. No participant record was excluded after data quality control. All behavioral logs and post-experience questionnaire scores were complete. Environmental measurements were recorded as experimental control checks rather than participant outcomes; the same monitoring positions and prespecified target ranges were used across all three scene conditions, and these variables were not included in the between-condition inferential analysis.
The final analysis included 180 participant-session records and 60 algorithm runs from the two optimization conditions. The manual layout served as the non-optimized baseline. The standard simulated annealing and adaptive simulated annealing with reheating conditions each included 30 independent optimization runs. The main algorithmic, behavioral, and questionnaire outcomes are summarized in Table 2.
Questionnaire reliability and score distribution
Before comparing layout conditions, the internal consistency of the multi-item questionnaire domains was examined. The questionnaire domains showed acceptable to good reliability, with Cronbach’s alpha values ranging from 0.78 to 0.91. Presence, spatial presence, interaction quality, wayfinding clarity, comfort-related ratings, cognitive load, and overall satisfaction all met the predefined reliability threshold of 0.70.
Score distributions were also reviewed before group comparison. No substantial ceiling effect or floor effect was observed for the primary visitor-experience outcome. Overall satisfaction, presence, wayfinding clarity, and cognitive load showed sufficient variability across the three layout conditions. Simulator sickness scores were right-skewed, as expected for short-duration virtual-reality exposure, and were therefore interpreted alongside distributional checks and nonparametric sensitivity testing.
Algorithm performance
The adaptive simulated annealing with reheating algorithm produced a lower final spatial cost than standard simulated annealing. The mean final spatial cost was 0.475 ± 0.019 (95% CI, 0.468–0.482) for standard simulated annealing and 0.424 ± 0.016 (95% CI, 0.418–0.430) for Adaptive SA-R. The mean between-algorithm difference (Adaptive − Standard) was −0.051 (95% CI, −0.060 to −0.042), with Welch t = 11.25, p < 0.001, and Cohen's d = 2.90.
The improvement percentage was higher in the adaptive algorithm condition: 24.91% ± 3.22% for standard simulated annealing and 32.54% ± 3.29% for Adaptive SA-R, a mean difference of +7.63 percentage points (95% CI, 5.95–9.31; Welch t = 9.07; p < 0.001; d = 2.34). Adaptive SA-R reached the best solution in 722.20 ± 90.19 iterations versus 925.47 ± 86.38 for standard simulated annealing, a difference of −203.27 iterations (95% CI, −248.91 to −157.63; Welch t = 8.92; p < 0.001; d = 2.30).
Runtime was modestly longer for Adaptive SA-R. Mean runtime increased from 47.83 ± 9.42 s to 55.86 ± 9.49 s, a mean increase of 8.03 s (95% CI, 3.14–12.92; Welch t = 3.29; p = 0.002; d = 0.85), corresponding to a 16.8% relative increase. Acceptance rate increased from 0.294 ± 0.045 to 0.372 ± 0.054, a mean difference of +0.078 (95% CI, 0.052–0.104; Welch t = 6.08; p < 0.001; d = 1.57). In return, the mean final spatial cost was 10.7% lower, and the number of iterations to the best solution was 22.0% lower. This is interpreted as a modest computational cost within the tested problem size rather than as evidence of universal computational superiority.
The convergence curves showed that the adaptive simulated annealing with reheating algorithm reduced spatial cost more rapidly during the early search stage and maintained a lower cost trajectory during later iterations. Across independent runs, the adaptive algorithm showed numerically lower variability in final spatial cost; this descriptive difference was not subjected to a separate formal variance test. The algorithm performance results, including final spatial cost, improvement percentage, iterations to the best solution, runtime, acceptance rate, and representative convergence curves, are shown in Figure 2.
Visitor-experience outcomes
Overall satisfaction differed across the three layout conditions. Participants in the manual layout condition reported a mean of 3.59 ± 0.45 (95% CI, 3.47–3.71), the standard simulated annealing layout a mean of 3.96 ± 0.44 (95% CI, 3.85–4.07), and the adaptive simulated annealing with reheating layout a mean of 4.37 ± 0.31 (95% CI, 4.29–4.45). The between-condition effect was large. Overall satisfaction was not a component of the spatial-cost function and, therefore, is not directly optimized by the algorithm.
Presence and spatial presence followed the same pattern. Presence increased from 3.77 ± 0.56 in the manual layout condition to 3.99 ± 0.55 in the standard simulated annealing condition and 4.28 ± 0.42 in the adaptive simulated annealing with reheating condition. Spatial presence increased from 3.75 ± 0.64 to 3.96 ± 0.63 and 4.27 ± 0.47 across the same three conditions.
Interaction quality and wayfinding clarity also improved under the optimized layouts. Interaction quality increased from 3.74 ± 0.56 in the manual layout condition to 4.00 ± 0.57 in the standard simulated annealing condition and 4.24 ± 0.57 in the adaptive simulated annealing with reheating condition. Wayfinding clarity increased from 3.61 ± 0.58 to 3.90 ± 0.57 and 4.17 ± 0.48, respectively.
The optimized layouts reduced negative experience indicators. Perceived crowding decreased from 3.01 ± 0.49 in the manual layout condition to 2.75 ± 0.55 in the standard simulated annealing condition and 2.56 ± 0.45 in the adaptive simulated annealing with reheating condition. Cognitive load decreased from 3.21 ± 0.48 to 2.87 ± 0.52 and 2.73 ± 0.44. Simulator sickness was lowest in the adaptive layout condition, decreasing from 2.52 ± 0.55 in the manual layout condition to 2.44 ± 0.58 in the standard simulated annealing condition and 2.12 ± 0.56 in the adaptive simulated annealing with reheating condition.
Comfort-related ratings showed consistent but more moderate improvements. Visual comfort increased from 3.67 ± 0.44 in the manual layout condition to 3.87 ± 0.44 in the standard simulated annealing condition and 4.07 ± 0.45 in the adaptive simulated annealing with reheating condition. Acoustic comfort increased from 3.64 ± 0.52 to 3.75 ± 0.42 and 3.97 ± 0.44. Thermal comfort increased from 3.69 ± 0.46 to 3.79 ± 0.32 and 3.94 ± 0.44. The main visitor-experience and behavioral outcomes are shown in Figure 3.
Behavioral outcomes
Behavioral trajectory data supported the questionnaire findings. Completion time decreased across the three layout conditions. Participants in the manual layout condition required 19.11 ± 2.63 min to complete the exhibition, compared with 17.42 ± 2.77 min in the standard simulated annealing condition and 14.93 ± 2.32 min in the adaptive simulated annealing with reheating condition.
Walking distance showed a similar reduction. The mean walking distance was 234.88 ± 24.34 m in the manual layout condition, 217.95 ± 24.33 m in the standard simulated annealing condition, and 201.86 ± 23.47 m in the adaptive simulated annealing with reheating condition. Hesitation count also decreased, from 7.10 ± 1.80 in the manual layout condition to 5.51 ± 1.79 in the standard simulated annealing condition and 4.07 ± 1.99 in the adaptive simulated annealing with reheating condition.
Dwell time and heatmap coverage increased under the optimized layouts. Dwell time increased from 11.17 ± 2.03 min in the manual layout condition to 12.24 ± 2.04 min in the standard simulated annealing condition and 13.39 ± 2.28 min in the adaptive simulated annealing with reheating condition. Heatmap coverage increased from 66.18% ± 9.40% to 74.14% ± 7.93% and 84.40% ± 9.47%, respectively.
These findings indicate that the adaptive layout did not simply shorten the route. It reduced inefficient movement and hesitation while increasing dwell time and spatial coverage.
Spatial layout and trajectory distribution
The optimized layouts showed visible differences in route organization and spatial coverage. Compared with the manual layout, the standard simulated annealing layout reduced unnecessary route turning and improved continuity between thematic zones. The adaptive simulated annealing with reheating layout further produced a more balanced distribution of exhibition zones and interaction nodes, with fewer local congestion points along the main route.
The trajectory heatmaps showed that participants in the adaptive layout condition covered a larger proportion of the exhibition hall while maintaining shorter walking distances and fewer instances of hesitation. In the manual layout condition, trajectories were more concentrated around several turning points and transition areas. Under standard simulated annealing conditions, the trajectory distribution became more continuous but still exhibited several local regions of repeated movement. Under adaptive simulated annealing with reheating, the trajectory pattern was broader and more evenly distributed across the exhibition space. The spatial layouts and visitor trajectory heatmaps are shown in Figure 4.
Statistical comparison of participant outcomes
Group comparisons showed clear between-condition differences in the primary and major secondary outcomes. Overall satisfaction differed significantly across conditions, with the highest score observed in the adaptive simulated annealing with reheating condition. Heatmap coverage, completion time, hesitation count, walking distance, wayfinding clarity, and presence also showed strong between-condition effects.
The largest effects were observed for heatmap coverage, overall satisfaction, hesitation count, and completion time. Heatmap coverage showed a large between-condition effect, with η2 = 0.413. Overall satisfaction also showed a large effect, with η2 = 0.386. Hesitation count and completion time showed large effects, with η2 = 0.311 and η2 = 0.311, respectively. Walking distance showed a moderate-to-large effect, with η2 = 0.242.
Pairwise sensitivity analyses supported the principal three-group comparisons. Relative to standard simulated annealing, Adaptive SA-R increased overall satisfaction by 0.41 points (95% CI, 0.272–0.548; Holm-adjusted p < 0.001; Hedges g = 1.07), presence by 0.29 (95% CI, 0.113–0.467; adjusted p = 0.003; g = 0.59), and wayfinding clarity by 0.27 (95% CI, 0.079–0.461; adjusted p = 0.012; g = 0.51). It reduced completion time by 2.49 min (95% CI, −3.414 to −1.566; adjusted p < 0.001; g = −0.97), walking distance by 16.09 m (95% CI, −24.733 to −7.448; adjusted p < 0.001; g = −0.67), and hesitation count by 1.44 (95% CI, −2.124 to −0.756; adjusted p < 0.001; g = −0.76), while increasing heatmap coverage by 10.26 percentage points (95% CI, 7.101–13.419; adjusted p < 0.001; g = 1.17). Perceived crowding was 0.19 points lower (95% CI, −0.372 to −0.008; adjusted p = 0.041; g = −0.38), and the 0–30 simulator-sickness study summary was 0.32 points lower (95% CI, −0.526 to −0.114; adjusted p = 0.005; g = −0.56). The complete three-contrast results for all participant outcomes are reported in Supplementary Table 1.
Distributional and variance assumptions were evaluated using Q-Q plots, Shapiro-Wilk tests, and Levene tests before choosing the prespecified parametric or robust alternative. Nonparametric sensitivity testing was used for outcomes that were clearly non-normal. Pairwise comparisons were adjusted with the Holm method, and 95% confidence intervals are reported for principal group means, algorithmic between-group differences, figure error bars, and the supplementary summary-statistic pairwise contrasts. No subgroup or moderator effects are inferred from the contextual covariates because these analyses were not prespecified or powered.
Several participant-level outcomes provide convergent validation beyond the variables directly minimized by the spatial-cost function. Overall satisfaction, presence, cognitive load, simulator sickness, dwell time, and heatmap coverage are not explicit terms in the objective function. Their between-layout differences therefore extend the evaluation beyond simple re-expression of route length or crowding penalties, although they remain measured within the same controlled virtual-reality experiment and should not be interpreted as fully independent real-world validation.
Sensitivity analysis
Sensitivity analysis varied each objective-function weight by ±10% individually and proportionally renormalized the remaining weights to maintain a total weight of 1.00. Across the alternative weight settings, the adaptive simulated annealing with reheating condition retained the lowest mean final spatial cost. The direction of the comparison remained unchanged for the final spatial cost, the improvement percentage, and the number of iterations to the best solution. These results support local robustness to moderate weight perturbations but do not establish that the same weight vector is appropriate for other types of exhibitions.
The stability analysis indicates that the adaptive algorithm was not solely dependent on one nominal weight configuration. The visitor-experience pattern was also consistent with the algorithmic results: the layout with the lowest spatial cost showed the highest satisfaction, stronger presence, clearer wayfinding, and broader heatmap coverage.
The implementation is parameter-driven rather than hard-coded to a single floor plan: hall boundary, grid resolution, zone number and allowable area, pathway-width range, density ceiling, interaction-node count, environmental targets, and objective weights are external configuration values. These inputs can be replaced without changing the proposal/accept/reheat search logic, providing structural portability to other encoded layouts. This is a software architecture property, not empirical evidence of generalization; performance has been demonstrated only for the current 36 m x 24 m rectangular single-floor scenario.
Summary of findings
Within the tested 36 m x 24 m single-floor exhibition scenario, the adaptive simulated annealing with reheating method generated the lowest spatial cost, the highest improvement percentage, and the most favorable participant-experience profile among the three evaluated layout conditions. Compared with the manual layout, the adaptive layout produced higher satisfaction, stronger presence, clearer wayfinding, lower crowding and cognitive load, shorter completion time and walking distance, fewer hesitation events, longer dwell time, and broader heatmap coverage. These findings describe performance under the predefined objective function and experimental conditions and should not be interpreted as proof of a universally optimal exhibition layout. Compared with standard simulated annealing, the adaptive algorithm exhibited stronger optimization performance and better participant-level outcomes, albeit at a modest increase in runtime. The combined algorithmic, behavioral, questionnaire, and trajectory-heatmap results support the proposed layout-optimization workflow for immersive exhibition-space environmental design.
Data availability
The source data materials associated with the current study are available on Figshare: Zhang, Guangping; Hui, Xianghui; Wang, Hanye (2026). Optimizing Immersive Exhibition Space Design Using Adaptive Simulated Annealing with Reheating and Virtual Reality Evaluation. figshare. Dataset. https://doi.org/10.6084/m9.figshare.33313611.v1
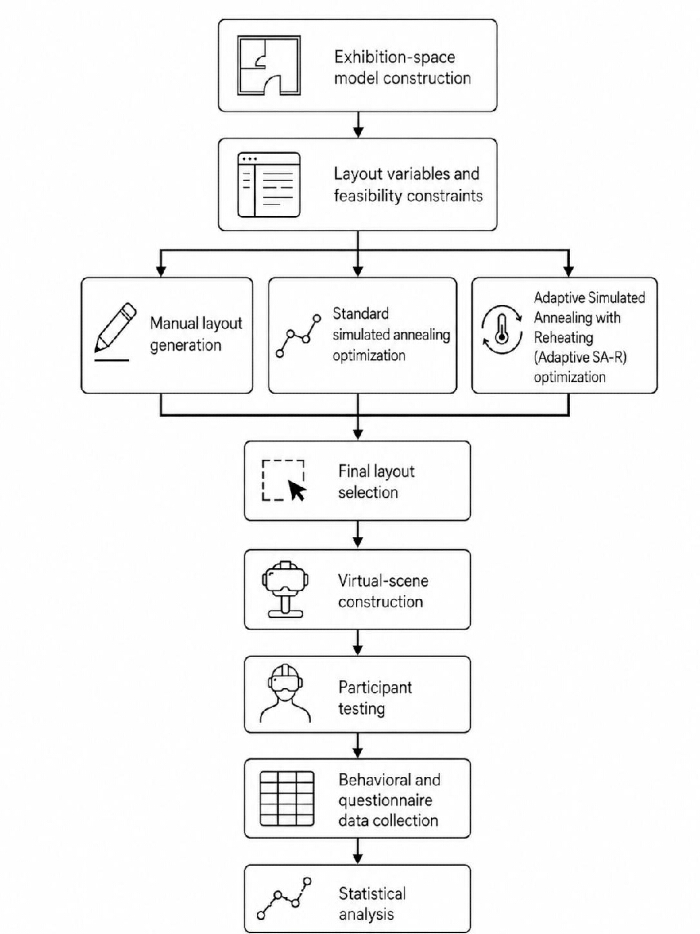
Figure 1: Workflow for immersive exhibition-space layout optimization and virtual-reality evaluation. The workflow includes exhibition-space model construction, definition of layout variables and feasibility constraints, manual layout generation, standard simulated annealing optimization, adaptive simulated annealing with reheating optimization, final layout selection, virtual-scene construction, participant testing, behavioral and questionnaire data collection, and statistical analysis. The figure summarizes the full methodological sequence used to link spatial design optimization to immersive experience evaluation. No panel subdivision or statistical notation is used in this figure. Please click here to view a larger version of this figure.
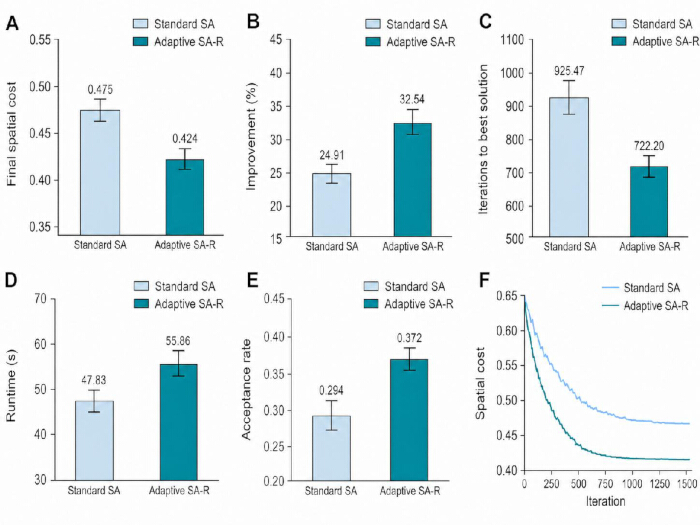
Figure 2: Algorithm performance of standard simulated annealing and adaptive simulated annealing with reheating. (A) Final spatial cost across independent optimization runs. (B) Improvement percentage from initial to final spatial cost. (C) Number of iterations required to reach the best solution. (D) Runtime in seconds. (E) Acceptance rate during the search process. (F) Representative convergence curves showing spatial cost across iterations. Standard SA denotes standard simulated annealing; Adaptive SA-R denotes adaptive simulated annealing with reheating. Panels A–E include n = 30 independent optimization runs per algorithmic condition. Central markers/bars represent the group means, and error bars represent 95% confidence intervals of the mean; individual run-level scatter points are not displayed. Between-algorithm inferential comparisons are reported in Table 2 with exact p-values and Cohen’s d effect sizes. Panel F shows representative convergence trajectories and is descriptive rather than an additional inferential test. Abbreviations: CI = confidence interval; SA = simulated annealing; SA-R = simulated annealing with reheating. Please click here to view a larger version of this figure.
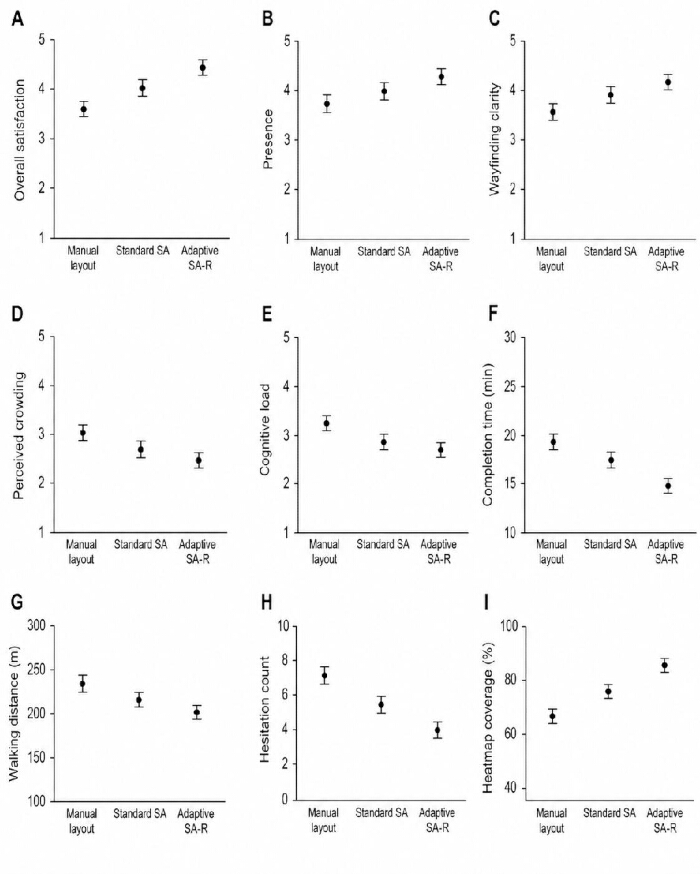
Figure 3: Visitor-experience and behavioral outcomes across the three layout conditions. (A) Overall satisfaction. (B) Presence. (C) Wayfinding clarity. (D) Perceived crowding. (E) Cognitive load. (F) Completion time. (G) Walking distance. (H) Hesitation count. (I) Heatmap coverage. The groups are Manual layout, Standard SA (standard simulated annealing), and Adaptive SA-R (adaptive simulated annealing with reheating), with n = 60 participants per group. Black markers represent group means, and vertical error bars represent 95% confidence intervals of the mean; individual participant-level scatter is not displayed. Outcomes were compared across the three groups using the prespecified ANOVA/robust alternative framework described in the Protocol; exact p values and effect sizes are provided in Table 2. Abbreviations: CI = confidence interval; ANOVA = analysis of variance; SA = simulated annealing; SA-R = simulated annealing with reheating. Please click here to view a larger version of this figure.
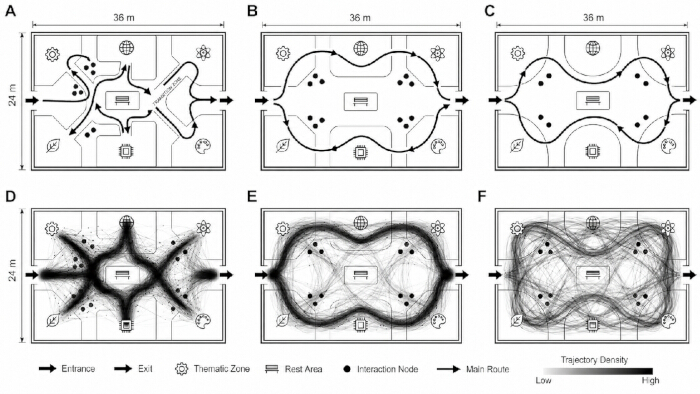
Figure 4: Spatial layouts and visitor trajectory heatmaps across the three layout conditions. (A) Manual exhibition layout. (B) Standard simulated annealing layout. (C) Adaptive simulated annealing with reheating layout. (D) Visitor trajectory heatmap in the manual layout condition. (E) Visitor trajectory heatmap in the standard simulated annealing condition. (F) Visitor trajectory heatmap for adaptive simulated annealing with reheating. The schematic symbols denote the entrance, exit, thematic zones, rest area, interaction nodes, and main route as indicated in the embedded legend. The density scale in panels D–F ranges from low to high trajectory density, and each trajectory heatmap summarizes n = 60 participant sessions in the corresponding condition. Panels A–C are layout schematics, and panels D–F are descriptive trajectory visualizations; no error bars or significance notation are used in this figure. Please click here to view a larger version of this figure.
| Parameter category | Parameter | Value / Setting | Role in protocol |
| Exhibition space | Hall size | 36 m × 24 m | Fixed spatial boundary |
| Exhibition space | Total floor area | 864 m² | Base model area |
| Exhibition space | Ceiling height | 4.5 m | Virtual scene parameter |
| Access points | Entrance width | 3.0 m | Fixed access point |
| Access points | Exit width | 3.0 m | Fixed access point |
| Functional zoning | Number of thematic zones | 6 | Main layout objects |
| Functional zoning | Thematic-zone area range | 80–130 m² | Feasibility constraint |
| Functional zoning | Transition corridors | 2 | Route-connection elements |
| Functional zoning | Rest area | 40 m² | Fixed functional space |
| Circulation | Main-pathway width | 1.8–3.5 m | Optimization variable |
| Circulation | Initial manual pathway width | 2.2 m | Baseline layout setting |
| Circulation | Maximum reference route length | 120 m | Normalization value for walking-distance cost |
| Interaction | Interaction nodes | 8–12 | Optimization variable |
| Interaction | Interaction-node trigger radius | 1.0 m | Virtual-reality interaction setting |
| Interaction | Interaction-node clearance radius | ≥1.2 m | Feasibility constraint |
| Spatial analysis | Grid size | 0.5 m × 0.5 m | Visibility, heatmap, and density calculation |
| Visibility analysis | Line-of-sight ray interval | 0.5 m | Visual-accessibility calculation |
| Crowding | Local density threshold | ≤1.50 persons/m² | Feasibility constraint and crowding-cost reference |
| Environmental comfort | Target illuminance | 300–500 lx | Component of environmental-comfort penalty |
| Environmental comfort | Target sound pressure level | 45–60 dB(A) | Component of environmental-comfort penalty |
| Environmental comfort | Target carbon dioxide | <900 ppm | Component of environmental-comfort penalty |
| Environmental comfort | Target temperature | 22–25 °C | Component of environmental-comfort penalty |
| Objective function | Walking-distance cost weight | 0.25 | Route-efficiency component |
| Objective function | Visual-accessibility cost weight | 0.2 | Visual-accessibility component |
| Objective function | Crowding cost weight | 0.25 | Crowding-control component |
| Objective function | Environmental-comfort penalty weight | 0.15 | Environmental-comfort component |
| Objective function | Interaction-balance penalty weight | 0.15 | Interaction-distribution component |
| Standard simulated annealing | Initial temperature | 100 | Starting search temperature |
| Standard simulated annealing | Cooling coefficient | 0.95 | Temperature reduction rule |
| Standard simulated annealing | Maximum iterations | 1500 | Stopping rule |
| Standard simulated annealing | Stagnation threshold | 200 iterations | Early stopping rule |
| Standard simulated annealing | Layout proposal moves | Zone movement; zone-sequence swap; pathway-width adjustment; interaction-node movement | Neighboring-solution generation |
| Standard simulated annealing | Zone movement range | 0.5–2.0 m | Proposal-move setting |
| Standard simulated annealing | Pathway-width adjustment range | 0.1–0.3 m | Proposal-move setting |
| Standard simulated annealing | Interaction-node movement range | 0.5–1.5 m | Proposal-move setting |
| Adaptive SA-R | First-stage iteration range | First 40% of iterations | Global exploration phase |
| Adaptive SA-R | First-stage proposal probabilities | Local displacement 0.20; zone-sequence swap 0.35; pathway-width adjustment 0.30; interaction-node relocation 0.15 | Adaptive proposal distribution |
| Adaptive SA-R | Second-stage iteration range | Final 60% of iterations | Local refinement phase |
| Adaptive SA-R | Second-stage proposal probabilities | Local displacement 0.35; zone-sequence swap 0.15; pathway-width adjustment 0.20; interaction-node relocation 0.30 | Adaptive proposal distribution |
| Adaptive SA-R | Reheating threshold | 150 iterations without improvement | Premature-convergence control |
| Adaptive SA-R | Reheating magnitude | 10% increase in current temperature | Adaptive reheating rule |
| Adaptive SA-R | Maximum reheating events | 3 per run | Search-stability rule |
| Algorithm evaluation | Independent random seeds | 30 per algorithmic condition | Algorithm-performance estimation |
| Virtual-reality scene | Camera height | 1.65 m | Approximate standing eye height |
| Virtual-reality scene | Walking speed | 1.2 m/s | Standardized navigation setting |
| Virtual-reality scene | Teleportation | Disabled | Standardized trajectory recording |
| Participant session | Practice scene duration | 2 min | Familiarization before test scene |
| Participant session | Pre-session seated rest | 2 min | Baseline preparation |
| Participant session | Post-session rest | 3 min | Recovery before questionnaire |
| Participant session | Route assistance threshold | >30 s unable to proceed | Standardized assistance rule |
| Study design | Layout conditions | 3 | Manual layout; standard simulated annealing layout; adaptive simulated annealing with reheating layout |
| Study design | Participants per condition | 60 | Between-subject allocation |
| Study design | Total participants | 180 | Full study sample |
| Primary algorithmic outcome | Final spatial cost | Continuous | Main optimization outcome |
| Primary visitor-experience outcome | Overall satisfaction | 1–7 scale | Main participant-reported outcome |
| Secondary algorithmic outcomes | Improvement percentage; iterations to best solution; runtime; acceptance rate | Continuous | Algorithm-performance evaluation |
| Secondary visitor-experience outcomes | Presence; spatial presence; interaction quality; wayfinding clarity; visual comfort; acoustic comfort; thermal comfort; perceived crowding; cognitive load; simulator sickness | Continuous | Experience evaluation |
| Secondary behavioral outcomes | Completion time; dwell time; walking distance; hesitation count; heatmap coverage | Continuous | Trajectory and route-behavior evaluation |
| Exclusion rule | Completion time | <3 min or >25 min | Participant-record exclusion criterion |
| Exclusion rule | Walking distance | No upper cutoff; records <20 m were considered invalid only when associated with incomplete/invalid trajectory | Data-integrity rule |
| Exclusion rule | Heatmap coverage | <10% | Participant-record exclusion criterion |
| Multiple comparison control | Pairwise comparison adjustment | Holm method | Type-I error control |
| Sensitivity analysis | Objective-function weight change | ±10%, total weight retained at 1.00 | Stability check |
Table 1: Spatial-design variables, optimization parameters, feasibility constraints, and outcome definitions. This table summarizes the fixed exhibition-space parameters, variable design elements, feasibility constraints, objective-function settings and rationale, standard simulated annealing parameters, adaptive simulated annealing with reheating settings, virtual-reality scene parameters, participant-session procedures, data-integrity exclusion rules, and primary and secondary outcomes used in the protocol. SA = simulated annealing; SA-R = adaptive simulated annealing with reheating; VR = virtual reality.
| Category | Outcome | Manual layout | Standard SA | Adaptive SA-R | Statistical test / mean difference | p value | Effect size |
| Algorithm-performance outcomes | Final spatial cost | — | 0.475 ± 0.019 (95% CI, 0.468–0.482) | 0.424 ± 0.016 (95% CI, 0.418–0.430) | Welch t = 11.25; mean difference = −0.051 (95% CI, −0.060 to −0.042) | <0.001 | Cohen’s d = 2.90 |
| Improvement percentage (%) | — | 24.91 ± 3.22 (95% CI, 23.708–26.112) | 32.54 ± 3.29 (95% CI, 31.311–33.769) | Welch t = 9.07; mean difference = +7.63 (95% CI, 5.95 to 9.31) | <0.001 | Cohen’s d = 2.34 | |
| Iterations to best solution | — | 925.47 ± 86.38 (95% CI, 893.215–957.725) | 722.20 ± 90.19 (95% CI, 688.523–755.877) | Welch t = 8.92; mean difference = −203.27 (95% CI, −248.91 to −157.63) | <0.001 | Cohen’s d = 2.30 | |
| Runtime (s) | — | 47.83 ± 9.42 (95% CI, 44.313–51.347) | 55.86 ± 9.49 (95% CI, 52.316–59.404) | Welch t = 3.29; mean difference = +8.03 (95% CI, 3.14 to 12.92) | 0.002 | Cohen’s d = 0.85 | |
| Acceptance rate | — | 0.294 ± 0.045 (95% CI, 0.277–0.311) | 0.372 ± 0.054 (95% CI, 0.352–0.392) | Welch t = 6.08; mean difference = +0.078 (95% CI, 0.052 to 0.104) | <0.001 | Cohen’s d = 1.57 | |
| Visitor-experience outcomes | Presence | 3.77 ± 0.56 (95% CI, 3.625–3.915) | 3.99 ± 0.55 (95% CI, 3.848–4.132) | 4.28 ± 0.42 (95% CI, 4.172–4.388) | ANOVA F = 14.86 | <0.001 | η² = 0.144 |
| Spatial presence | 3.75 ± 0.64 (95% CI, 3.585–3.915) | 3.96 ± 0.63 (95% CI, 3.797–4.123) | 4.27 ± 0.47 (95% CI, 4.149–4.391) | ANOVA F = 11.99 | <0.001 | η² = 0.119 | |
| Interaction quality | 3.74 ± 0.56 (95% CI, 3.595–3.885) | 4.00 ± 0.57 (95% CI, 3.853–4.147) | 4.24 ± 0.57 (95% CI, 4.093–4.387) | ANOVA F = 11.68 | <0.001 | η² = 0.117 | |
| Wayfinding clarity | 3.61 ± 0.58 (95% CI, 3.460–3.760) | 3.90 ± 0.57 (95% CI, 3.753–4.047) | 4.17 ± 0.48 (95% CI, 4.046–4.294) | ANOVA F = 15.83 | <0.001 | η² = 0.152 | |
| Visual comfort | 3.67 ± 0.44 (95% CI, 3.556–3.784) | 3.87 ± 0.44 (95% CI, 3.756–3.984) | 4.07 ± 0.45 (95% CI, 3.954–4.186) | ANOVA F = 12.21 | <0.001 | η² = 0.121 | |
| Acoustic comfort | 3.64 ± 0.52 (95% CI, 3.506–3.774) | 3.75 ± 0.42 (95% CI, 3.642–3.858) | 3.97 ± 0.44 (95% CI, 3.856–4.084) | ANOVA F = 7.94 | <0.001 | η² = 0.082 | |
| Thermal comfort | 3.69 ± 0.46 (95% CI, 3.571–3.809) | 3.79 ± 0.32 (95% CI, 3.707–3.873) | 3.94 ± 0.44 (95% CI, 3.826–4.054) | ANOVA F = 5.61 | 0.004 | η² = 0.060 | |
| Perceived crowding | 3.01 ± 0.49 (95% CI, 2.883–3.137) | 2.75 ± 0.55 (95% CI, 2.608–2.892) | 2.56 ± 0.45 (95% CI, 2.444–2.676) | ANOVA F = 12.33 | <0.001 | η² = 0.122 | |
| Cognitive load | 3.21 ± 0.48 (95% CI, 3.086–3.334) | 2.87 ± 0.52 (95% CI, 2.736–3.004) | 2.73 ± 0.44 (95% CI, 2.616–2.844) | ANOVA F = 15.79 | <0.001 | η² = 0.151 | |
| Overall satisfaction | 3.59 ± 0.45 (95% CI, 3.474–3.706) | 3.96 ± 0.44 (95% CI, 3.846–4.074) | 4.37 ± 0.31 (95% CI, 4.290–4.450) | ANOVA F = 55.67 | <0.001 | η² = 0.386 | |
| Simulator sickness | 2.52 ± 0.55 (95% CI, 2.378–2.662) | 2.44 ± 0.58 (95% CI, 2.290–2.590) | 2.12 ± 0.56 (95% CI, 1.975–2.265) | ANOVA F = 8.47 | <0.001 | η² = 0.087 | |
| Behavioral trajectory outcomes | Completion time (min) | 19.11 ± 2.63 (95% CI, 18.431–19.789) | 17.42 ± 2.77 (95% CI, 16.704–18.136) | 14.93 ± 2.32 (95% CI, 14.331–15.529) | ANOVA F = 39.85 | <0.001 | η² = 0.311 |
| Dwell time (min) | 11.17 ± 2.03 (95% CI, 10.646–11.694) | 12.24 ± 2.04 (95% CI, 11.713–12.767) | 13.39 ± 2.28 (95% CI, 12.801–13.979) | ANOVA F = 16.46 | <0.001 | η² = 0.157 | |
| Walking distance (m) | 234.88 ± 24.34 (95% CI, 228.592–241.168) | 217.95 ± 24.33 (95% CI, 211.665–224.235) | 201.86 ± 23.47 (95% CI, 195.797–207.923) | ANOVA F = 28.28 | <0.001 | η² = 0.242 | |
| Hesitation count | 7.10 ± 1.80 (95% CI, 6.635–7.565) | 5.51 ± 1.79 (95% CI, 5.048–5.972) | 4.07 ± 1.99 (95% CI, 3.556–4.584) | ANOVA F = 39.74 | <0.001 | η² = 0.310 | |
| Heatmap coverage (%) | 66.18 ± 9.40 (95% CI, 63.752–68.608) | 74.14 ± 7.93 (95% CI, 72.091–76.189) | 84.40 ± 9.47 (95% CI, 81.954–86.846) | ANOVA F = 62.33 | <0.001 | η² = 0.413 |
Table 2: Algorithmic and participant-level outcomes across the three layout conditions. This table reports algorithm-performance outcomes, visitor-experience outcomes, and behavioral trajectory outcomes across the Manual layout, Standard SA (standard simulated annealing), and Adaptive SA-R (adaptive simulated annealing with reheating) conditions. Algorithm-performance comparisons are based on n = 30 independent optimization runs per algorithmic condition. Participant-level comparisons are based on n = 60 participants per layout condition. Values are reported as mean ± SD with 95% confidence intervals for the mean. For algorithm outcomes, the Statistical Test column also reports the mean between-algorithm difference and its 95% CI. The p-value and Effect Size columns provide the corresponding inferential result. Detailed pairwise participant sensitivity contrasts are presented in Supplementary Table S1. SD = standard deviation; CI = confidence interval; ANOVA = analysis of variance; SA = simulated annealing; SA-R = adaptive simulated annealing with reheating; η2 = eta-squared; d = Cohen's d.
Supplementary File 1. Hardware, software, and environmental-monitoring resources. Hardware, software, and environmental monitoring resources are used for spatial optimization and virtual reality experiments. Please click here to download this file.
Supplementary File 2. Participant screening and questionnaire/codebook framework. Participant screening criteria and questionnaire/codebook information, including the study domains, scoring ranges, and reporting conventions used for participant outcomes. Please click here to download this file.
Supplementary File 3. Adaptive SA-R pseudocode and analysis resources. Pseudocode for the Adaptive SA-R workflow, including the four proposal kernels, together with software dependencies, variable definitions, and figure-source file descriptions. Please click here to download this file.
Supplementary Table 1. Pairwise sensitivity comparisons of participant outcomes. Pairwise sensitivity comparisons were calculated using the group means, standard deviations, and sample sizes. Please click here to download this file.
Discussion
The present study evaluated a reproducible exhibition-layout workflow that combines a weighted spatial-cost model, adaptive simulated annealing with reheating, and participant testing in virtual reality. Within the predefined 36 m x 24 m scenario, the adaptive layout achieved a lower spatial cost than standard simulated annealing and was associated with higher satisfaction, stronger presence, clearer wayfinding, shorter routes, fewer hesitations, and broader spatial coverage. The term “optimized” is used here in the restricted mathematical sense of obtaining a lower value of the specified cost function under the stated constraints; it does not imply that the layout is globally optimal for aesthetic quality, emotional response, narrative sequencing, or every possible exhibition objective. Spatial configuration can shape movement, visibility, and cognitive accessibility30,31, but design quality remains a multi-criteria human-centered judgment.
The participant results add a useful, though still bounded, layer of validation because several outcomes were not direct terms in the objective function. Overall satisfaction, presence, cognitive load, simulator sickness, dwell time, and heatmap coverage were measured after layout generation rather than minimized during the search. Their direction, therefore, suggests that the lower-cost layout was not simply a mathematical artifact of walking-distance reduction32. At the same time, the validation remained within a single-user virtual environment. Previous virtual-reality familiarity can affect navigation comfort and performance, and although it was recorded as a contextual variable, the present study was not powered to estimate subgroup-specific or interaction effects. The results should therefore be interpreted as randomized between-layout comparisons rather than as evidence that demographic or experience-related factors have no influence33,34.
The algorithmic comparison should likewise be interpreted conservatively. Formal derivation of the four proposal kernels shows that the forward and reverse conditional proposal densities are symmetric for reversible feasible moves; consequently, the Hastings ratio is 1, and the implemented acceptance rule is the standard Metropolis rule within simulated annealing. The contribution is therefore not a new Metropolis-Hastings algorithm, but a domain-specific configuration of stage-dependent move selection, reheating, explicit feasibility constraints, and reproducible virtual-environment validation. Standard simulated annealing is a controlled comparator because it shares the same encoding, objective, constraints, initialization, cooling schedule, and nominal run budget. The present experiment did not include numerical GA, PSO, ACO, or learning-based benchmark runs; claims are therefore restricted to the matched standard-SA baseline. The combined configuration also does not isolate the separate effects of proposal scheduling and reheating.
The practical trade-off was favorable for the tested problem size but should not be generalized without additional benchmarking. Relative to standard simulated annealing, runtime increased by 16.8%, whereas final spatial cost was 10.7% lower, and the number of iterations to the best solution was 22.0% lower. This suggests that the added adaptive control was computationally affordable in the current single-floor model. The objective weights also remained directionally robust to ±10% perturbations, but the weights were deliberately scenario-specific: route efficiency and crowding were prioritized over environmental comfort and interaction balance. Artistic, historical, scientific, or commercial exhibitions may reasonably use different priorities, including nonlinear circulation and narrative transitions that a route-efficiency-focused cost function would otherwise penalize. Optimization should therefore be used as a decision-support layer that makes trade-offs explicit, not as a replacement for curatorial or architectural judgment35.
Several limitations define the boundary of the present conclusions. First, validation used one rectangular, single-floor virtual exhibition and one participant at a time; larger halls, irregular geometries, multi-floor circulation, simultaneous group movement, interpersonal avoidance, dynamic congestion, physical fatigue, and real-world environmental distractions were not tested. Second, the comparison set did not include representative evolutionary, swarm-intelligence, or learning-based optimizers, and no component-ablation experiment separated the effects of stage-dependent proposal probabilities from reheating. Third, participant ratings remain partly subjective, and prior virtual-reality experience may influence navigation and comfort even under randomized allocation; the study was not designed for a subgroup or moderator analysis. Fourth, although satisfaction, presence, cognitive load, simulator sickness, dwell time, and heatmap coverage are not explicit spatial-cost terms, the study did not collect independent attention, emotional response, learning effectiveness, or long-term memory endpoints. Fifth, the spatial-cost function cannot directly represent qualitative dimensions such as emotional response, curatorial narrative, surprise, meaning-making, or long-term memory. Sixth, short virtual-reality exposure may underestimate discomfort that emerges during longer sessions36,37. These limitations mean that the framework should be viewed as a reproducible proof-of-workflow for the tested scenario rather than a generally validated optimizer for all exhibition environments.
Future work should test the framework across larger, irregular, and multi-floor spaces; include multi-user crowd simulation and physical or mixed-reality validation; add objective endpoints for attention, emotional response, learning, and delayed memory; and conduct component-wise ablation of stage-dependent proposal scheduling and reheating. Algorithmic competitiveness should be tested under matched computational budgets against representative alternatives such as NSGA-II38, particle swarm optimization39, and Ant System/ant-colony optimization40, with method-specific parameter tuning reported transparently. Exhibition-specific preference elicitation could also recalibrate objective weights when narrative sequence, accessibility, educational effectiveness, emotional engagement, or dwell-time goals differ from the present scenario. These extensions would evaluate scalability, transferability, and algorithmic competitiveness without assuming that one fixed cost function defines the best exhibition experience.
Disclosures
The authors declare no competing financial interests.
Acknowledgements
The authors thank the participants who took part in the evaluation of the virtual-reality exhibition. The authors also acknowledge the School of Art and Design and the College of Information and Management Science at Henan Agricultural University for their support in developing and evaluating the immersive exhibition-space design workflow. The study received no external funding. The work was supported by the authors' own resources and routine institutional facilities at Henan Agricultural University.
Materials
| Name | Company | Catalog Number | Comments |
|---|---|---|---|
| 3D modeling software | Blender Foundation | N/A | Blender 4.0.2; used to construct exhibition-space geometry, thematic zones, partitions, and spatial assets. RRID:SCR_008606 |
| Analysis scripts | Custom research scripts | N/A | Version 1.0; used for statistical analysis, sensitivity analysis, confidence-interval calculations, and figure-data preparation. |
| Carbon-dioxide monitor | Testo SE & Co. KGaA | testo 535; 0563 0535 | Digital CO2 meter; measuring range 0–10,000 ppm; used as a protocol control check of carbon-dioxide concentration under the predefined environmental target. |
| Desktop workstation | Dell Technologies | Precision 3660 Tower | 32 GB RAM; used for virtual-scene rendering, layout simulation, algorithm execution, and participant-session logging. |
| Figure-generation scripts | Custom research scripts | N/A | Version 1.0; used to generate algorithm-performance plots, visitor-outcome plots, and trajectory heatmaps. |
| Game engine / VR platform | Unity Technologies | N/A | Unity 2022.3.22f1 LTS; used to build and run the virtual exhibition scenes. |
| Head-mounted display | Meta Platforms, Inc. | Meta Quest 2 (128 GB) | 6-DoF standalone HMD; 1832 × 1920 pixels per eye; 90 Hz session refresh rate; used to deliver the immersive virtual-reality scene and track participant movement. |
| Illuminance meter | Testo SE & Co. KGaA | testo 540; 0560 0540 | Digital lux meter; measuring range 0–99,999 lx; used as a protocol control check of illuminance under the predefined environmental target. |
| NumPy | NumPy Developers | N/A | Version 1.26.4; used for numerical array operations and data preparation. RRID:SCR_008633 |
| Optimization script | Custom research script | N/A | Python 3.11, version 1.0; implements Standard SA and Adaptive Simulated Annealing with Reheating (Adaptive SA-R), including stage-dependent proposal selection, Metropolis acceptance, and reheating. |
| pandas | pandas development team | N/A | Version 2.1.4; used for dataset cleaning, tabulation, and figure-ready data preparation. RRID:SCR_018214 |
| Participant screening form | Custom research form | N/A | Version 1.0; used to record eligibility, demographic variables, prior virtual-reality experience, and museum/exhibition-visiting frequency. |
| Post-experience rating questionnaire | Custom research form | N/A | Version 1.0; 7-point response scales; used to assess interaction quality, wayfinding clarity, visual/acoustic/thermal comfort, perceived crowding, cognitive load, and overall satisfaction. |
| Presence and spatial-presence rating form | Custom research form | N/A | Version 1.0; study-specific 7-point domain scores interpreted with reference to the PQ/IPQ frameworks; standard PQ or IPQ total scores were not reported. |
| Python programming language | Python Software Foundation | N/A | Version 3.11; used for algorithm execution, cost-function calculation, data processing, and sensitivity analysis. RRID:SCR_008394 |
| SciPy | SciPy community | N/A | Version 1.11.4; used for statistical tests and supporting numerical analyses. RRID:SCR_008058 |
| Simulator-sickness rating form | Custom research form | N/A | Version 1.0; prespecified 0–30 study summary based on the SSQ symptom framework; distinct from the standard weighted SSQ Total Severity score. |
| Sound-level meter | Testo SE & Co. KGaA | testo 816-1; 0563 8170 | IEC 61672-1 Class 2; 30–130 dB; A/C frequency weighting; used as a protocol control check of sound-pressure level under the predefined environmental target. |
| Spreadsheet software | Microsoft | N/A | Microsoft Excel 2021; used for dataset organization, codebook preparation, and supplementary spreadsheet files. RRID:SCR_016137 |
| Statistical software | IBM | N/A | IBM SPSS Statistics 27.0; used for ANOVA, Welch tests, assumption checks, and supplementary statistical verification. RRID:SCR_002865 |
| Temperature monitor | Testo SE & Co. KGaA | testo 605i; 0560 2605 03 | Thermohygrometer; temperature range −20 to +60 °C; 0.1 °C resolution; used as a protocol control check of ambient temperature under the predefined environmental target. |
| VR integration package | Unity Technologies | N/A | XR Interaction Toolkit 2.5.4; used for VR interaction, movement control, trigger events, and trajectory logging. |
| NOTE: Biological resources were not used in this study. RRIDs are provided for applicable research resources. |
References
- Falk JH, Dierking LD. The museum experience revisited. Left Coast Press; Walnut Creek, CA; 2013.
- Hillier B, Hanson J. The social logic of space. Cambridge University Press; Cambridge; 1984.
- Turner A, Doxa M, O'Sullivan D, Penn A. From isovists to visibility graphs: a methodology for the analysis of architectural space. Environ Plan B Plan Des. 2001;28:103-21.
- Kuliga SF, Thrash T, Dalton RC, Hölscher C. Virtual reality as an empirical research tool: exploring user experience in a real building and a corresponding virtual model. Comput Environ Urban Syst. 2015;54:363-75.
- Radianti J, et al. A systematic review of immersive virtual reality applications for higher education: design elements, lessons learned, and research agenda. Comput Educ. 2020;147:103778.
- Cummings JJ, Bailenson JN. How immersive is enough? A meta-analysis of the effect of immersive technology on user presence. Media Psychol. 2016;19:272-309.
- Witmer BG, Singer MJ. Measuring presence in virtual environments: a presence questionnaire. Presence-Teleop Virt. 1998;7:225-40.
- Makransky G, Petersen GB. The Cognitive Affective Model of Immersive Learning: a theoretical research-based model of learning in immersive virtual reality. Educ Psychol Rev. 2021;33:937-58.
- Kennedy RS, Lane NE, Berbaum KS, Lilienthal MG. Simulator Sickness Questionnaire: an enhanced method for quantifying simulator sickness. Int J Aviat Psychol. 1993;3:203-20.
- Kirkpatrick S, Gelatt CD Jr, Vecchi MP. Optimization by simulated annealing. Science. 1983;220:671-80.
- Metropolis N, et al. Equation of state calculations by fast computing machines. J Chem Phys. 1953;21:1087-92.
- Hastings WK. Monte Carlo sampling methods using Markov chains and their applications. Biometrika. 1970;57:97-109.
- Aarts EHL, Korst JHM. Simulated annealing and Boltzmann machines: a stochastic approach to combinatorial optimization and neural computing. John Wiley & Sons; Chichester; 1989.
- Van Laarhoven PJM, Aarts EHL. Simulated annealing: theory and applications. D. Reidel Publishing Company; Dordrecht; 1987.
- Bertsimas D, Tsitsiklis J. Simulated annealing. Stat Sci. 1993;8:10-5.
- Talbi EG. Metaheuristics: from design to implementation. John Wiley & Sons; Hoboken, NJ; 2009.
- Sörensen K. Metaheuristics: the metaphor exposed. Int Trans Oper Res. 2015;22:3-18.
- Hillier B. Space is the machine: a configurational theory of architecture. Cambridge University Press; Cambridge; 1996.
- Lolli F, et al. Post-Occupancy Evaluation's (POE) applications for improving indoor environment quality (IEQ). Toxics. 2022;10:626.
- Ministry of Housing and Urban-Rural Development of the People's Republic of China, State Administration for Market Regulation. GB/T 50034-2024 Standard for lighting design of buildings. Beijing; 2024.
- State Administration for Market Regulation, Standardization Administration of China. GB/T 23863-2024 Specification for lighting design of museum. Beijing; 2024.
- State Administration for Market Regulation, Standardization Administration of China. GB/T 18883-2022 Standards for indoor air quality. Beijing; 2022.
- Ministry of Housing and Urban-Rural Development of the People's Republic of China, General Administration of Quality Supervision, Inspection and Quarantine. GB/T 50785-2012 Evaluation standard for indoor thermal environment in civil buildings. Beijing; 2012.
- Ministry of Environmental Protection of the People's Republic of China, General Administration of Quality Supervision, Inspection and Quarantine. GB 3096-2008 Environmental quality standard for noise. Beijing; 2008.
- Chib S, Greenberg E. Understanding the Metropolis-Hastings algorithm. Am Stat. 1995;49:327-35.
- Slater M, Sanchez-Vives MV. Enhancing our lives with immersive virtual reality. Front Robot AI. 2016;3:74.
- Schubert T, Friedmann F, Regenbrecht H. The experience of presence: factor analytic insights. Presence-Teleop Virt. 2001;10:266-81.
- Stanney KM, Kennedy RS, Drexler JM. Cybersickness is not simulator sickness. Proc Hum Factors Ergon Soc Annu Meet. 1997;41:1138-42.
- Blum C, Roli A. Metaheuristics in combinatorial optimization: overview and conceptual comparison. ACM Comput Surv. 2003;35:268-308.
- Benedikt ML. To take hold of space: isovists and isovist fields. Environ Plan B Plan Des. 1979;6:47-65.
- Penn A. Space syntax and spatial cognition: or why the axial line? Environ Behav. 2003;35:30-65.
- Sherman WR, Craig AB. Understanding virtual reality: interface, application, and design. Morgan Kaufmann; San Francisco, CA; 2003.
- Slater M. Place illusion and plausibility can lead to realistic behaviour in immersive virtual environments. Philos Trans R Soc Lond B Biol Sci. 2009;364:3549-57.
- Sweller J. Cognitive load during problem solving: effects on learning. Cogn Sci. 1988;12:257-85.
- Heydarian A, Carneiro JP, Gerber D, Becerik-Gerber B. Immersive virtual environments versus physical built environments: a benchmarking study for building design and user-built environment explorations. Autom Constr. 2015;54:116-26.
- Rebenitsch L, Owen C. Review on cybersickness in applications and visual displays. Virtual Real. 2016;20:101-25.
- Clay V, König P, König SU. Eye tracking in virtual reality. J Eye Mov Res. 2019;12:3.
- Deb K, Pratap A, Agarwal S, Meyarivan T. A fast and elitist multiobjective genetic algorithm: NSGA-II. IEEE Trans Evol Comput. 2002;6:182-97.
- Kennedy J, Eberhart RC. Particle Swarm Optimization. Proc IEEE Int Conf Neural Netw. 4, 1942-1948.
- Dorigo M, Maniezzo V, Colorni A. Ant system: optimization by a colony of cooperating agents. IEEE Trans Syst Man Cybern B Cybern. 1996;26:29-41.