This protocol establishes a reproducible method to generate highly viable single-cell suspensions from murine mammary gland and mammary tumor tissues that preserve cell-surface epitopes for subsequent analysis, including flow cytometry and single-cell RNA sequencing.
Method Article
Dissociation of Murine Mammary Gland and Tumor Tissues to Create Highly Viable Single-Cell Suspensions
In This Article
Summary
Abstract
The dissociation of tissue into single-cell suspensions for analysis aids in understanding what is happening at the cellular level in the tumor microenvironment. A longstanding challenge in obtaining and utilizing primary cells is producing high-quality cell suspensions that preserve cell characteristics for downstream processing, including single-cell RNA sequencing (scRNA-Seq) or immunophenotyping via flow cytometry. Typically, tissues are dissociated using a combination of mechanical disruption, enzymatic digestion, and filtration, and several factors in each step introduce variability into the resulting product. Therefore, optimization steps must be taken to identify a method that works best for any specific tissue type. For example, mammary fat pad tissue is rich in adipocytes, making it more challenging to obtain a clean cell suspension and to successfully preserve viable cells. As a result, generating comparable cell suspensions from mammary fat pad tissue and epithelioid tumors is challenging. This protocol establishes a reproducible, cost-effective method for generating highly viable single-cell suspensions from murine mammary gland and tumor tissues that preserve cell-surface epitopes for further analysis. This procedure has been used to produce high-quality scRNA-Seq libraries and to perform immunophenotyping using multi-parameter flow cytometry.
Introduction
Tissue dissociation enables the acquisition of single-cell suspensions and the characterization of cell types within tissues. This is particularly important when analyzing response to immunotherapy, as infiltrating immune cells can help elucidate the underlying mechanism of tissue-specific immunological responses. Vaccination with deoxyribonucleic acid (DNA) encoding the HER2/neu oncogene leads to increased protection against spontaneous HER2/neu-driven mammary tumors in murine models1. Additionally, DNA vaccination has been shown to induce a systemic response characterized by antibody production and interferon-γ (IFN-γ)- secreting T cells1,2,3. For this reason, we focused on developing a protocol to dissociate mammary tumors and adipose-rich mammary gland tissues to enable the enumeration of local immunity. Dissociation of tissue into single cells requires enzymatic, mechanical, or both enzymatic and mechanical methods. One challenge associated with enzymatic dissociation is that these methods require exposure to enzymes for an extended period, often overnight4. Overexposure results in degradation of individual cells and surface markers, with the most detrimental effects on immune cells5,6. Mechanical digestion can be a good option for liberating immune cells such as lymphocytes and macrophages, though it does not effectively break down the stroma to obtain a representative sample of epithelial and stromal cells. Recently, microfluidics for tissue dissociation has been explored and was first employed to break up cellular aggregates in solution7. One group implemented a microfluidic approach to further break down minced tissue using shear forces in device8. After 60 min of optimized dissociation, this method yielded a 2-fold increase in epithelial cells and a 4-fold increase in endothelial cells compared with a traditional enzymatic digestion protocol in mammary tissue. However, challenges arose when measuring hepatocyte yield in a liver sample, with yield decreasing over time, likely due to hepatocyte size and fragility. Therefore, finding a middle ground that obtains a clean representative sample of multiple cell types while preserving cell integrity and surface epitopes is of the utmost importance.
Enzymes used in digestion mixes typically include some combination of general collagenases9,10, trypsin (A Guide to Solid Tissue Dissociation)4,10,11, hyaluronidase9,10,11, or dispase4,9,10and require varying amounts of time for effective digestion. The protocol described here uses two specific types of collagenases, collagenase type II and collagenase D, as the primary enzymes for digestion, with ethylenediaminetetraacetic acid (EDTA) used in a secondary role to further weaken cell-cell bonds through chelation. Collagenase type II is a primary dissociation enzyme produced by Clostridium histolyticum and aids in the digestion of small collagen fragments in the extracellular matrix. Collagenase D is also produced by C. histolyticum and has been extensively used to dissociate a variety of tissues, such as lung, cardiac, muscle, bone, neural, and endothelial tissues. This collagenase helps to preserve the functionality and integrity of cell-surface proteins, an important factor for downstream immunophenotyping via flow cytometry. In addition to collagenase, tissues are digested in the presence of deoxyribonuclease I (DNase I), which degrades free DNA, thereby eliminating it from the resulting cell suspension.
Another challenge unique to the dissociation of mammary glands is the presence of adipocytes within the sample. As a mouse ages, the mammary fat pad accumulates a significant number of adipocytes. These cells are more fragile and susceptible to rupture during downstream processing, which can release RNA and intracellular debris into the cell suspension, increasing ambient RNA and disrupting scRNA-Seq library preparation and reducing sample quality. Extracellular DNA can lead to cell aggregates; thus, any remaining adipocytes after initial enzymatic dissociation must be removed to maintain the sample's integrity. Fortunately, the buoyant nature of adipocytes can be leveraged to aid separation from remaining cells during centrifugation. Using a centrifugation protocol, the adipocytes remain at the surface of the supernatant. This allows the cells to be disposed of with the supernatant, while avoiding their incorporation into the primary cell pellet. While not mandatory, inclusion of gradual deceleration reduces Coriolis forces within the tube, helping maintain adipocytes in a distinct layer at the top, particularly when dealing with mammary tissue that is especially rich in adipocytes or when adipocytes are removed as the focus of the study12,13.
With these tissue-specific considerations in mind, we sought to establish a protocol that is cost-effective, requires no specialized equipment, and yields a representative cell sample from the parent tissue with consistently high quality and reproducibility.
Protocol
All procedures in this protocol were conducted in accordance with the US Public Health Service Policy on the Use of Laboratory Animals and with approval by Michigan State University’s Institutional Animal Care and Use Committee.
1. Generation of a single-cell suspension from murine tumor tissue and mammary gland tissue:
Tissue digestion
- Dispose of all excess or unused mouse tissues into biological waste. Place plastics contaminated with murine tissues or cells into biological waste for disposal. Collect cell-containing solutions into a biological liquid waste container and treat with 10% bleach prior to disposal.
- Ensure that fresh tissue digestion cocktail is made immediately prior to tissue digestion. Each sample requires 10 mL of digestion cocktail (10 mL Roswell Park Memorial Institute (RPMI), 60 U DNase I, 25 mg Collagenase D, 50 mg Collagenase type II). Store at room temperature (RT) until use.
- Euthanize mice via cervical dislocation, with bilateral pneumothorax as a secondary method of euthanasia, with or without exsanguination.
- Place the mouse in a supine position, with legs stretched outwards and pinned.
- Spray the mouse completely with 70% ethanol to prevent sample contamination from loose fur.
- Make a single incision down the mouse’s midline from the inguinal fat pad to the neck, being careful not to puncture the peritoneum, followed by an incision down each leg to form an upside-down “Y” incision shape.
- Stretch the skin out, using blunt dissection techniques to separate the skin from the underlying peritoneum, and pin the skin flat against the necropsy board.
- Remove medium-sized tumors or mammary glands/fatpads and place in a 50 mL conical tube with 5 mL R10 cell washing media (R10 is RPMI) medium with 10% fetal bovine serum (FBS).
- Avoid the use of necrotic or blood-filled tumors (which are very dark in appearance and soft) if possible.
- In a biological safety cabinet, transfer only mammary fatpads and tumors to a clean petri dish. Mince the tissue finely using two surgical scalpel blades until it forms a paste-like consistency, then place it into a clean 50 mL tube. Perform this step at RT.
- Add 10 mL digestion cocktail/sample.
- Incubate in a 37 °C shaking incubator at 250 revolutions per min (rpm) for 30 min.
- Add 0.5 M EDTA to a final concentration of 10 mM (200 µL EDTA/10 mL digestion buffer).
- Return to the shaking incubator at 37 °C and 250 rpm for an additional 5 min.
- Add 40 mL of R10 cell-washing medium to stop the reaction.
- Filter digested cells through a 70 µm filter into a clean 50 mL tube to remove chunks.
- Centrifuge at 500 x g using acceleration setting 9 and deceleration setting 6, 4 °C for 10 min (if only interested in lymphocytic cells, then centrifugation force can be reduced to 300 x g for 5 min)14 to pellet cells. As this involves the dissociation of mammary gland tissue, which is adipocyte-rich, a decreased braking protocol helps to maintain the gradient formed by the floating nature of adipocytes during centrifugation13.
- Discard the supernatant into biological waste, disrupt the pellet, and add 40 mL of cell washing medium, then centrifuge as above (step 1.15). Braking can be returned to full deceleration for subsequent steps. Failure to do so will not negatively impact the sample.
- Wash with 40 mL of R10 cell-washing medium and centrifuge as in step 1.15 for a total of 3 washes.
- Disrupt pellet and resuspend cells in 2 mL cold 1 × PBS.
- Add two volumes of 1× RBC lysis buffer. Dilute 10 × lysis buffer concentrate to 1 × using water (i.e., 2 x = 2 mL 1 × PBS + 4 mL lysis buffer). Perform this step at RT.
- Incubate at room temperature for 5 min by mixing gently occasionally by inverting the tube.
- Neutralize the RBC lysis buffer by adding an equal volume of R10 cell-washing medium.
- Filter the cell solution through a 30 µm filter into a 15 mL tube to remove cellular debris.
- Bring the volume to 15 mL with R10 cell washing medium.
- Centrifuge at 500 x g for 10 min at 4 °C.
- Remove the supernatant completely and resuspend in cell-washing medium to a final volume of up to 5 mL for counting and viability assessment. Resuspend to the desired dilution. Proceed to staining for flow cytometry or preparation for scRNA-seq.
- Keep cells on ice in between steps unless otherwise specified.
2. Staining a single cell suspension for flow cytometry
- Transfer desired cells into a 5 mL polypropylene round-bottom tube and keep on ice.
- Create a cell staining solution using desired monoclonal antibodies (mAb) conjugated to fluorescent tags in a total volume of (n + 1) × 100 µL using flow PBS (490 mL 1x PBS, 10 mL FBS, 0.5g Sodium azide). Prepare (n+1) × 100 µL of staining solution, where n = number of samples (e.g., 6 × 100 µL = 600 µL for 5 samples)
NOTE: Sodium Azide is a carcinogen in powder form. Wear appropriate personal protective equipment and wash all equipment to ensure azide is in solution prior to disposal into the chemical waste containment. - Centrifuge each sample to be stained for 5 min at 4 °C at 500 x g. Resuspend in 100 µL staining solution. Resuspend unstained controls in 1000 µL flow PBS.
- Cover tubes to protect from light and incubate at 4 °C for 15 min.
NOTE: Fluorescently tagged antibodies can be degraded by prolonged exposure to light and should remain covered during incubation and subsequent sample storage. - Add 1 mL of flow PBS to each stained tube and centrifuge at 500 x g, 4 °C, for 5 min to wash.
- Discard supernatant, disrupt pellet, and resuspend cells in 1 mL flow PBS. Spin as before (Step 2.5).
- Repeat step 2.6 for a total of three washes. Discard supernatant and disrupt pellets.
- Resuspend cells in fixation solution or flow PBS, depending on subsequent stains required.
- Use if fixing the cells or performing an intracellular stain. Otherwise, proceed to Step 2.10:
- Add 200 µL of permeabilization/fixation solution to each sample to permit intra-nuclear staining.
- Cover cells with aluminum foil and allow them to incubate for at least 20 min at 4 °C. If planning to run samples another day, samples can be kept covered at 4 °C overnight at this step.
- After fixation, centrifuge samples at 500 x g for 5 min and resuspend in 1 × permeabilization buffer (diluted in water).
- If preparing a secondary or intracellular stain, stain samples at the desired dilution in 1x Permeabilization buffer. Place the covered tubes in the incubator at 4 °C for 15–20 min.
- Add 1 mL 1x permeabilization buffer to each stained tube and centrifuge at 500 x g for 5 min to wash.
- Discard supernatant, disrupt pellet, and resuspend cells in 1 mL 1x Permeabilization buffer. Spin as before (Step 9.5).
- Repeat step 2.9.6 for a total of three washes. Discard supernatant and disrupt pellets.
- Resuspend cells in 200 µL 1x Permeabilization buffer and keep on ice until ready to run on a flow cytometer.
- If not fixing cells, resuspend in 200 µL of flow PBS and keep on ice until ready to run on a flow cytometer.
- For scRNA-Seq analysis, follow protocols to remove debris and dead cells, assess RNA quality, and generate libraries.
3. Assessment of scRNA-Seq library quality
- Look for a high percentage of reads confidently mapped to cells. Ideally, this number will be greater than 90%.
- Compare unique molecular identifier (UMI) counts with barcodes. A high-quality sample will have a sharp drop-off in UMI counts at approximately 10,000 barcodes (‘knee bend’ on the barcode rank plot).
- Examine the uniform manifold approximation and projection (UMAPs). A high-quality sample from complex tissues such as mammary glands or spontaneous mammary tumors will have distinct, well-separated cell clusters.
- Identify the number of mitochondrial (mt-) genes being expressed; clusters with high numbers of mitochondrial genes signify that the cells are dead or dying.
Results
HER2 is a tumor oncogene that drives aggressive mammary tumors in women, and up to 70% of women treated with HER2-targeted monoclonal therapies will either not respond or develop resistance to HER2-targeted therapy15,16,17,18. The ultimate goal is to activate an immune response against HER2/neu to improve HER2 immunity and increase survival. To study HER2/neu immunity, immunocompetent murine models are used that develop spontaneous mammary tumors driven by HER2/neu2,19. HER2 is encoded by human Erbb2 and neu by rat Erbb2. BALB NeuT mice carry a transforming rat neu (NeuT) transgene, driven by the MMTV promoter19. Neu is expressed in the mammary glands of BALB-background pubescent female mice, resulting in the development of ductal carcinoma (Figure 1A, inset) in all transgenic females in any or all mammary glands. Continuous expression of neu leads to palpable tumors between 14 and 19 weeks of age, which grow progressively1. Vaccination of transgenic mice with plasmid DNA encoding both autologous neu and heterologous HER2 (termed pNeuE2TM) can break immune tolerance to neu, leading to increased systemic neu-targeting polyclonal antibodies and IFN-γ-secreting splenic T cells1. This immune response led to rejection of neu-expressing TUBO tumor cells. While systemic response is informative, it does not allow us to understand the mechanism of action at the tumor site. Thus, we set out to develop a dissociation protocol for mammary gland and mammary tumor tissues that will yield single cells with high viability while retaining cell-surface markers. Figure 1 provides an overview of the workflow. Briefly, following collection, tissue is finely minced using scalpels (Figure 1B) and placed in RPMI-based tissue digestion buffer containing a combination of 2 parts collagenase type II to 1 part collagenase D and DNase I for 30 min in a shaking incubator (Figure 1C–D), followed by an additional 5 min with 0.5 M EDTA (Figure 1E). Digestion is stopped by adding an FBS-containing wash buffer, and the mixture is filtered to remove tissue debris (Figure 1F). Following wash steps and red blood cell lysis (Figure 1G–H), cells are strained through a 30 m strainer and counted (Figure 1I–K and Figure 2). At this point, cells can be allotted for downstream workflows such as flow cytometry or scRNA-Seq.
For direct comparison, dissociation was performed in parallel using a commercial kit. The published protocol was followed for ‘Tough’ tumors, and after enzyme neutralization, samples were treated the same way (i.e., RBC lysis, etc.). Using the commercial kit, 1.3 × 10⁶ cells/mL were recovered with 76% viability, whereas with the protocol here, 4.5 × 10⁶ cells/mL were recovered with 89% viability (Figure 2A,B). Debris between the two protocols was similar following RBC lysis. To remove dead cells, 1 × 10⁷ cells from each protocol were processed through the dead cell removal pipeline. The commercial kit recovered 1.3 × 10⁶ cells/mL at 96% viability compared with 1.94 × 10⁶ cells/mL and 98% viability for the protocol reported here (Figure 2C,D). Thus, the protocol reported here returned a higher yield of viable cells for downstream analyses without the need for specialized equipment.
To specifically evaluate the quality and reproducibility of cell suspensions acquired from the protocol reported here, mammary gland samples from naïve female BALB and BALB NeuT mice at 16–18 weeks of age were collected. BALB NeuT tissue contained both mammary gland and tumor tissues. Tissue from the inguinal mammary fat pads (mammary glands 4 and 9) was taken, including tumor tissue from BALB NeuT, and dissociated into a homogenous solution for downstream analysis. Note that sentinel lymph nodes were removed prior to mammary gland collection.
Following processing, samples were evaluated by flow cytometry to confirm retention of cell-surface markers and cell viability (Figure 3), and analysis by scRNA-Seq (Figure 4) to verify the quality of the cell preparation for library generation. Viability of mammary gland or tumor-derived single cells averaged ≥85% prior to dead cell removal. To generate a highly viable starting cell preparation for scRNA-Seq, commercially available dead-cell and debris-removal kits can be used. Following these protocols, the viability of the single-cell preparations ranged from 94% to 98% (Figure 2C,F). Cells from this protocol were fixed and compared with the recommended fixation method for scRNA-Seq, termed a commercial fixation-first dissociation protocol, utilizing a commercial thermolysin (Figure 2E,F). The commercial fixation-first dissociation protocol yielded 1.5 × 10⁷ cells/mL, and viability was not measured because it fixes tissue prior to dissociation, whereas this protocol returned 8.6 × 10⁶ cells/mL from a starting viability of 94%. Thus, the commercial fixation-first dissociation protocol method yielded a comparable or slightly higher number of cells than the protocol reported herein.
Cells were stained and assessed for cell surface markers using flow cytometry. Epithelial cells (Figure 3A) and fibroblasts (Figure 3B) were identified by staining with EpCAM and Pdgfrb/CD140a mAb, respectively. Since three-time vaccination of BALB NeuT mice with HER2/neu DNA resulted in a significant delay in tumor onset and systemic immunity, it was of particular interest to assess immune cells in mammary glands and tumors. CD45+ cells of the immune lineage comprised ~50% of the cell suspension (Figure 3C). The presence of B and T cells was assessed using B220/CD45R and CD3 (Figure 3D), and CD3+T cells were further subdivided into CD4 and CD8 (Figure 3E). To assess the ability to retain rare cell populations, samples were stained for regulatory T cells. To do this, the cell sample was fixed and stained for the Treg-specific transcription factor Foxp3. Regulatory T cells typically comprise a small proportion of the body’s total immune population, though their role in the modulation of the immune system is of great interest in the areas of cancer research and autoimmune disease. Therefore, the reliable capture of small but robust immune cell populations, such as regulatory T cells, is critical when considering a tissue dissociation protocol. Foxp3+ regulatory T cells were identified by first sub-gating CD3+CD4+ cells for expression of CD25 (the high-affinity IL-2 receptor) and Foxp3. Using this gating strategy, ~5% of the CD4+ cells were positive for both markers, while ~25% were positive for Foxp3 but low or negative for CD25 (Figure 3F). CD64 was evaluated on a separate tumor sample to ensure that CD64+ macrophages could be successfully isolated using this dissociation technique (Figure 3G). To identify broader myeloid groups, F4/80+ macrophages and F4/80- CD11c+ cells, identified as dendritic cells (Figure 3H). Dendritic cells comprised roughly 3% of total cells, while CD11b+Ly6G+ neutrophils comprised ~5% (Figure 3H,I). Therefore, reliable recovery and preservation of surface epitopes were achieved in CD45+ cells after dissociation of both mammary gland and tumor tissue using the above protocol.
Prior to submission for scRNA-Seq library generation, samples can be assessed for RNA integrity. Fresh samples prepared using the commercial protocol or the protocol reported here yielded A260/230 ratios of 1.9 and 2.2, respectively. Fixed samples are assessed by determining the percentage of reads greater than 200 nucleotides (nt). The protocol reported here, followed by immediate fixation and storage at –80 °C, resulted in 83% of the sample containing reads > 200 nt.
Quality of the samples
Following scRNA-Seq library preparation and sequencing, sample quality was assessed (Figure 4). scRNA-Seq sample libraries are first evaluated using metrics for cell calling and mapping quality, the barcode rank plot, sequencing saturation, and UMAP projections. Dissociation of BALB mammary tissue using the dissociation protocol described here yielded 16,182 cells, with 97% of reads assigned to cells, indicating a healthy sample, as few reads were assigned to extracellular RNA. A significant percentage of reads recorded outside the cell indicates increased levels of ambient mRNA contamination from dead or dying cells. Mapping quality is the percentage of probes that mapped to the probe set; it was 99.1%. Sequencing saturation was plateauing, indicating replication of already identified genes rather than unique ones. The barcode rank plot shows UMI counts versus barcodes, and a high-quality sample shows a distinct drop-off, or ‘knee bend’, at ~10K UMIs (Figure 4A). Finally, the UMAP projection shows several distinct clusters (Figure 4A). All these metrics indicate a high-quality scRNA-Seq library.
To compare the quality of this protocol versus the recommended commercial fixation-first dissociation protocol for Flex chemistry, a commercial fixation-first dissociation protocol was performed side-by-side with the protocol reported here, and the resulting library was assessed for quality. The commercial fixation-first dissociation protocol for BALB mammary gland samples recovered 720 cells, with 68% reads in cells and 89.3% mapping quality. Similarly, saturation was beginning to plateau, but the gene/cell counts were distinctly lower than with live dissociation (4,500 genes/cell for live vs. 1,000 genes/cell for a commercial fixation-first dissociation protocol). The barcode rank plot does not show a knee bend (Figure 4B), and while there are distinct clusters, there are fewer of them (Figure 4B).
BALB NeuT tumor-containing mammary tissue libraries were also assessed for quality (Figure 4C,D). Using the live dissociation described here, 18,077 cells were sequenced, with 97% of the reads in cells and 99.1% mapped to the probe set. A knee bend was evident (Figure 4C), as well as a clear separation between clusters (Figure 4C). The commercial fixation-first dissociation protocol performed better when a tumor was present, with 7,119 cells sequenced, 91% of the reads in cells, and 98.6% of the reads mapped to the probe set. There was a better knee bend in the barcode rank plot (Figure 4D), but despite sequencing saturation, the UMAP projections contained few distinct clusters (Figure 4D).
Additional quality metrics include determining the number of mitochondrial genes expressed by cell clusters. Good cell separation is indicative of sample quality, with a high percentage of ‘reads in cell’ demonstrating the health of the sample. Cells with high numbers of mitochondrial genes (denoted as ‘mt-’) can be identified and removed using open-source and vendor clustering tools. Direct sample comparison can be performed by aggregating samples with the Cell Ranger application, which allows for head-to-head bioinformatic comparison, or by using the ‘integration’ script in open-source and vendor clustering tools. Cell clusters are identified by querying known cell lineage markers (e.g., CD45/Ptprc for immune cells, EpCAM for epithelial cells, Fap or Pdgfra for fibroblasts). If a cell cluster cannot be defined by known lineage markers, the top 10–15 most highly expressed genes can be analyzed using gene-set enrichment tools to gain insight into the possible cell type. Alternatively, top-expressed can be queried using reference cell-atlas tools for expression in known cell types.
Cells with high numbers of mitochondrial genes were removed from each sample, leaving 16,114 cells (0.5% of cells containing high mitochondrial genes) in the BALB mammary gland and 18,024 cells (0.3%) in the BALB NeuT. Within the commercial fixation-first dissociation protocol samples, BALB mammary gland retained 627 (13% of cells containing high mitochondrial genes), and BALB NeuT retained 6,181 (14%) cells.
Integration between the BALB and BALB NeuT mammary glands was performed for the live-cell dissociation protocol described here and is shown in Figure 4E,F. Comparison of the samples showed similar cell populations between libraries (Figure 4E, F, and Table 1). Cell clusters were labeled using known cell lineage markers, and comparisons were made between samples. Immune cell populations included T cells, B cells, and macrophage clusters, while non-immune cell populations included epithelial cells, fibroblasts, and endothelial cells. Not surprisingly, the BALB NeuT sample had an additional population of tumor cells (Figure 4F). Looking at specific cell populations, there were more macrophages in the tumor-bearing BALB NeuT sample, but fewer T cells and non-tumor epithelial cells. scRNA-Seq analysis showed a comparable population of epithelial cells derived from the BALB mammary gland and a significant population of epithelial/tumor cells in the NeuT counterpart. The dimensional reduction plot shows a clear distinction between the normal mammary resident epithelial cell population and the epithelial tumor cells specific to the BALB NeuT sample (Figure 4E,F).
After establishing epithelial populations, stromal cells were evaluated between the BALB and BALB NeuT samples. Analysis of fibroblast-expressed platelet-derived growth factor receptor alpha (Pdgfrα) gene identified a distinct population of fibroblasts in both the BALB and BALB NeuT samples. In the BALB scRNA-Seq sample, Pdgfrα-expressing fibroblasts accounted for 15% of cells, which was somewhat less than the analysis by flow cytometry that yielded fibroblasts at 29% of cells (Figure 3B). After gating for viability and single-cell status, fibroblasts were identified by flow cytometry using the PDGFRα (CD140a) marker. The results observed across samples, regardless of downstream analysis methods, support the consistency of this dissociation protocol over time and across multiple trials.
The CD45 protein is encoded by the Ptprc gene, and RNA sequencing of Ptprc-expressing cells revealed highly identifiable lymphocytic clusters within the sample (Figure 4E). To further evaluate lymphocyte populations, cells were evaluated for B and T cell populations using Cd3e+ or Cd79a+ (Figure 4E,F). These populations were distinct upon evaluation of single-cell sequencing data, although scRNA-Seq further identified several subclusters of Cd3-expressing T cells. Additional immune cell counts from sequencing analysis showed an increase in macrophages in the BALB NeuT sample, as indicated by the expression of Itgam and Adgre1 (F4/80) (Figure 4F). To assess the identification of rare cell populations in scRNA-Seq, regulatory T cells were identified by their Foxp3 expression (Figure 4F). Regulatory T cells are present in the scRNA-Seq libraries but were not abundant enough to be identified as a distinct cluster. Instead, they clustered with the T cells and natural killer (NK) cells.
Finally, the ability to identify neutrophils (PMNs) within scRNA-Seq libraries has been a source of consternation and has not been achieved with other commercially available mammary dissociation protocols20. Using flow cytometry, ~5% of the immune cells were identified as neutrophils expressing Ly6G and CD11b (Figure 3H). To identify neutrophils within scRNA-Seq libraries, the recommendation is to recluster using vendor pipelines to call cells below the standard knee bend. This practice was performed for both the BALB and BALB NeuT mammary gland libraries. Dotplots of genes typically associated with macrophages (Ptprc, Adgre1, Mrc1) were compared with those expressed by neutrophils (S100a8, Trem1, Clec4). Neither the BALB nor the BALB NeuT libraries contained significant numbers of neutrophils (Figure 5A,B). However, that would appear to depend on the model background, as F1 NeuT mice on a BALB x PWK background harbored a cell cluster expressing neutrophil markers (Figure 5C).
Thus, this dissociation protocol enabled elucidation of the cell types within the mammary glands of BALB mice and BALB NeuT mice developing spontaneous mammary tumors. Since these cells are highly viable, this technique can be used to assess anti-tumor immunity and anti-HER2/neu functionality of isolated immune cell populations.
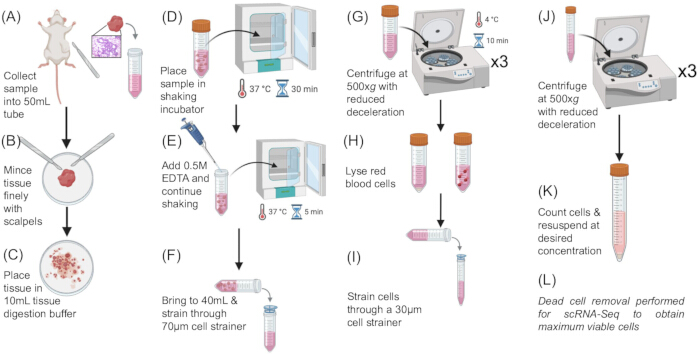
Figure 1: Workflow for tissue dissociation protocol. (A) Mammary glands or tumors were removed (B,C), minced finely (D), and digested at 37 °C, shaking in a cocktail of collagenase type II, collagenase D, and DNase I (E). EDTA was added, and digestion continued for an additional 5 min. (F) Digestion was stopped by Qs to 40 mL with RPMI containing 10% FBS (R10 wash medium), and the suspension was then filtered through 70 µm filters. (G) Cell suspensions were centrifuged at 4 °C and 500 × g for 10 min, then washed 3 times with RPMI wash medium. (H) Red blood cells (RBC) were lysed using ammonium chloride-based 10 × RBC Lysis solution. (I) R10 wash buffer was used to stop lysis, and cell suspensions were filtered through 30 µm filters. (J,K) After red blood cell lysis, cells are washed three additional times before assessment for concentration and viability. (L) If cells are being used for scRNA-Seq library generation, dead cells and debris are removed using commercially available kits, per their protocol(s). Please click here to view a larger version of this figure.
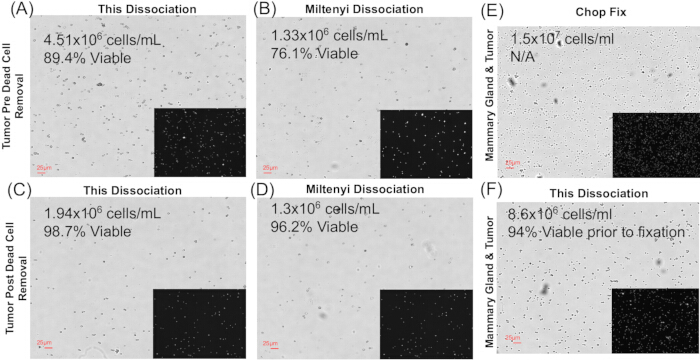
Figure 2: Dissociation comparison. Cell counting and viability data to compare the dissociation protocol reported here with the commercially available Miltenyi protocol and a commercial fixation-first dissociation protocol recommended for scRNA-Seq. Cell counts post-dissociation were obtained using an automated cell counter with acridine orange/propidium iodide (AO/PI) dead-cell staining. Cells were counted and viability recorded following dead cell removal. (A–B) Cell counts and viability immediately prior to dead cell removal. (C–D) Cell counts and viability following dead cell removal, and what would be representative of the sample entering the scRNA-Seq pipeline. (E–F) Cell counts and viability when comparing the protocol reported here with a commercial fixation-first dissociation protocol. Viability could not be assessed after dissociation using the Liberase-containing protocol because the tissue sample was fixed prior to dissociation. Please click here to view a larger version of this figure.
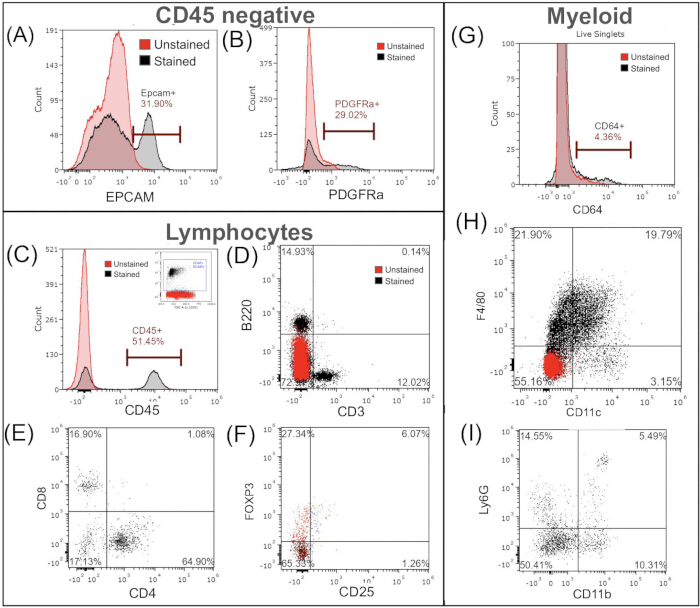
Figure 3: Flow cytometric analysis of dissociated tissues. To ensure the presence and viability of immune cells, representative BALB and BALB NeuT samples were analyzed. Cells were initially gated for viability, and then singlets were identified prior to subgroup identification. To ensure that epithelial and stromal lineage cells were recovered, they were first assessed. EpCAM was used to identify epithelial-derived cells (A), and PDGFRa was used to identify fibroblasts (B) To evaluate immune populations, 51% of the total cells were CD45-positive in the mammary gland (C) B cell (B220+) and T cell (CD3+) populations were obtained from dissociated murine mammary tissue (D), and CD8+ and CD4+ populations were sub-gated from tumor tissue (E) To determine whether this protocol can effectively isolate rarer cell populations, (F) Treg in tumor tissue were assessed using Foxp3+ expression. This was done by first gating for a CD3+ and CD4+ population, and within that population, identifying cells that are Foxp3+ and CD25+ (approximately 6%). (G) Evaluation of CD64+ macrophages from tumor tissue. (H) CD11b+ cells were further analyzed for expression of F4/80 and CD11c, with F4/80− CD11c+ cells identified as dendritic cells. (I) Neutrophils were identified as cells expressing CD45+, Ly6G+, and CD11b+, but were F4/80−. Please click here to view a larger version of this figure.
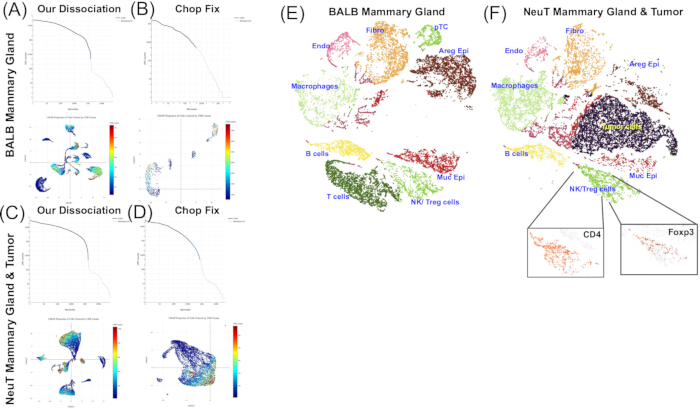
Figure 4: Assessment of scRNA-Seq Libraries. Fixed samples were used to generate scRNA-Seq libraries; either the live cell dissociation protocol described here, followed by fixation as reported in this manuscript, or the recommended commercial fixation-first dissociation protocol. (A) Quality control for the live cell dissociation BALB mammary gland scRNA-Seq library. 16,182 cells were sequenced, with 97.1% of reads mapped confidently within cells and 98.8% mapped confidently to the filtered probe set. Knee bend plots are shown on the top, and the UMAP projections below. A sharp knee bend and distinct cell clusters indicate high-quality libraries. (B) Quality assessment for a commercial fixation-first dissociation protocol BALB mammary gland scRNA-Seq library shows a lack of a knee bend and few cells (n = 720). (C) The BALB NeuT mammary scRNA-Seq library was generated from the protocol described here. 18,077 cells were sequenced, with 97% of reads mapped to cells and 98.9% mapped to the filtered probe set. A sharp knee bend, together with distinct clusters, demonstrates good quality, while a commercial fixation-first dissociation protocol BALB NeuT library (D) shows a weak knee bend but non-distinct cell clusters across the 7,119 sequenced cells. Following library generation, Cell Ranger was used to integrate the BALB and BALB NeuT mammary gland libraries, followed by K-Means clustering in the Loupe Cell Browser for direct comparison. Ten unique clusters define the cells that comprise the BALB/c mammary gland, as shown on the T-SNE plots (E,F). In the NeuT transgenic (F) mammary gland, there was an additional population of tumor cells. Within the lymphocyte cluster, Cd4- and CD8a-expressing cells are distributed throughout. Cd4 expression is shown in the insert. Regulatory T cells, defined by Foxp3 expression, were not numerous enough to form a separate cluster but clustered with T cells, as shown in the highlighted feature plot. Please click here to view a larger version of this figure.
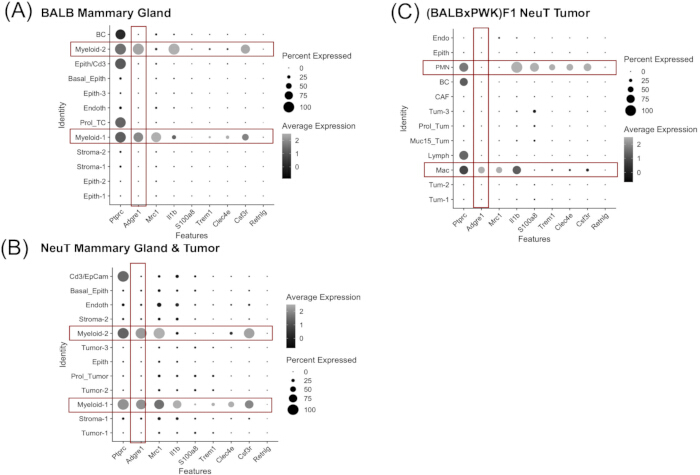
Figure 5: Identification of neutrophils (PMN). PMN are notoriously difficult to identify in scRNA-Seq libraries due to their low RNA transcript levels and poor Ly6g expression. PMN in scRNA-Seq libraries can be identified by using the ‘count’ command in Cell Ranger and including the ‘force cell = 8000’ option in the command line. This analysis was conducted for both the BALB (A) and BALB NeuT (B) mammary gland libraries, but few cells expressed PMN-specific genes. All myeloid cell clusters in BALB and BALB NeuT also expressed Adgre1 (F4/80) and Mrc1 (CD206). Very few cells in the myeloid populations express the PMN-specific genes S100a8, Trem1, and Clec4e. However, this finding is due to the BALB background of the model, as scRNA-Seq libraries prepared using the dissociation technique from (BALBxPWK)F1 NeuT female mice, as described here (C), without the force cell command, were observed to harbor a cluster of cells expressing PMN-specific genes but not Adgre1. This highlights that this dissociation protocol can indeed capture PMNs in addition to other myeloid populations. Red rectangular boxes highlight clusters expressing Adgre1. Please click here to view a larger version of this figure.
| BALB NeuT Tumor | Flow Cytometry | scRNA-Seq |
| CD3 / Lymphocytes | 6% of total cells (12% of CD45+ cells) | 7% of total cells |
| CD4 / Cd4 | 3.9% of total cells (65% of CD45+CD3+ cells) | 4% of total cells |
| CD8 / Cd8a | 1% of total cells (17% of CD45+CD3+ cells) | 0.9% of total cells |
| Foxp3 / Foxp3 | 0.8% of total sells (33% of CD3+CD4+ cells) | 0.7% of total cells |
| F4/80 / Adgre1 | 20% of total cells | 16% of total cells |
| CD64 / Fcgr1 | NT | 14% of total cells |
| PMN/neutrophils | 2% of total cells (5% of CD45+ cells) | 0.05% of total cells |
| PDGFRa (CD140a) / Stroma | 29% of total cells | 10% of total cells |
| EpCAM / Epithelial | 32% of total cells | 54% of total cells |
| NT, not tested |
Table 1: Comparison of cell percentages obtained from this dissociation protocol utilizing downstream techniques, including single-cell RNA sequencing and flow cytometry.
Discussion
This dissociation protocol consistently produces single-cell suspensions composed of populations representative of the parent tissue. In order to isolate representative cell types - including larger fibroblasts and adipocyte stem cells - from mammary tissue, a centrifugal force of 500 x g was used14,21,22. Viability and cell-surface epitopes are reliably maintained across multiple cell types, including immune, epithelial, and stromal populations. One of the logistical advantages of this dissociation protocol is the relatively short time required to progress from initial tissue collection to a clean cell suspension ready for further processing, without the need for specialized machinery. Overall, this workflow takes roughly three hours to complete from start to finish, an advantage over similar enzymatic dissociation protocols that may require overnight exposure of the sample to the enzyme. This protocol was developed and has been used in this and other laboratories in the supplied format since 2023. In the last 6 months alone, the laboratory has performed the protocol 37 times with similar results, and all trainee levels have successfully completed it. In addition to flow cytometry and scRNA-Seq library generation, the protocol has been used to isolate tumor-infiltrating lymphocytes (TIL) and tumor-associated macrophages (TAM) for ex vivo functional analysis. While the results demonstrate that the dissociation protocol can identify major cell populations, it is important to note that flow cytometry and scRNA-Seq are fundamentally different. Flow cytometry is designed to study cells for the expression of multiple markers at the single-cell level and utilizes gating and sub-gating to achieve this goal. scRNA-Seq, on the other hand, is designed to identify the changes in gene expression across a cluster of cells without gating and sub-gating.
Troubleshooting the protocol has included: 1) Incomplete digestion: The digestion of tissue samples is highly influenced by physical dissociation. Mince the tissue until it resembles a paste, spreading it out to observe the size(s) of the tissue pieces. This step takes longer than is often expected. Incomplete dissociation results in a reduced number of stromal and epithelial cells compared with immune cells. 2) Low viability: Cell viability is influenced by the time of digestion and ensuring that the 2:1 ratio of collagenase type II to collagenase D is maintained. A lack of collagenase type II will result in significantly reduced cell viability. Furthermore, if sample viability is between 70–85%, commercially available dead-cell removal systems are effective at improving viability and are recommended before submitting samples for scRNA-Seq library generation. 3) High cell debris: Cell debris is often a side-effect of physical dissociation and digestion. Debris is most effectively removed using a density gradient medium or a commercially available debris-removal solution with a significantly reduced density. 4) Poor pellet recovery: Poor sample recovery is primarily influenced by the amount of starting tissue. This protocol has been optimized for 2 mammary glands or medium-sized tumors ranging between 10 and 20 mg. If the starting sample size contains less than a single mammary gland or a tumor smaller than ~200 mm3, cell yield will be low. If tissue sizes are small, volumes can be reduced by 50%. Similarly, if there are large tumors or multiple mammary glands (greater than 4 mammary glands or tumors larger than ~25 mg, volumes can be increased to 1.5 ×. Samples larger than ~25 mg should be divided for processing. 5) Poor scRNA-Seq quality: Quality of scRNA-Seq libraries is almost entirely dependent on the quality of the originating sample. When working with tumor tissues, the timing of initial gel-bead in emulsion (GEM) and cDNA generation is essential. For this reason, having a protocol that naturally transitions to immediate RNA fixation, such as a probe-based fixed-RNA single-cell chemistry system, removes time as a variable affecting sample quality. That said, assessing RNA quality prior to entering the scRNA-Seq pipeline ensures that the resulting libraries are informative. 6) Lower than expected cell clusters: When results from scRNA-Seq show low levels of gene expression in a few unique clusters, the libraries can be sequenced again to enhance the number of reads (sequencing depth). In addition, if the study is only looking for immune cells, then purifying the CD45+ population prior to library generation will increase sequencing sensitivity.
The commercial fixation and dissociation protocol referenced above was challenged by the processing of adipose tissue. Primarily, the fixed adipose tissue was buoyant and difficult to further dissociate and effectively filter. For this reason, adipose tissue is not recommended for the commercial fixation and dissociation protocol used here. Fixing tissue prior to dissociation into a single-cell suspension eliminated quality-control steps, such as post-fixation viability measurements and dissociation. This made it difficult to estimate sample quality prior to submission for downstream scRNA-seq, a necessary step in the tissue dissociation process. Tissue fixation for downstream scRNA-Seq can degrade RNA. RNA quality can be assessed by examining the nucleotide (nt) read length in fixed cell samples. The higher the percentage of the sample with >200 nt reads, the better the quality. Samples with an RNA integrity score will have >30% of the sample with reads >200 nt, and can then be used to generate scRNA-Seq libraries with high confidence. The fixed samples from the BALB mammary gland and BALB NeuT tumor tissues reported here showed 83% and 82% of reads >200 nt, respectively.
Tissues with high adipose content, such as mammary glands, pose a problem because adipocytes can interfere with the generation of high-quality cell preparations. Most adipocytes remain at the top of the conical tube and can be removed under vacuum or by dumping supernatant. We have found that extremely fatty mammary glands, such as those from New Zealand Obese (NZO) background females, require an additional step: wiping the top of the tube with a clean, lint-free laboratory wipe to facilitate the removal of adipocytes, followed by additional washing steps to fully remove the adipose. Mammary tissues also tend to have lower yields. To mitigate this issue, samples are pooled whenever possible to increase cell yield. For very firm tumors, proper mincing is essential, as it provides collagenases with a reduced surface area to digest within the time needed to generate highly viable single cells.
This protocol does, however, have its limitations. Completely digesting epithelial cells into a single suspension is challenging when obtaining a heterogeneous cell mixture. The BALB NeuT mammary tumors are generally firm, with a tumor capsule and a robust stromal component. In contrast, the collection of infiltrating immune cells requires little exposure to the enzyme, and overexposure can alter their phenotypic state. Thus, to collect tumor and stromal cells, a middle ground must be found to maintain the quality of this diverse range of cell types, including infiltrating neutrophils. Therefore, the proportions of epithelial and stromal cells obtained by this protocol may be lower than those truly represented in the parent tissue. This protocol was optimized through many trials evaluating collagenase enzyme ratios and dissociation times to determine best practices for collecting a highly viable yet heterogeneous sample of high-quality cells. Using this protocol, future directions include ex vivo functional analysis of infiltrating immune cells during the onset and progression of mammary tumors to identify windows of opportunity for treatment.
Disclosures
The authors have no conflicts of interest to disclose.
Acknowledgements
The data presented herein were acquired, in part, using instrumentation in the Genomics Core (RRID: SCR_012406), supported by Michigan State University’s Office of Research & Innovation.
This work was funded by CA278818.
Materials
| Name | Company | Catalog Number | Comments |
|---|---|---|---|
| RPMI | Gibco | 11875-093 | |
| DNAse | Invitrogen | 18047019 | |
| Collagenase D | Sigma | 11088866001 | |
| Collagenase II | Worthington Biochemical | LS004177 | |
| Fetal bovine serum | VWR | 97068-085 | |
| 10x PBS | Gibco | 70011-044 | |
| Sodium azide | VWR | 0639-250G | |
| MACS Smart Strainer, 70 µm | Miltenyi Biotec | 130-110-916 | |
| MACS Smart Strainer, 30 µm | Miltenyi Biotec | 130-110-915 | |
| EDTA | Millipore | 324506-100ML | |
| 10x RBC Lysis Buffer | eBioscience/Invitrogen | 00-4300-54 | |
| Foxp3/Transcription Factor Fixation/Permeabilization kit | eBioscience/Invitrogen | 00-5523-00 | |
| Brilliant Stain Buffer | Invitrogen | 00-4409-42 | |
| Mojosort Dead Cell Removal Kit | Biolegend | 580157 | |
| Mojosort Buffer (5x) | Biolegend | 480017 | |
| Quick-RNA Miniprep Plus Kit | Zymo Research | R1057 | |
| Tumor Dissociation kit, mouse | Miltenyi Biotec | 130-096-730 | |
| PDGFRα PerCP-eFluor710 | Invitrogen | 46-1401-80 | |
| Epcam eF450 | Invitrogen | 48-5791-82 | |
| CD11c APC | Biolegend | 117310 | |
| CD11b AF700 | Invitrogen | 56-0112-82 | |
| Fixable Viability Dye eF780 | Invitrogen | 65-0865-14 | |
| B220/CD45R AF488 | Biolegend | 103225 | |
| CD3 PE-Cy7 | Invitrogen | 25-0031-82 | |
| CD49b PerCP-eFluor710 | Invitrogen | 46-5971-82 | |
| CD8a BV480 | Invitrogen | 414-0081-80 | |
| CD4 SB600 | Invitrogen | 63-0041-82 | |
| CD45 BV711 | Invitrogen | 407-0451-80 | |
| FOXP3 APC | Invitrogen | 17-5773-82 | |
| Ly6G APC | Invitrogen | 17-5931-82 | |
| Ly6C PECy7 | Invitrogen | 25-5932-82 | |
| CD64 PerCP-eFluor710 | 46-0641-80 | ||
| TruStain | Biolegend | 101320 | |
| 10x Genomics GEM-X Flex Gene Expression Reagent Kit | 10x Genomics | (https://www.10xgenomics.com/blog/answering-your-questions-about-single-cell-analysis-in607 clinical-ffpe-samples);1000781 | |
| Attune NxT Flow Cytometer | Thermo Fisher Scientific | Used for collection of flow cytometry data with red, blue, and violet laser channels. | |
| FCS Express | De Novo Software | Used for the analysis of flow cytometry data. | |
| Miltenyi's Tumor Dissociation kit | a commercial tumor dissociation kit | ||
| Miltenyi kit / Miltenyi protocol | the commercial kit" or "the reference kit | ||
| Liberase enzyme | a commercial thermolysin/collagenase blend | ||
| Chop Fix | a commercial fixation-first dissociation protocol | ||
| Flex chemistry / Flex chemistry system | a probe-based fixed-RNA single-cell chemistry | ||
| Seurat | (https://satijalab.org/seurat/ | open-source and vendor clustering tools | |
| Cell Ranger | open-source and vendor clustering tools | ||
| Loupe Cell Browser | open-source and vendor clustering tools | ||
| EnrichR | https://maayanlab.cloud/Enrichr/) | gene-set enrichment and reference cell-atlas tools | |
| Tabula Muris | https://tabula400 muris.sf.czbiohub.org/visualizations | gene-set enrichment and reference cell-atlas tools | |
| Tabula Sapiens | https://tabula-sapiens.sf.czbiohub.org/ | gene-set enrichment and reference cell-atlas tools | |
| Cellometer K2" instrument and "acridine orange / propidium iodide (AOPI)" | an automated cell counter with acridine-orange/propidium-iodide (AO/PI) viability staining | ||
| Kimwipe | a lint-free laboratory wipe | ||
| STEMCELL Technologies | a density-gradient medium (e.g., a Ficoll- or Percoll-type medium) | ||
| Ficoll/Percoll | #10 scalpel blades | ||
| two #10 scalpels | |||
| Cellometer K2 + AOPI reagent | an automated cell counter with acridine-orange/propidium-iodide (AO/PI) viability staining | ||
| STEMCELL Technologies | STEMCELL Technologies, www.stemcell.com, 2018 | ||
| Ficoll/Percoll | a density-gradient medium | ||
| #10 scalpels | surgical scalpel blade | ||
| Foxp3/Transcription Factor Fixation/Permeabilization kit | commercially available solution that allows for intra-nuclear staining |
References
- Jacob JB, et al. Identification of actionable targets for breast cancer intervention using a diversity outbred mouse model. iScience. 2023;26(4):106320. doi:10.1016/j.isci.2023.106320.
- Jacob J, et al. Activity of DNA vaccines encoding self or heterologous HER-2/neu in HER-2 or neu transgenic mice. Cell Immunol. 2006;240(2):96–106.
- Radkevich-Brown O, Jacob J, Kershaw M, Wei WZ. Genetic regulation of the response to HER-2 DNA vaccination in human HER-2 transgenic mice. Cancer Res. 2009;69(1):212–8.
- Lee SH, et al. Activation function 1 of progesterone receptor is required for mammary development and regulation of RANKL during pregnancy. Sci Rep. 2022;12(1):12286. doi:10.1038/s41598-022-16289-x.
- Autengruber A, et al. Impact of enzymatic tissue disintegration on the level of surface molecule expression and immune cell function. Eur J Microbiol Immunol (Bp). 2012;2(2):112–20.
- Bondonese A, et al. Impact of enzymatic digestion on single cell suspension yield from peripheral human lung tissue. Cytometry A. 2023;103(10):777–85.
- Jankelow A, et al. Recent advancements in tissue dissociation techniques for cell manufacturing single-cell analysis and downstream processing. Stem Cells Transl Med. 2025;14(11):szaf055. doi:10.1093/stcltm/szaf055.
- Lombardo JA, et al. Microfluidic platform accelerates tissue processing into single cells for molecular analysis and primary culture models. Nat Commun. 2021;12(1):2858. doi:10.1038/s41467-021-23238-1.
- Sun H, Xu X, Deng C. Preparation of single epithelial cells suspension from mouse mammary glands. Bio Protoc. 2020;10(4):e3530. doi:10.21769/BioProtoc.3530.
- Rodriguez de la Fuente L, Law AMK, Gallego-Ortega D, Valdes-Mora F. Tumor dissociation of highly viable cell suspensions for single-cell omic analyses in mouse models of breast cancer. STAR Protoc. 2021;2(4):100841. doi:10.1016/j.xpro.2021.100841.
- Prater M, Shehata M, Watson CJ, Stingl J. Enzymatic dissociation, flow cytometric analysis, and culture of normal mouse mammary tissue. Methods Mol Biol. 2013;946:395–409.
- Burl RB, et al. Deconstructing adipogenesis induced by β3-adrenergic receptor activation with single-cell expression profiling. Cell Metab. 2018;28(2):300–9.e4.
- Rondini EA, et al. Single cell functional genomics reveals plasticity of subcutaneous white adipose tissue during early postnatal development. Mol Metab. 2021;53:101307. doi:10.1016/j.molmet.2021.101307.
- Sharifian Gh M, Norouzi F. Guidelines for an optimized differential centrifugation of cells. Biochem Biophys Rep. 2023;36:101585. doi:10.1016/j.bbrep.2023.101585.
- Pohlmann PR, Mayer IA, Mernaugh R. Resistance to trastuzumab in breast cancer. Clin Cancer Res. 2009;15(24):7479–91.
- Gajria D, Chandarlapaty S. HER2-amplified breast cancer: mechanisms of trastuzumab resistance and novel targeted therapies. Expert Rev Anticancer Ther. 2011;11(2):263–75.
- Swain SM, et al. Pertuzumab, trastuzumab, and docetaxel for HER2-positive metastatic breast cancer (CLEOPATRA): end-of-study results from a double-blind, randomised, placebo-controlled, phase 3 study. Lancet Oncol. 2020;21(4):519–30.
- Swain SM, Shastry M, Hamilton E. Targeting HER2-positive breast cancer: advances and future directions. Nat Rev Drug Discov. 2023;22(2):101–26.
- Boggio K, et al. Interleukin 12-mediated prevention of spontaneous mammary adenocarcinomas in two lines of HER-2/neu transgenic mice. J Exp Med. 1998;188(3):589–96.
- Gsell L, et al. Multi-cellular phenotypic dynamics during the progression of an immunocompetent breast cancer model. iScience. 2025;28(11):113808. doi:10.1016/j.isci.2025.113808.
- Kilroy G, et al. Isolation of murine adipose-derived stromal/stem cells for adipogenic differentiation or flow cytometry-based analysis. Methods Mol Biol. 2018;1773:137–46.
- Orr JS, Kennedy AJ, Hasty AH. Isolation of adipose tissue immune cells. J Vis Exp. 2013;(75):e50707. doi:10.3791/50707.
Reprints and Permissions
This article has been published
Video Coming Soon