Here, we present a protocol for enriching mitochondrial DNA from single human oocytes using Exonuclease V and preparing duplex sequencing libraries for highly accurate detection of mitochondrial DNA variants using Illumina-compatible sequencing platforms.
Method Article
Protocol for Duplex Sequencing of Mitochondrial DNA in Single Human Oocytes
In This Article
Summary
Abstract
Oocytes are densely packed with mitochondria, the energy-producing organelles that contain their own genome, mitochondrial DNA (mtDNA). Each cell contains multiple copies of mtDNA, with copy number varying among tissue types. Oocytes possess the highest mtDNA copy number, containing hundreds of thousands of mtDNA molecules per cell. Because mitochondria are inherited exclusively through the maternal lineage, accurate detection of mtDNA variants is essential for studies of inheritance, aging, and disease. The presence of multiple mtDNA copies allows wild-type and mutant molecules to coexist within the same cell, a condition known as heteroplasmy, in which low-frequency and de novo variants may occur at frequencies below 1%. Conventional next-generation sequencing (NGS) lacks sufficient accuracy to reliably distinguish these rare variants from errors introduced during library preparation and sequencing. Here, we present a protocol for enriching mtDNA from single human oocytes using Exonuclease V to remove linear DNA, followed by duplex sequencing library preparation for highly accurate mtDNA analysis. This workflow enables error-corrected sequencing of individual oocytes, facilitating reliable detection of low-frequency mtDNA variants and analysis of heteroplasmy and de novo mutagenesis. The protocol provides a reproducible approach for investigating mitochondrial genome variation in single oocytes using Illumina-compatible sequencing platforms.
Introduction
Mitochondria play fundamental roles in essential cellular processes, including energy production, apoptosis, signaling, and calcium homeostasis1. They possess their own genome, mitochondrial DNA (mtDNA), a circular, double-stranded molecule approximately 16.6 kb in length in mammals. Although most ancestral mitochondrial genes were transferred to the nuclear genome during endosymbiosis, mtDNA retains 37 genes encoding 13 oxidative phosphorylation (OXPHOS) polypeptides, 22 transfer RNAs (tRNAs), and two ribosomal RNAs (rRNAs)2. Mutations in mtDNA can impair mitochondrial gene expression and function and may lead to severe disorders3. Because mitochondria are inherited exclusively through the maternal lineage, oocyte mtDNA plays a critical role in fertilization, embryonic development, and offspring health4. Consequently, the detection and characterization of mtDNA mutations and their frequencies are of considerable interest. For example, understanding germline mutagenesis associated with aging and disease is an important prerequisite for developing therapeutic strategies for female infertility.
Unlike nuclear DNA, mtDNA is present in multiple copies per cell, ranging from hundreds to thousands of copies in somatic cells, depending on the tissue type, and exceeding 100,000 copies in mature oocytes4. This high mtDNA copy number makes oocytes well suited for investigating mitochondrial mutagenesis at the single-cell level. However, detecting de novo mtDNA mutations, particularly those present at very low frequencies, remains challenging because the error rates of conventional next-generation sequencing (NGS) exceed the frequencies of many true variants5. Error-corrected sequencing methods are therefore required to distinguish genuine mutations from artifacts introduced during library preparation, amplification, and sequencing. One such approach is duplex sequencing (DS)6,7. In DS, DNA fragments are ligated to adapters containing double-stranded randomized 12-nucleotide molecular tags before amplification. These unique molecular identifiers label each original DNA molecule at both ends, allowing sequencing reads originating from the same template strand to be grouped into families based on their shared tag sequence. A single-strand consensus sequence (SSCS) is generated from each family of reads, after which complementary SSCSs derived from the original DNA duplex are combined to produce a duplex consensus sequence (DCS). Only variants detected in the majority of reads within both complementary SSCSs and confirmed in the resulting DCS are considered true mutations, enabling error rates that are several orders of magnitude lower than those of conventional NGS approaches8. This strategy is particularly advantageous for detecting low-frequency mtDNA variants and heteroplasmy in single cells.
A major limitation of most published duplex sequencing protocols is the requirement for relatively large amounts of input DNA during library preparation, making these methods unsuitable for single-cell applications6,7,9. The overall goal of this protocol is to enable highly accurate duplex sequencing of mtDNA from single human oocytes through an optimized workflow for mtDNA enrichment, library preparation, and sequencing. To minimize sequencing of nuclear mitochondrial DNA segments (NUMTs) and improve sequencing efficiency, this protocol incorporates an Exonuclease V-based enrichment step that selectively digests linear DNA while preserving circular mtDNA. The resulting workflow provides a practical approach for accurate mtDNA variant detection in single oocytes and is suitable for studies investigating heteroplasmy, de novo mutagenesis, aging, and mitochondrial disease.
Protocol
Human oocyte collection and processing were approved by the Ethics Commission of the Johannes Kepler University Linz (Approval No. 1293/2020). Perform all procedures in accordance with institutional guidelines, including informed consent, sample anonymization, and all applicable regulations governing the use of human tissue.
NOTE: Although this protocol is described for human oocytes, adapt the species-specific primers to apply the workflow to other species. Use DNA low-binding consumables (e.g., tubes and pipette tips) throughout the protocol to minimize sample loss. Perform all steps up to the first purification in the original low-binding oocyte collection tube. Do not vortex samples, as vortexing may damage DNA strands. Instead, mix reaction components by gentle pipetting or gentle tube flicking, followed by brief centrifugation. Whenever possible, perform DNA isolation, master mix preparation, and reaction setup in dedicated polymerase chain reaction (PCR) workstations or physically separated laboratory areas to minimize contamination.
1. Preparation of Buffers and Reagents
- Prepare the Oocyte Lysis Buffer (OLB), 10 mM Tris-HCl, TE buffer, TElow buffer, and 10 mM Tris-NaCl according to Table 1 by combining the specified volumes of the stock solutions and bringing each solution to the designated final volume with molecular biology-grade water. Aliquot 1 mL of the prepared buffers, store the aliquots at 4°C, and use them within 1 year.
Table 1: Composition of buffers used throughout the protocol. Buffer compositions and final concentrations for preparation of 10 mM Tris-HCl, TE buffer, TElow buffer, 10 mM Tris-NaCl, and Oocyte Lysis Buffer (OLB). Prepare all buffers using molecular biology-grade water. Adjust the pH of Tris-HCl and EDTA stock solutions before buffer preparation, if required, according to the manufacturer's recommendations. OLB is supplemented with thermolabile proteinase K immediately before sample lysis as described in the protocol. Please click here to download this file.
2. Single Oocyte Collection
NOTE: Human oocytes used in this protocol were collected from patients scheduled for intracytoplasmic sperm injection (ICSI) at the Kinderwunsch Zentrum (fertility center) of the Kepler University Hospital, Linz, Austria. Ovarian stimulation protocols were based on the patient's predicted ovarian response, and dosages were adjusted according to individual characteristics, including age, anti-Müllerian hormone (AMH) levels, and body weight, in accordance with the recommendations of the European Society of Human Reproduction and Embryology (ESHRE)10. Pituitary suppression was achieved using either gonadotropin-releasing hormone (GnRH) agonist or GnRH antagonist protocols in combination with gonadotropin stimulation to promote follicular maturation. Follicular growth was monitored regularly by transvaginal ultrasonography before ovulation was triggered. Oocytes were then retrieved by transvaginal follicular aspiration, and the follicular fluid containing the cumulus–oocyte complexes (COCs) was collected11. Only immature or unfertilized oocytes that could not be used for the patient's ICSI treatment and would otherwise have been discarded were available for research after informed consent had been obtained. Patients with higher antral follicle counts (AFCs) were preferentially approached for oocyte donation because they were more likely to produce immature or unfertilized oocytes suitable for research. All procedures performed before the selection of oocytes for research must comply with national regulations governing in vitro fertilization and the use of human tissue. Handle all materials under sterile conditions in a laminar flow hood. Ensure that all CE-certified materials and culture media that come into direct contact with the oocytes are sterile, prewarmed to 37°C, and maintained at a pH of 7.20–7.40.
- Collect COCs from the follicular fluid and transfer them into 750 µL of GM501 Cult medium under sterile mineral oil following controlled ovarian hyperstimulation and transvaginal oocyte retrieval.
- Remove the surrounding cumulus cells from the zona pellucida (ZP) by enzymatic digestion with hyaluronidase. Incubate the oocytes in 500 µL of GM501 Hyaluronidase (80 U/mL) for 30–60 s at 37°C, followed by three washes in 750 µL of GM501 Cult medium. Carefully remove any remaining cumulus cells mechanically using denudation pipettes.
- For telophase I (TI) or metaphase II (MII) oocytes, open the ZP using a series of laser pulses adjacent to the polar body and remove the first polar body using micromanipulators. Adjust the laser settings according to the thickness of the ZP (1–3 pulses; pulse duration, 1.5–2.6 ms; spot diameter, 16–20 µm). Use the laser to remove any remaining cumulus cells, thereby minimizing contamination of the oocyte with somatic cell DNA.
- Transfer each oocyte individually into 2–3 µL of 1× phosphate-buffered saline (PBS) in a 200 µL low-binding tube. Immediately freeze the tube at −20°C. For long-term storage, transfer the frozen oocytes to −80°C.
NOTE: After thawing, perform the remaining protocol continuously without interruption until completion of the first amplification step. - To monitor potential environmental DNA contamination throughout the protocol, include a negative control consisting of 2 µL of 1× PBS without an oocyte during library preparation (Step 4 onward). Process the negative control identically to all oocyte samples. No detectable DNA should be observed in the negative control at any stage of the protocol.
3. Adapter Synthesis
NOTE: Prepare the adapters before starting library preparation. Store synthesized adapters at −80°C for up to 3 months. Prepare aliquots to avoid repeated freeze–thaw cycles, and do not refreeze adapters after thawing. All oligonucleotide sequences used in this protocol are listed in Table 2.
Table 2: Oligonucleotides and primers used throughout the protocol. The table lists all oligonucleotides used for adapter synthesis, library amplification, quantitative polymerase chain reaction (qPCR), library quantification, and mitochondrial DNA (mtDNA) enrichment estimation, together with their sequences, purification methods, supplied amounts or recommended stock concentrations, and manufacturer. The carrier oligonucleotide sequence shown is the example sequence used in this protocol. The asterisk (*) within primer sequences denotes a phosphorothioate linkage. The randomized nucleotides (N) in the mws55 adapter represent the unique molecular identifier (UMI), whereas Y denotes the degenerate pyrimidine base (C or T). Unless otherwise indicated, oligonucleotides were synthesized using standard desalting purification. Please click here to download this file.
- Prepare an aliquot of 96% ethanol (EtOH) and store it at −20°C for subsequent purification steps. Prepare 80% EtOH fresh immediately before use.
- Mix 20.5 µL each of 100 µM mws51_short and 100 µM mws55 oligonucleotides in a 200 µL low-binding tube to obtain a total volume of 41 µL (2,000 pmol of each oligonucleotide).
- Incubate the combined oligonucleotides at 95°C for 5 min in a thermocycler with the lid temperature set to 110°C. Start the timer after the sample reaches 95°C, switch off the thermocycler after 5 min, and leave the tubes inside the thermocycler for 1 h to allow slow cooling to room temperature (RT) and annealing (“annealed adapter”).
- Prepare an Extension Master Mix by combining 1× NEB Buffer 2 (5.6 µL of 10× stock), 3.5 mM deoxynucleotide triphosphates (dNTPs; 5.6 µL of 10 mM stock), 11.5 U of Klenow fragment (2.3 µL of 5 U/µL stock), and 2.5 µL of molecular biology-grade water to a final volume of 16 µL.
- Remove 1 µL of the annealed adapter prepared in Step 3.3, dilute it 1:20 in TElow buffer, label the aliquot “annealed,” and store it at 4°C for agarose gel electrophoresis.
- Add 16 µL of the Extension Master Mix to the remaining 40 µL of annealed oligonucleotides and mix thoroughly.
- Incubate the reaction at 37°C for 1 h with the thermocycler lid set to 47°C.
- Purify the extended oligonucleotides by EtOH precipitation. Add 28 µL of ammonium acetate (NH4OAc) to the 56 µL reaction mixture and mix thoroughly.
- Transfer the entire reaction to a 1.5 mL low-binding tube and add 168 µL of ice-cold 96% EtOH.
- Invert the tube several times and incubate at −20°C for 30 min to precipitate the DNA.
- Prepare 1 mL of fresh 80% EtOH and cool it to −20°C. Pre-cool the centrifuge to 4°C.
- Centrifuge at 14,000 × g for 30 min.
- Carefully remove the supernatant without disturbing the pellet. Add 1 mL of ice-cold 80% EtOH without mixing or inverting the tube.
- Centrifuge at 14,000 × g for 5 min.
- Remove all residual EtOH and air-dry the DNA pellet for 10–15 min, until no visible liquid remains and the pellet appears transparent. Do not overdry the oligonucleotides.
- Resuspend the pellet in 41 µL of molecular biology-grade water.
- Remove 1 µL, dilute it 1:20 in TElow buffer, label the aliquot “extended,” and store it at 4°C.
- Prepare a Restriction Master Mix by combining 47 µL of molecular biology-grade water, 1× CutSmart Buffer (10 µL of 10× stock), and 15 U of HpyCH4III (3 µL of 5 U/µL stock) to a final volume of 60 µL.
- Add 60 µL of the Restriction Master Mix to 40 µL of purified oligonucleotides and mix thoroughly.
- Incubate the reaction at 37°C for 16 h with the thermocycler lid set to 47°C.
- Prepare 6.5 mL of fresh 80% EtOH and cool it to −20°C. Pre-cool the centrifuge to 4°C.
- Transfer the digested adapters to a 1.5 mL low-binding tube and add 900 µL of molecular biology-grade water.
- Add 500 µL of NH4OAc and mix thoroughly.
- Divide the solution into six 250 µL aliquots in 1.5 mL low-binding tubes. Add 500 µL of ice-cold 96% EtOH to each tube.
- Invert the tubes several times and incubate at −20°C for 30 min to precipitate the DNA.
- Centrifuge at 14,000 × g for 30 min. Carefully remove the supernatant without disturbing the pellet. Add 1 mL of ice-cold 80% EtOH to each tube without mixing or inverting. Centrifuge at 14,000 × g for 5 min.
- Remove all residual EtOH and air-dry the adapter pellets.
- Resuspend each pellet in 6.7 µL of Tris-NaCl buffer and pool all six suspensions to obtain a final volume of 41 µL. Remove 1 µL, dilute it 1:10 in TElow buffer, label the aliquot “cut,” and store it at 4°C.
- Prepare aliquots of the adapter stock and store them at −80°C. Measure the adapter concentration and determine the A260/280 and A260/230 absorbance ratios of the “cut” aliquot using a spectrophotometer. The expected adapter concentration is 30–50 µM, with an A260/280 ratio of >1.7 and an A260/230 ratio of >1.9.
- Run the “annealed,” “extended,” and “cut” aliquots on a 2% agarose gel at 125 V for 45 min to verify adapter formation and complete restriction digestion (Figure 1).
NOTE: The “annealed” aliquot should contain two bands representing the annealed and unannealed fractions. The annealed adapter is expected to migrate at approximately 90 bp and consists of a 13-bp double-stranded region with a 68-nt single-stranded overhang, whereas the unannealed oligonucleotides migrate at approximately 60 bp. Following extension, the adapter consists of a 37-bp double-stranded region with a 44-nt Y-shaped overhang and is expected to migrate at approximately 110 bp. After restriction digestion, an 8-bp fragment is removed from the adapter. Three bands should be visible: a predominant band at approximately 100 bp (final adapter) and two faint bands at approximately 60 bp (remaining unannealed oligonucleotides) and 8 bp (restriction fragment).
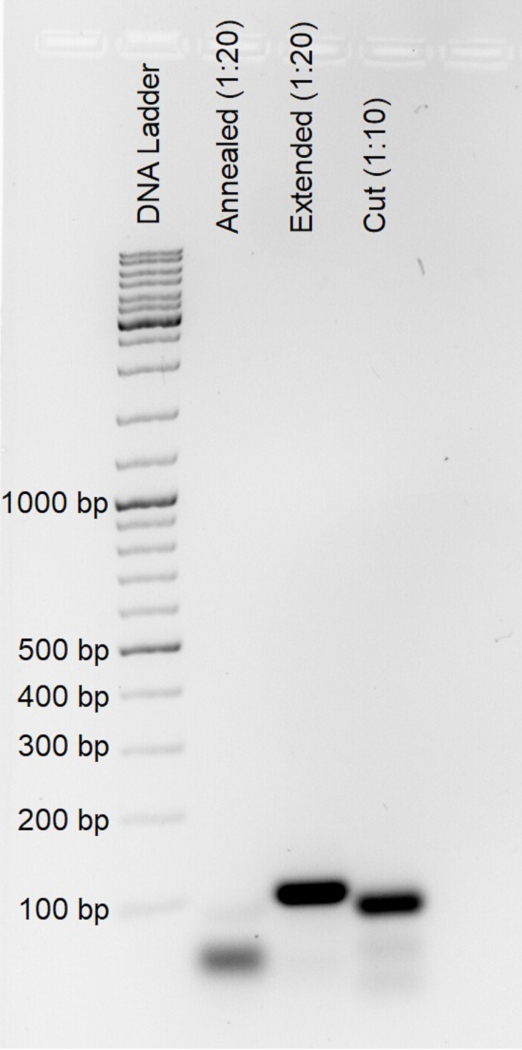
Figure 1. Representative fragment-size analysis of intermediate products and final duplex sequencing adapters. Aliquots collected during adapter synthesis after performing oligonucleotide annealing (“annealed,” diluted 1:20), fill-in extension (“extended,” diluted 1:20), and HpyCH4III restriction digestion (“cut,” diluted 1:10) were analyzed by 2% agarose gel electrophoresis to verify correct duplex sequencing adapter formation. Please click here to view a larger version of this figure.
4. Single-Oocyte Lysis
- Prepare OLB supplemented with thermolabile proteinase K (OLB+) by adding 1 µL of thermolabile proteinase K (0.120 U/µL) to 99 µL of OLB to obtain a final proteinase K concentration of 0.0012 U/µL.
- Thaw the oocytes at RT. Immediately add 4 µL of OLB+ to each oocyte. Rinse the sides of the tube several times with the lysis buffer to ensure complete transfer of the oocyte into the buffer and prevent the sample from adhering to the tube wall.
- Mix the sample thoroughly, briefly centrifuge to collect the contents at the bottom of the tube, and incubate at 37°C for 16 h in a thermocycler with the lid temperature set to 47°C.
NOTE: No independent assessment of oocyte lysis is performed before fragmentation. A 16 h incubation under the specified lysis conditions is generally sufficient for complete lysis of a single oocyte. The amount of recovered DNA may nevertheless vary because of sample loss during handling and differences in mtDNA copy number among oocytes. - Inactivate the thermolabile proteinase K by incubating the samples at 55°C for 15 min in a thermocycler with the lid temperature set to 75°C.
NOTE: Complete the subsequent workflow without interruption after lysis and proteinase K inactivation unless a later protocol step explicitly identifies a stopping point.
5. Exonuclease V Digestion
- Allow the samples to equilibrate to RT before proceeding.
- Prepare an Exonuclease V Master Mix by combining 4 µL of 25 mM magnesium chloride (MgCl₂), 1 µL of 10 mM Tris-HCl, 1 µL of 10 mM adenosine triphosphate (ATP), and 1 µL of Exonuclease V (10 U/µL stock) to obtain a final volume of 7 µL.
- Prepare a 1 mg/mL ribonuclease A (RNase A) working solution by diluting 1 µL of 10 mg/mL RNase A stock with 99 µL of molecular biology-grade water. Add approximately 0.1 µL of the diluted RNase A solution to each lysed oocyte sample.
NOTE: Use a suitable pipette for this step. When processing multiple samples simultaneously, a suitable multichannel pipette may be used, provided that precautions are taken to avoid cross-contamination between samples. Because pipetting accuracy may decrease when dispensing such small volumes with a multichannel pipette, carefully inspect all channels. Alternatively, briefly dipping the pipette tip into the diluted RNase A solution is sufficient to transfer approximately 0.1 µL. Minor deviations from this volume do not affect the performance of the protocol. Verify the approximate transferred volume beforehand using a single-channel pipette. - Add 7 µL of the Exonuclease V Master Mix to each lysed oocyte sample and mix thoroughly. Incubate the samples at 37°C for 1 h in a thermocycler with the lid temperature set to 47°C.
- Add 38 µL of TE buffer to each sample to obtain a final reaction volume of approximately 51 µL. Heat-inactivate the enzymes by incubating the samples at 70°C for 30 min in a thermocycler with the lid temperature set to 75°C.
- Proceed immediately to library preparation.
6. Fragmentation
- Shear the DNA to an average fragment size of approximately 550 base pairs (bp) using sonication.
NOTE: This protocol describes DNA fragmentation using a Covaris M220 focused-ultrasonication instrument, hereafter referred to as the sonicator; however, equivalent systems may also be used. Because the samples contain cellular debris in addition to DNA after lysis, optimize the fragmentation conditions for the specific instrument and sample type to obtain a relatively narrow fragment-size distribution centered around the intended fragment size. - Transfer the entire sample volume (approximately 51 µL) into a 50 µL focused-ultrasonication tube.
- Shear the DNA for 70 s using a Duty Factor of 10%, Peak Incident Power of 75 W, and 200 Cycles per Burst at 20°C.
- Immediately transfer each sheared sample (approximately 50 µL) from the shearing tube into a 200 µL low-binding tube, because the shearing tubes are not low-binding. The original oocyte collection tube may be reused for this purpose. Inspect the lid of the shearing tube for residual liquid and recover any remaining sample to maximize sample recovery.
- Proceed immediately to end repair and A-tailing.
7. End Repair/A-Tailing
- Prepare an End Repair/A-Tailing Master Mix containing 7 µL of End Prep Reaction Buffer and 3 µL of End Prep Enzyme Mix.
- Add 10 µL of the End Repair/A-Tailing Master Mix to each sample to obtain a final reaction volume of 60 µL. Mix thoroughly by pipetting up and down 10 times.
- Incubate the samples at 20°C for 30 min with the thermocycler lid turned off, followed by incubation at 65°C for 30 min with the lid temperature set to 75°C.
- Proceed immediately to adapter ligation.
8. Adapter Ligation
- Prepare a Ligation Master Mix containing 30 µL of Ligation Mix and 1 µL of Ligation Enhancer.
- Thaw one aliquot of the synthesized adapter and dilute it 1:4000 in Tris-NaCl buffer.
- Add 1.5 µL of the diluted adapter to each end-repaired and A-tailed DNA sample. Add 31 µL of the Ligation Master Mix and mix thoroughly.
- Incubate the samples at 20°C for 15 min. Add 1 µL of the diluted adapter to each sample to obtain a final reaction volume of 93.5 µL. Mix thoroughly and incubate at 4°C for 16 h.
- Proceed immediately to purification.
9. Purification of Adapter-Ligated DNA
- Allow the magnetic beads and TElow buffer to equilibrate to RT for at least 30 min. During this time, prepare fresh 80% EtOH. Prepare a carrier oligonucleotide solution by adding 1 µL of the carrier oligonucleotide (sequence not represented in the human genome; see Table 2) to 99 µL of TElow buffer to obtain a final concentration of 1 nM.
- Transfer 74.8 µL of magnetic beads, corresponding to a 0.8× bead-to-sample ratio, into a 1.5 mL low-binding tube. Add the entire 93.5 µL volume of adapter-ligated DNA and mix thoroughly.
- Incubate the bead–sample mixture at RT for 15 min. After 7.5 min, gently mix the suspension and briefly centrifuge the tube.
- Briefly centrifuge the tube, place it on a magnetic rack, and incubate for 5 min to allow complete bead separation. Carefully remove and discard the clear supernatant, then close the tube immediately.
- Add 400 µL of 80% EtOH, incubate for 30 s, and remove the EtOH. Add 200 µL of 80% EtOH, incubate for 30 s, and remove the EtOH.
- Remove the tube from the magnetic rack and briefly centrifuge it. Return the tube to the magnetic rack, remove any remaining EtOH, and air-dry the beads for less than 5 min.
- Add 50 µL of TElow buffer supplemented with carrier oligonucleotides. Remove the tube from the magnetic rack and thoroughly resuspend the beads by pipetting.
- Incubate the suspension at RT for 5 min, mixing occasionally. Briefly centrifuge the tube, return it to the magnetic rack, and incubate for an additional 5 min.
- During the final 5 min of the first magnetic separation, prepare a new 1.5 mL low-binding tube containing 40 µL of magnetic beads. Transfer 50 µL of the eluate into the prepared tube to perform the second purification at a 0.8× bead-to-sample ratio.
- Mix thoroughly and incubate at RT for 15 min. After 7.5 min, gently mix the suspension and briefly centrifuge the tube.
- Place the tube on the magnetic rack and incubate for 5 min to allow complete bead separation. Carefully remove and discard the clear supernatant, then close the tube immediately.
- Add 400 µL of 80% EtOH, incubate for 30 s, and remove the EtOH. Add 200 µL of 80% EtOH, incubate for 30 s, and remove the EtOH.
- Remove the tube from the magnetic rack and briefly centrifuge it. Return the tube to the magnetic rack, remove any remaining EtOH, and air-dry the beads for less than 5 min.
- Add 15.5 µL of Tris-HCl to each sample. Remove the tube from the magnetic rack and thoroughly resuspend the beads by pipetting.
- Incubate the suspension at RT for 5 min, mixing occasionally. Briefly centrifuge the tube, return it to the magnetic rack, and incubate for an additional 5 min.
- Transfer 15 µL of the eluate to a new 200 µL low-binding tube. Remove 1 µL of the eluate and dilute it 1:10 in Tris-HCl for attomole quantitative PCR (qPCR) and mitochondrial DNA (mtDNA) enrichment qPCR analyses.
10. Attomole Estimation
NOTE: Determine the approximate amount of adapter-ligated DNA to adjust the DNA input and the number of cycles used in the subsequent amplification and indexing PCRs. Because the sample quantity is limited, direct concentration measurements may not be reliable; therefore, estimate DNA quantity by qPCR. Analyze the amplification products by agarose gel electrophoresis to assess fragment-size distribution and detect residual adapter dimers. Cq values may vary depending on the reagents and real-time PCR instrument used. Adjustments to Cq values based on adapter-dimer detection, as well as downstream DNA input amounts and PCR cycle numbers, are based primarily on empirical observations and may require optimization for individual library preparations.
- Prepare an attomole qPCR Master Mix containing 5 µL of 2× KAPA HiFi HotStart Reaction Mix (hereafter referred to as the 2× high-fidelity PCR mix), 1 µL of the Dual-NEBNext Universal PCR Primer for Illumina (10 µM; hereafter referred to as the universal library primer), 1 µL of the mws20 primer (10 µM), 0.5 µL of 20× EvaGreen, and 0.5 µL of molecular biology-grade water per reaction.
- Add 8 µL of the Master Mix to each designated well of a qPCR-compatible 96-well plate. Add 2 µL of the 1:10 diluted sample to obtain a final reaction volume of 10 µL.
- Seal the plate and briefly centrifuge it before loading it into the real-time PCR instrument.
- Perform qPCR using the following thermal cycling conditions: 45 s at 98°C, followed by 45 cycles of 15 s at 98°C, 30 s at 65°C, and 45 s at 72°C.
- Determine the quantification cycle (Cq) by setting the fluorescence threshold to 1,000 relative fluorescence units (RFU).
NOTE: Select a fluorescence threshold that is compatible with the real-time PCR instrument and use the same threshold in all experiments to permit comparison of Cq values. - Separate the qPCR amplification products on a 1.5% agarose gel at 125 V for 40 min.
- Inspect the gel for residual adapter dimers. Adapter dimers migrate at approximately 130 bp (Figure 2).
- If adapter dimers are visible, adjust the Cq value using the appropriate attomole Cq correction factor (ACF) shown in Figure 2. Select the ACF according to the intensity of the adapter-dimer band observed in the agarose gel, using the representative examples in Figure 2 as a reference. An ACF-corrected attomole Cq value of 22–26 is optimal; however, values <29 are generally acceptable.
NOTE: Instead of correcting the Cq value, an additional purification may be performed when necessary; however, this may result in substantial library loss. Samples with strong adapter-dimer bands are typically associated with high attomole qPCR Cq values, indicating low DNA input. Samples with Cq values ≥29 generally produce large family sizes and low mitochondrial DNA sequencing depths (<100×) and may therefore be excluded from sequencing. Because Cq values depend on the real-time PCR instrument and assay conditions, establish laboratory-specific cutoff values when implementing this protocol.
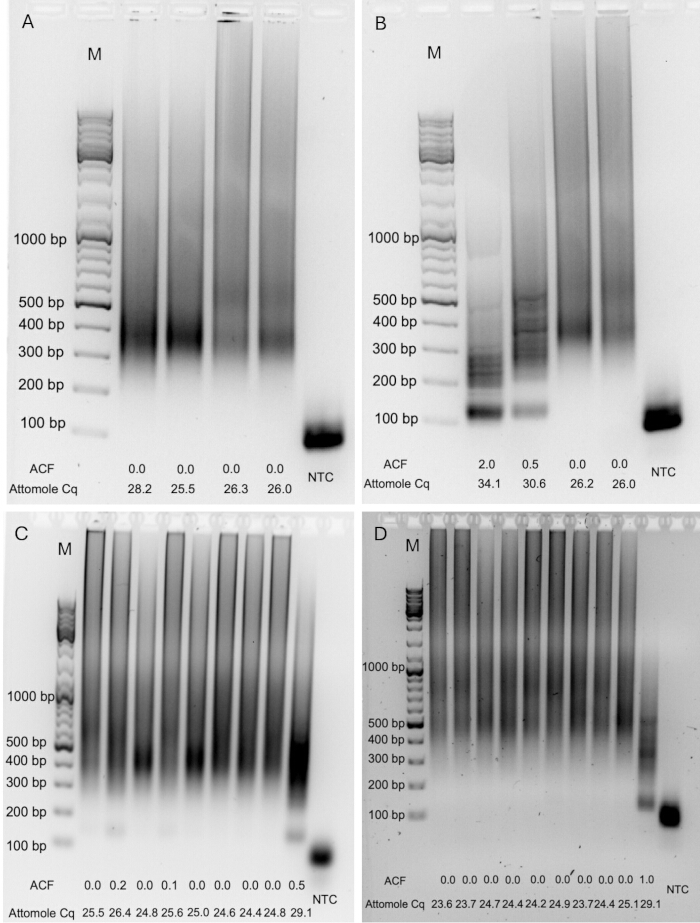
Figure 2. Representative attomole quantitative PCR (qPCR) products used to estimate library input and identify adapter/primer dimers. Amplified attomole qPCR products were analyzed by 1.5% agarose gel electrophoresis to assess fragment-size distribution and detect residual adapter/primer dimers. (A–D) Representative examples showing libraries with different amounts of adapter-ligated DNA and varying levels of adapter/primer dimers. The attomole Cq correction factor (ACF) and the corresponding uncorrected quantification cycle (Cq) are shown for each sample. M, DNA size marker; NTC, non-template control. Please click here to view a larger version of this figure.
11. Mitochondrial DNA Enrichment Estimation (Optional)
NOTE: Estimate mitochondrial DNA (mtDNA) enrichment by qPCR using primers targeting the mitochondrial ND6 gene and nuclear Alu elements. Calculate the difference in Cq values between the nuclear and mitochondrial targets to estimate mtDNA enrichment. Use the absolute Cq value of the mitochondrial target to estimate the amount of mtDNA in the sample. Cq values may vary depending on the reagents, consumables, and real-time PCR instrument used. Adjust the primer sequences for other species. Refer to previous publications for mouse- and macaque-specific primers12,13. This step is optional and provides a rough estimate of mtDNA enrichment before sequencing.
- Prepare separate Master Mixes for the mitochondrial and nuclear targets. For each reaction, combine 5 µL of 2× PowerUp SYBR Green Mix, 0.4 µL of each primer in the respective primer pair (10 µM each), and 2.1 µL of molecular biology-grade water.
- Add 8 µL of the appropriate Master Mix to each designated well of a qPCR-compatible 96-well plate. Add 2 µL of the 1:10 diluted sample to obtain a final reaction volume of 10 µL.
- Seal the plate and briefly centrifuge it before loading it into the real-time PCR instrument.
- Perform qPCR using the following thermal cycling conditions: 2 min at 95°C, followed by 45 cycles of 15 s at 95°C, 20 s at 56°C, and 30 s at 72°C.
- Determine the Cq by setting the fluorescence threshold to 100 RFU.
NOTE: Select a fluorescence threshold that is compatible with the real-time PCR instrument and use the same threshold in all experiments to permit comparison of Cq values. Correlate Cq values with sequencing-derived enrichment efficiencies after sequencing and use these values as references for subsequent library preparations. - Calculate the enrichment-associated ΔCq by subtracting the nuclear-target Cq from the mitochondrial-target Cq (CqmtDNA − CqnDNA). Once initial sequencing data are available, generate a laboratory-specific standard curve to estimate the proportion of sequencing reads derived from mtDNA.
NOTE: If sequencing data are not yet available, Equation 1 may be used to obtain a rough estimate of the expected percentage of mtDNA-derived sequencing reads using an example standard curve generated from seven oocyte libraries (ΔCq = −0.8, 16.83%; ΔCq = −2.1, 33.62%; ΔCq = −3.0, 45.57%; ΔCq = −3.9, 60.34%; ΔCq = −5.0, 77.98%; ΔCq = −6.2, 89.25%; ΔCq = −8.4, 95.09%). A ΔCq value <−1 should be achieved to ensure efficient removal of nuclear DNA. Lower enrichment efficiencies can be compensated for by allocating additional sequencing reads to obtain sufficient mtDNA sequencing depth; however, this may increase nuclear mitochondrial DNA segment (NUMT) contamination. Because the relationship between ΔCq and mtDNA content depends on reagents, consumables, instrumentation, and experimental conditions, Equation 1 should be considered an example calibration and laboratory-specific standard curves should be established whenever possible.
Estimated mtDNA (%) = −11.006 × ΔCq + 13.776 (1)
12. Library Amplification
NOTE: Perform the first amplification in two consecutive PCR steps. Perform the first PCR using a single primer to generate linear amplification. Subsequently, add the second primer to enable exponential amplification during the second PCR.
- Determine the DNA input for the first amplification PCR using the results of the attomole qPCR.
- For single-oocyte libraries, use samples with an attomole qPCR Cq value typically greater than 22. If a sample has a lower Cq value, dilute it to a Cq value of approximately 22 according to Table 3. Libraries with Cq values of ≥29 typically produce large family sizes and shallow mtDNA sequencing depths and are therefore not recommended for continued library preparation or sequencing.
- Prepare an amplification Master Mix containing 20 µL of 2× high-fidelity PCR mix and 4 µL of the mws20 primer (10 µM) per reaction.
- Add 24 µL of the Amplification Master Mix to 14 µL of the diluted sample.
- Perform the linear amplification PCR using the following thermal cycling conditions: 45 s at 98°C, followed by 12 cycles of 15 s at 98°C, 30 s at 60°C, and 45 s at 72°C, followed by 2 min at 72°C.
- Add 4 µL of the universal library primer (10 µM) and mix thoroughly.
- Perform the exponential amplification PCR using the following thermal cycling conditions: 45 s at 98°C, followed by 9 cycles of 15 s at 98°C, 30 s at 65°C, and 45 s at 72°C, followed by a 2 min extension at 72°C.
NOTE: After completion of the first amplification, the samples may be stored at 4°C and the protocol resumed later if necessary. Perform all preceding steps, from oocyte lysis through the first amplification, without interruption. - Add 10 µL of molecular biology-grade water to each sample.
- Purify the amplified DNA using 40 µL of magnetic beads (0.8× the sample volume), following the second magnetic-bead purification procedure described in Steps 9.9–9.15. Wash the beads twice with 200 µL of 80% EtOH, elute the DNA in 15.5 µL of Tris-HCl, and transfer 15 µL of the eluate to a new 200 µL low-binding tube.
NOTE: This is a suitable stopping point. Store the purified DNA at 4°C or proceed immediately to indexing.
Table 3: Dilution factors and corresponding quantitative polymerase chain reaction (qPCR) quantification cycle (Cq) correction factors used to standardize DNA input for the first library amplification polymerase chain reaction (PCR). Samples with attomole qPCR Cq values below the target value were diluted with molecular biology-grade water before the first amplification PCR. The corrected Cq value was obtained by adding the appropriate dilution correction factor to the experimentally measured Cq value and was subsequently used to determine the indexing PCR cycle number and the target sequencing depth (Table 4). The sample and water volumes produce a final input volume of 14 µL for the first amplification PCR. The asterisk (*) indicates that the listed dilution correction factor should be added to the experimentally measured attomole qPCR Cq value to obtain the corrected Cq. The correction factors were determined empirically for this workflow. Please click here to download this file.
13. Indexing
- Determine the number of indexing PCR cycles using the dimer- and dilution-corrected attomole qPCR Cq value according to Table 4.
- Prepare an indexing master mix containing 25 µL of 2× high-fidelity PCR mix and 10 µL of a 10 µM Unique Dual Index Primer Pair for each sample.
- Add 35 µL of the indexing master mix to 15 µL of each amplified sample.
- Perform the indexing PCR using the following thermal cycling conditions: 45 s at 98°C, followed by the appropriate number of cycles consisting of 15 s at 98°C, 30 s at 65°C, and 45 s at 72°C, followed by a final extension at 72°C for 2 min.
- Purify the indexed libraries using 40 µL of magnetic beads (0.8× sample volume). Wash the beads twice with 80% EtOH and elute the DNA in 21 µL of TElow buffer.
- Transfer the eluate to a DNA low-binding tube.
- Measure the DNA concentration using a Qubit High Sensitivity DNA Assay or an equivalent fluorometric assay.
- Store the libraries at 4°C before sequencing or at −80°C for long-term storage.
NOTE: This is a safe stopping point.
Table 4: Indexing polymerase chain reaction (PCR) cycle numbers and target sequencing depth determined from the corrected attomole quantitative polymerase chain reaction (qPCR) quantification cycle (Cq). The corrected Cq value incorporates the experimentally measured attomole qPCR Cq together with any applicable adapter-dimer correction factor (Figure 2) and dilution correction factor (Table 3). The corrected Cq value was used to determine both the number of indexing PCR cycles and the recommended number of paired-end sequencing reads allocated to each library for pooling. The target sequencing read allocations serve as an initial guideline and may require laboratory-specific optimization depending on the real-time PCR instrument, sequencing platform, multiplexing strategy, and experimental requirements. Please click here to download this file.
14. Quality Control
- Assess library quality, fragment-size distribution, and the presence of residual adapter or primer dimers using a Bioanalyzer, TapeStation, or an equivalent nucleic acid fragment analysis instrument. Fragment sizes should range from approximately 300 to 1,000 bp. Small residual peaks (<5% of the sample fluorescence intensity [RFU] in the Bioanalyzer trace) were generally acceptable (Figure 3A–D). Residual adapter or primer dimers appeared as distinct peaks at approximately 70–150 bp (Figure 3E–H). The final library concentration should be at least 5 ng/µL. Refer to Supplementary File 1 (Troubleshooting Guide) if any of these quality criteria are not met.
- (Optional) If adapter or primer dimers are detected (Figure 3E–H), adjust the library volume to 50 µL with molecular biology-grade water, add 40 µL of magnetic beads (0.8× sample volume), and perform an additional purification. Wash the beads twice with 80% EtOH and elute the purified library in 21.5 µL of TElow buffer.
- (Optional) Repeat the quality-control analysis (Step 14.1) to confirm complete removal of adapter and primer dimers.
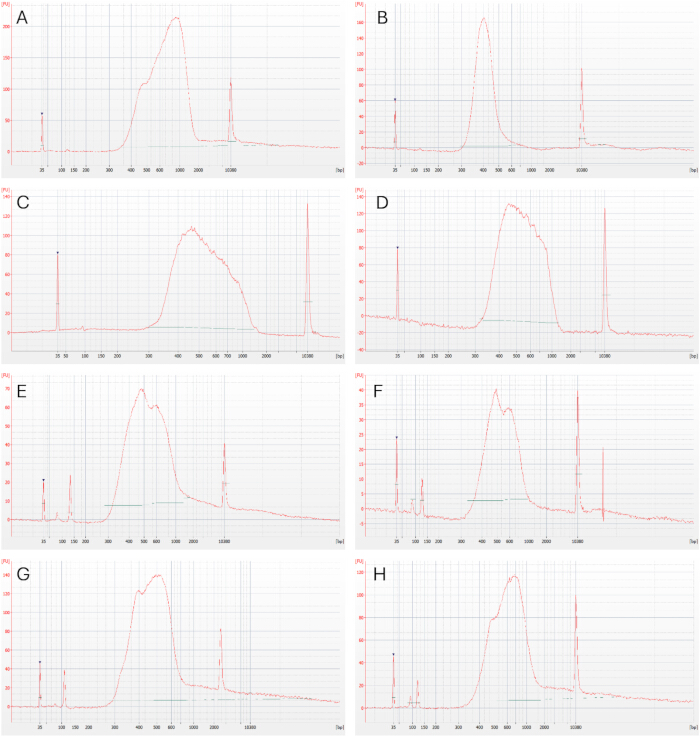
Figure 3. Representative fragment analysis of indexed sequencing libraries. Representative electropherograms generated by Bioanalyzer fragment analysis showing library quality after indexing PCR. (A–D) Libraries with the expected fragment-size distribution (approximately 300-1000 bp) and no detectable adapter/primer dimers, suitable for sequencing without additional purification. (E–H) Libraries containing residual adapter and/or primer dimers that require an additional magnetic-bead purification before sequencing. Peaks at approximately 35 bp and 10,380 bp correspond to the lower and upper internal markers, respectively. Please click here to view a larger version of this figure.
15. Pooling and Sequencing
- Measure the concentration of each indexed library using a qPCR-based library quantification assay compatible with Illumina-prepared libraries, such as the Collibri Library Quantification Kit, according to the manufacturer’s protocol. Dilute each library 1:100,000 in the supplied library dilution buffer and analyze each sample in at least duplicate; triplicate measurements are recommended. Analyze the standards in triplicate.
- Calculate the mean quantification cycle (Cq) value for each sample and standard. Generate a standard curve from the mean Cq values of the standards and calculate the concentration of each library according to the manufacturer’s instructions.
- Pool the libraries according to the intended number of paired-end reads determined from the adapter-dimer- and dilution-corrected attomole qPCR Cq value obtained in Step 10 and the allocations provided in Table 4.
NOTE: The pooling ratio depends on the corrected Cq value of each oocyte library and the corresponding target number of paired-end reads. The values in Table 4 are approximate and may vary among real-time PCR instruments. Establish laboratory-specific values for optimal performance. - Calculate the relative pooling fraction for each library by dividing its target number of paired-end reads by the sum of the target reads assigned to all libraries. Determine the required amount of each library by multiplying this fraction by the total molar amount of the final pool, then calculate the corresponding library volume from its measured molar concentration. Combine the calculated volumes to generate the final pool.
- Sequence the pooled libraries using an Illumina sequencing platform or another platform compatible with Illumina adapter sequences. Use a paired-end configuration with a minimum read length of 2 × 150 bp. Longer reads, such as 2 × 250 or 2 × 300 bp, are recommended because they improve the ability to identify and filter reads derived from shorter nuclear mitochondrial DNA segments (NUMTs).
- Sequence the pooled libraries, for example, on an Illumina NovaSeq 6000 platform using two-channel sequencing-by-synthesis chemistry with an SP Reagent Kit v1.5 (500 cycles) and a paired-end configuration of 2 × 250 bp including a 5% PhiX spike-in. Load the library and perform sequencing according to the manufacturer’s instructions. Representative sequencing performance should achieve ≥75% of bases with a quality score of ≥Q30 and ≥60% of clusters passing filter.
16. Bioinformatic Analysis
NOTE: The following workflow describes data analysis in Galaxy using the Du Novo analysis tools8,14,15. Analysis may also be performed using a local installation of Du Novo or other software developed for duplex sequencing data.
- Upload the demultiplexed paired-end FASTQ files, generated using BCL Convert or an equivalent demultiplexing tool, to a local Galaxy installation or a publicly available Galaxy instance14.
- Assess sequencing-read quality using FastQC (Galaxy version 0.72+galaxy1). Inspect, at minimum, the Per Base Sequence Quality, Per Sequence GC Content, and Adapter Content modules.
- Generate single-strand consensus sequences (SSCSs) and DCSs from the demultiplexed paired-end FASTQ files using the Du Novo pipeline (Galaxy version 3.0.2). Use a minimum family size of three reads for SSCS formation and call a consensus nucleotide when it is present in at least 70% of the reads15. Enable barcode error correction with up to three mismatches. Refer to the Galaxy Training Network Du Novo tutorial for detailed instructions on use of the pipeline16.
- Use Sequence Content Trimmer (Galaxy version 0.2.3) to remove bases represented by “NRYSWKMBDHV” and discard reads shorter than 10 bp.
- Trim the first 10 nucleotides from the 5′ end of each DCS using FASTQ Trimmer (Galaxy version 1.1.5) to reduce end-repair-associated bias. Align the trimmed DCS reads to the human reference genome, such as GRCh38.p14 containing the revised Cambridge Reference Sequence (rCRS; NC_012920.1), using BWA-MEM (Galaxy version 0.7.17.1).
NOTE: Other human genome assemblies, including T2T-CHM13v2.0 or newer assemblies, may be used. - Filter the BAM files using BAMTools Filter BAM datasets on a variety of attributes (Galaxy version 2.5.2+galaxy1). Retain reads with a mapping quality >20 that map to chrM, represent primary alignments, are paired, are properly paired, and have a mapped mate. These criteria reduce potential NUMT-derived alignments17.
- Left-align the reads using Bam Left Align (Galaxy version 1.3.1). Clip overlapping regions of paired DCS reads using BAMUtil clipOverlap (Galaxy version 1.0.15+galaxy1).
- Call single-nucleotide variants (SNVs) and insertions/deletions (indels) using Call variants with LoFreq (Galaxy version 2.1.5+galaxy2) with default settings.
- Exclude paired-end DCS reads containing more than two variants, when present, to reduce potential NUMT contamination. Samples with efficient mtDNA enrichment are typically free of detectable NUMT-derived reads; however, insufficient depletion of nuclear DNA may result in NUMT-derived sequences.
- Inspect each library for potential cross-sample contamination using donor-specific mtDNA sequence differences, including fixed variants and high-frequency heteroplasmies. If cross-sample contamination is detected, apply the precautions described in Supplementary File 1 (Troubleshooting Guide). If the fragment-size distribution exceeds the recommended range or the average fragment size is >900 bp, perform a double size-selective purification as described previously18.
- Perform downstream analyses of the detected variants according to the objectives of the study.
- Only include samples with a mean mitochondrial DCS sequencing depth of ≥100× for downstream analysis. No fixed minimum thresholds were applied for paired-end read count or SSCS or DCS yield.
Results
Duplex sequencing libraries were prepared from human oocytes representing different maturation stages, including germinal vesicle (GV), metaphase I (MI), MII, pronuclear-stage (0PN), and TI oocytes. Successfully prepared libraries were sequenced on an Illumina NovaSeq 6000 platform using an SP flow cell with 2 × 250 bp paired-end reads. Data analysis was performed in Galaxy using the Du Novo pipeline for read-family grouping and consensus-read generation8,14,15. Representative sequencing metrics for successfully processed libraries are summarized in Supplementary Table 1, whereas samples that yielded suboptimal results during library preparation and were excluded from sequencing are summarized in Supplementary Table 2.
Several quality-control steps were performed throughout library preparation to assess the amount of adapter-ligated DNA, mtDNA enrichment, library concentration, and fragment-size distribution. The first quality-control step was the attomole qPCR assay, which was used to estimate the amount of adapter-ligated DNA (Figure 4A,B). The calculated quantification cycle (Cq) value was adjusted when adapter or primer dimers were detected by agarose gel electrophoresis of the qPCR amplification products (Figure 2A–D). Adapter or primer dimers were typically observed in samples with higher Cq values, indicating lower amounts of adapter-ligated DNA. Using the conditions described in this protocol, a mean adjusted attomole qPCR Cq value of 25.8 was obtained (Supplementary Table 1). Based on the corrected Cq value, the DNA input for the first amplification PCR was adjusted according to the dilution scheme shown in Table 3. Samples with corrected Cq values of ≥22 were used without dilution, whereas samples with corrected Cq values of <22 were diluted before amplification. This adjustment was performed to optimize read-family size and reduce the number of sequencing reads required. Samples with corrected Cq values of >28 generally produced larger read families (mean family size, 21.8), resulting in fewer DCSs and a mean mtDNA sequencing depth of <200× (Supplementary Table 1). Adjusting the corrected Cq value to 22–28 resulted in a mean family size of 7.91, which is close to the family size of approximately six reported previously as optimal for duplex sequencing6,7. Larger family sizes may nevertheless be advantageous for very low-input samples, such as single oocytes, because they can increase sequencing depth.
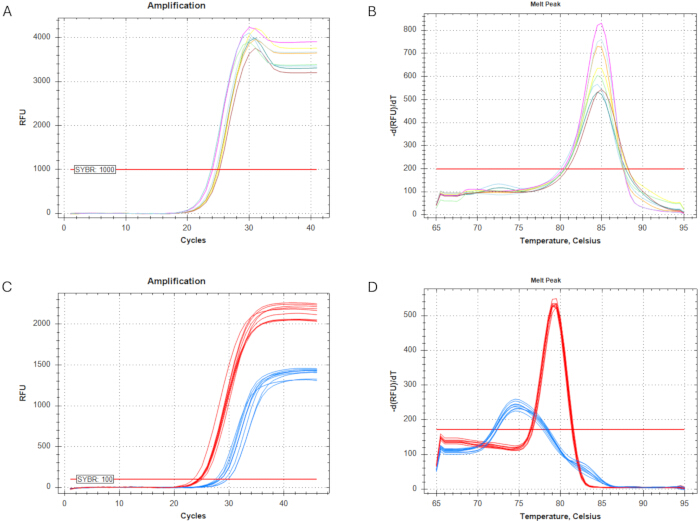
Figure 4. Quantitative PCR (qPCR) assays used for library quantification and mitochondrial DNA (mtDNA) enrichment estimation. Purified adapter-ligated DNA was diluted 1:10 before qPCR analysis. (A) Amplification curves from the attomole qPCR assay used to estimate the amount of adapter-ligated DNA. The fluorescence threshold was set to 1,000 relative fluorescence units (RFU). (B) Melting-curve analysis of the attomole qPCR assay. (C) Amplification curves from the mtDNA enrichment qPCR assay. The fluorescence threshold was set to 100 RFU. Amplification of the mitochondrial NADH dehydrogenase subunit 6 (ND6) target is shown in red, and amplification of the nuclear Alu repetitive-element target is shown in blue. (D) Melting-curve analysis of the mitochondrial and nuclear qPCR products. Please click here to view a larger version of this figure.
Before library pooling, all libraries were analyzed using a Bioanalyzer or TapeStation to assess fragment-size distribution and detect residual adapter or primer dimers. Representative examples of optimal libraries and libraries containing residual adapter or primer dimers are shown in Figure 3A–H. Adapter or primer dimers appeared as peaks at approximately 70–150 bp (Figure 3E–H); when detected, libraries were subjected to an additional magnetic bead purification before sequencing. Because size selection was intentionally omitted to minimize sample loss, the sequenced libraries had a median insert size of 275 bp (Supplementary Table 1).
mtDNA enrichment was estimated by qPCR using mitochondrial and nuclear target loci, allowing prediction of the proportion of sequencing reads expected to map to the mitochondrial genome (Figure 4C,D). The mean Cq values were 25.2 for the mitochondrial target and 29.7 for the nuclear target (Supplementary Table 1), corresponding to a mean ΔCq (CqmtDNA − CqnDNA) of −4.5. On average, 67.5% of paired-end sequencing reads mapped to the mitochondrial reference genome. Both the mtDNA enrichment estimate and the corrected attomole qPCR Cq value were considered during library pooling. Libraries with higher corrected Cq values and more efficient mtDNA enrichment were allocated proportionally fewer sequencing reads according to the sequencing allocation scheme shown in Table 4 to promote balanced sequencing output across samples.
Based on the corrected attomole qPCR Cq values, an average target allocation of 4 million paired-end reads per library was assigned (Table 4). Owing to inefficient cluster generation, an average of 1.3 million paired-end reads per library was obtained after sequencing; however, this sequencing yield was sufficient for downstream duplex sequencing analysis (Supplementary Table 1). Mapping the DCSs to the mitochondrial reference genome yielded a median sequencing depth of 567× across the mitochondrial genome (Figure 5A,B,D; Supplementary Table 1). On average, 344,554 SSCSs and 96,322 DCSs were generated per library (Supplementary Table 1). The resulting libraries had a mean read-family size of 8.32, with larger family sizes generally observed in libraries with higher corrected attomole qPCR Cq values (Figure 5C,E; Supplementary Table 1). These results are consistent with those obtained in a previous study performed at optimal cluster density, in which a median mtDNA sequencing depth of 1,440× was achieved19.
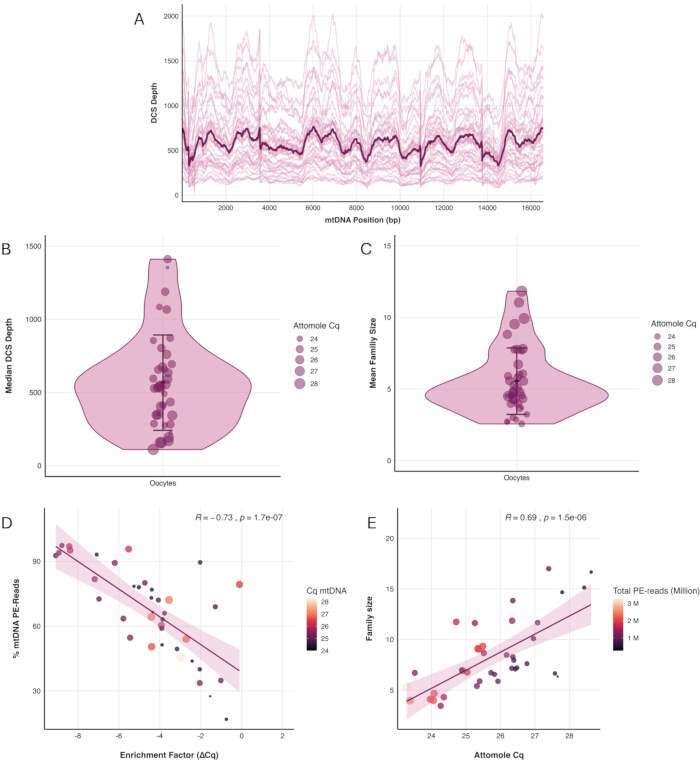
Figure 5. Sequencing performance of single-oocyte duplex sequencing libraries. (A) Duplex consensus sequence (DCS) depth across the mitochondrial genome. Thin lines represent individual libraries, and the bold line represents the mean depth across all libraries. (B) Distribution of the median DCS depth for individual libraries. (C) Distribution of the mean DCS family size for individual libraries. In (B) and (C), each point represents one library, and point color indicates the attomole qPCR quantification cycle (Cq). (D) Pearson correlation between the mtDNA enrichment estimate (ΔCq) and the proportion of sequencing reads aligned to the mitochondrial reference genome. (E) Pearson correlation between the attomole qPCR Cq value and the mean DCS family size. In (D) and (E), each point represents one library; point color indicates the attomole qPCR Cq value, and point size represents the total number of paired-end reads obtained for that library. n = 39 libraries. Please click here to view a larger version of this figure.
Supplementary Table 1. Sequencing and library quality metrics for optimal human oocyte duplex sequencing libraries. This table summarizes pre-sequencing library quality metrics, quantitative polymerase chain reaction (qPCR) measurements, sequencing performance, and duplex sequencing analysis results for libraries that passed quality control and were included in downstream analyses. Reported parameters include oocyte developmental stage, mitochondrial DNA (mtDNA) enrichment qPCR results, attomole qPCR measurements, adapter-dimer correction factor (ACF), indexing PCR cycle number, intended paired-end sequencing depth, library concentration, sequencing yield, mtDNA enrichment, single-strand consensus sequence (SSCS) and duplex consensus sequence (DCS) read counts, family size statistics, sequencing depth, and insert-size distributions. Sample identifiers were anonymized prior to analysis. The intended paired-end read numbers were assigned according to the corrected attomole qPCR quantification cycle (Cq) value (Table 4). Please click here to download this file.
Supplementary Table 2. Pre-sequencing quality metrics for suboptimal human oocyte libraries excluded from downstream duplex sequencing analyses. This table summarizes the pre-sequencing quality-control results for libraries that did not meet the criteria for inclusion in downstream sequencing analyses. Reported parameters include sample identifier, oocyte developmental stage, mitochondrial DNA (mtDNA) enrichment quantitative polymerase chain reaction (qPCR) results, adapter-dimer correction factor (ACF), corrected attomole qPCR quantification cycle (Cq), indexing polymerase chain reaction (PCR) cycle number, and library concentration measured using the Qubit High Sensitivity DNA Assay. Libraries were excluded according to the quality-control criteria described in the protocol. Please click here to download this file.
Supplementary File 1. Troubleshooting guide for single-oocyte mitochondrial DNA duplex sequencing library preparation. This supplementary file provides troubleshooting recommendations for critical steps of the workflow, including prevention of sample loss, adapter preparation and quality assessment, magnetic bead purification, library quality control, sequencing performance, cross-sample contamination, and nuclear mitochondrial DNA segment (NUMT) contamination. The guide complements the main protocol and should be consulted when library quality metrics or sequencing performance fall outside the recommended ranges. Please click here to download this file.
Discussion
mtDNA variants identified in oocytes reflect a combination of de novo mutagenesis, shifts in heteroplasmy across generations, and the effects of aging and disease on the female germline. This protocol describes a method for enriching mtDNA from single oocytes, followed by duplex sequencing library preparation and sequencing, enabling highly accurate detection and analysis of mtDNA mutations. Despite the high mtDNA copy number present in oocytes, this workflow requires preparation of a complete sequencing library from a single cell. Consequently, careful sample handling is essential throughout the procedure, as also detailed in the Supplementary File 1 (Troubleshooting Guide). Despite careful sample handling, approximately 5% of library preparations may fail because of oocyte loss during the initial handling steps or sample loss during library preparation.
Quality control throughout and after library preparation is essential to verify successful adapter ligation, assess mtDNA enrichment, optimize DNA input for amplification, detect residual adapter or primer dimers, and determine whether additional purification or amplification steps are required. Using the same real-time qPCR instrument across library preparations provides consistent reaction conditions and improves the comparability, reproducibility, and reliability of measurements used for downstream quality control and protocol optimization. The PCR cycle numbers for library amplification and indexing described in this protocol may require adjustment when different instruments, enzymes, or reagents are used. The initial amplification step is divided into a linear amplification phase using a single primer, followed by exponential amplification after addition of the second primer. This strategy minimizes the likelihood that errors introduced during the first amplification cycle are propagated to levels at which they become difficult to distinguish from genuine DNA mutations. The recommended cycle numbers were selected to achieve an optimal read-family size for duplex sequencing analysis; however, they may require optimization depending on the amount and quality of the input DNA. Samples with lower DNA input may require additional amplification cycles, whereas samples with higher DNA input may require fewer cycles to avoid overamplification and preserve library complexity.
Although this protocol is demonstrated using single human oocytes, the workflow is not limited to human samples. We have previously applied the same approach to investigate germline mutagenesis in mice and macaques12,13, indicating that duplex sequencing library preparation is applicable to oocytes from multiple species following optimization of species-specific primer sequences and, where necessary, other experimental parameters. Despite the broad applicability of duplex sequencing, the mtDNA enrichment and library preparation workflow described here is not readily transferable to single somatic cells because their mtDNA copy numbers are typically several orders of magnitude lower than those of oocytes, limiting the amount of input DNA available for library preparation. Nevertheless, duplex sequencing libraries can be generated from bulk somatic cell samples when combined with optimized mtDNA enrichment before library preparation. Another limitation of duplex sequencing is the requirement for DNA fragmentation, which can introduce artifactual errors, particularly near fragment termini. Consequently, bases located at fragment ends are typically excluded from downstream analyses, and the detection and characterization of insertions and deletions may also be affected by the fragmentation process. Recent advances in long-read sequencing technologies, particularly those developed by Oxford Nanopore Technologies, may eventually enable highly accurate sequencing of entire mitochondrial DNA molecules without fragmentation. However, achieving the accuracy required for reliable mutation detection currently depends on analysis of native, non-amplified DNA molecules. Because the amount of DNA present in a single oocyte is insufficient for these approaches, their application to this sample type is currently impractical.
Compared with approaches used in previous studies, including long-range PCR and conventional massively parallel sequencing20,21,22, this protocol offers several advantages. Each amplification step carries a risk of introducing artifactual mutations that can confound the detection of low-frequency variants, often necessitating minor allele frequency thresholds of at least 1%. By contrast, the substantially lower error rate achieved by duplex sequencing improves mutation-calling accuracy and exceeds that of conventional sequencing approaches5. Consequently, this method provides a more reliable framework for detecting and quantifying rare mtDNA mutations. Using this workflow, we previously showed that, unlike most somatic tissues, oocytes largely evade the age-related accumulation of mtDNA mutations19. Whether this apparent protective effect is maintained in disease states that alter the ovarian microenvironment, such as endometriosis, and compromise oocyte quality remains unknown and warrants further investigation.
Disclosures
The authors declare no competing interests.
Acknowledgements
We sincerely thank the team at the In Vitro Fertilization Center of Kepler University Hospital Linz for their support with oocyte collection. We also thank N. Stoler and A. Nekrutenko for developing the duplex sequencing analysis instance on Galaxy and for providing guidance on the data analysis. This work was supported by the Austrian Science Fund (FWF) Schrödinger Fellowship (DOI: 10.55776/J4096; BA) and the FWF Stand-Alone Project (DOI: 10.55776/P36928; BA). KDM was supported, in part, by National Institutes of Health grant R01GM116044 and by the Willaman Chair Endowment Fund of the Eberly College of Science at The Pennsylvania State University.
Materials
| Name | Company | Catalog Number | Comments |
|---|---|---|---|
| 96 Unique Dual Index Primer Pairs | New England Biolabs | E6440S/L | Unique dual-index primer pairs for indexing PCR |
| Absolute ethanol, molecular biology grade, 96% | Fisher BioReagents | 15518181 | Prepare fresh 80% ethanol with molecular biology-grade water |
| Agarose, low electroendosmosis | Biozym | 840000 | For preparation of 1.5% and 2% agarose gels |
| Ammonium acetate solution, 5 M | Thermo Fisher Scientific | J60688.AD | Used for ethanol precipitation |
| ATP, 10 mM | New England Biolabs | P0756S/L | Used for Exonuclease V digestion |
| Automated electrophoresis instrument | Agilent Technologies | G2992AA | The discontinued Agilent 2100 Bioanalyzer was used; a 4150 TapeStation or equivalent nucleic acid fragment-analysis instrument may be used. |
| Bioanalyzer High Sensitivity DNA Kit | Agilent Technologies | 5067-4626 | For library size-distribution and adapter-/primer-dimer assessment |
| Carrier oligonucleotide | Integrated DNA Technologies (IDT) | Custom synthesis | Sequence not complementary to the human genome. An example sequence is provided in Table 2. Prepare a 100 nM stock solution and dilute to a final concentration of 1 nM. |
| CFX96 Touch Real-Time PCR Detection System | Bio-Rad | 12011319 | The instrument used in this study is discontinued; a CFX Opus 96 or equivalent real-time PCR instrument may be used, although Cq values may vary. |
| Collibri Library Quantification Kit | Invitrogen | A38524100 | For quantification of indexed libraries before pooling |
| Cumulus-cell removal medium containing hyaluronidase (80 U/mL) | Gynemed | 4 HY 0010 | GM501 Hyaluronidase |
| DNA low-binding PCR tube, 200 µL | Corning | PCR-02-L-C | Axygen Maximum Recovery tube |
| DNA low-binding tube, 0.5 mL | Biozym | 710136 | |
| DNA low-binding tube, 1.5 mL | Biozym | 710176 | |
| DNA Polymerase I, Large (Klenow) Fragment (5 U/µL) | New England Biolabs | M0210S/L | Used during adapter extension |
| dNTP Mix (equimolar dATP, dCTP, dGTP, and dTTP), 10 mM | New England Biolabs | N0447S/L | Used during adapter extension |
| EDTA, 0.5 M (pH 8.0) | Fisher BioReagents | 10628203 | Component of TE and TElow buffers |
| EvaGreen dye, 20× | Biotium | 31077-T | Used in attomole qPCR |
| Exonuclease V (RecBCD), 10 U/µL | New England Biolabs | M0345S/L | Used for digestion of linear DNA |
| Fixed-height comb | Bio-Rad | 1704446EDU | For agarose gel electrophoresis |
| Focused-ultrasonication instrument | Covaris | 500295 | M220 focused ultrasonicator |
| Focused-ultrasonication tube, 50 µL | Covaris | 520166 | microTUBE-50 AFA Fiber Screw-Cap |
| Gel-loading dye, 6× | Thermo Fisher Scientific | R1161 | TriTrack DNA Loading Dye |
| GM501 Mineral Oil | Gynemed | 4 MO 0100 | Used to overlay the oocyte collection medium to prevent evaporation and maintain stable sterile culture conditions, including temperature, osmolality, and pH, during oocyte handling |
| High-fidelity PCR Mix, 2× | KAPA Biosystems | KK2602 | KAPA HiFi HotStart ReadyMix |
| High-sensitivity fluorometric DNA assay kit | Invitrogen | Q32854 | Qubit dsDNA High Sensitivity Assay Kit |
| HpyCH4III restriction enzyme (5 U/µL) | New England Biolabs | R0618S/L | Used for adapter restriction digestion |
| Laboratory centrifuge, refrigerated | Eppendorf | 5406000313 | Must support 14,000 × g at 4 °C |
| Laser system for zona pellucida opening | Vitrolife | 19310/0146 | Used for polar-body removal |
| Library preparation kit | New England Biolabs | E7645S/L | NEBNext Ultra II DNA Library Prep Kit; includes end repair/A-tailing and ligation reagents |
| Magnesium chloride solution, 25 mM | New England Biolabs | B9021S/L | Used for Exonuclease V digestion |
| Magnetic bead purification reagent | Beckman Coulter | A63881 | AMPure XP Beads |
| Magnetic rack | Invitrogen | 12-321-D | For magnetic-bead separation |
| Micromanipulator | Luigs & Neumann GmbH | SM II/2 | Used for polar-body removal |
| Microscope | Olympus | IX51 | Used for polar-body removal |
| Molecular biology-grade water | Thermo Fisher Scientific | 327290010 | Used for reagent preparation and dilutions |
| Oocyte culture medium | Gynemed | 4 GM 501H-20 | GM501 Cult medium |
| PCR plate, 96-well | Biozym | AF4TI-0960-C | Clear wells, clear frame, low-profile, skirted |
| PCR plate seal | Bio-Rad | MSB1001B | Compatible with the real-time PCR instrument |
| Phosphate-buffered saline (PBS), 20× | Cell Signaling Technology | 9808S | Dilute to 1× with molecular biology-grade water |
| Pipettes for manipulation and transfer of cumulus–oocyte complexes (COCs) and oocytes | CooperSurgical | MXL3-150 (150 µm) | Used for mechanical removal of cumulus cells and transfer of COCs and oocytes. Refer to the manufacturer's website for additional pipette sizes. |
| Power supply for gel electrophoresis | Bio-Rad | 1645050 | PowerPac Basic Power Supply |
| PowerUp SYBR Green Master Mix, 2× | Applied Biosystems | 15350929 | Used for mitochondrial and nuclear qPCR assays |
| Qubit Fluorometer | Invitrogen | Q33238 | The discontinued Qubit 1 Fluorometer was used; a newer version or equivalent fluorometric nucleic acid quantification instrument may be used. |
| RNase A, 10 mg/mL | Thermo Fisher Scientific | 10753721 | Dilute to 1 mg/mL before use |
| Spectrophotometer | Thermo Fisher Scientific | NDULTRAGL | The discontinued NanoDrop OneC instrument was used; a newer version or equivalent microvolume spectrophotometer may be used. |
| SYBR Safe DNA Gel Stain | Invitrogen | S33102 | For agarose gel electrophoresis |
| Thermal cycler | Bio-Rad | 1861096 | T100 Thermal Cycler |
| Thermolabile Proteinase K (0.120 U/µL) | New England Biolabs | P8111S/L | Used for single-oocyte lysis |
| Tris-acetate-EDTA (TAE) buffer, 50× | Fisher Scientific | BP1332-1 | Dilute to 1× for agarose gel electrophoresis |
| Tris-HCl (pH 8.0), 1 M | Fisher BioReagents | 10336763 | Used for reagent preparation and dilutions |
| Tween 20 | Fisher BioReagents | 11417160 | Component of the Oocyte Lysis Buffer |
| Universal DNA ladder | Thermo Fisher Scientific | SM0333 | GeneRuler Ready-to-Use DNA Ladder (100–1,000 bp) |
| Wide Mini-Sub Cell GT Cell | Bio-Rad | 1704468EDU | For agarose gel electrophoresis |
| Wide Mini-Sub Cell GT UV-Transparent Gel Tray (15 × 7 cm) | Bio-Rad | 1704426 | For agarose gel electrophoresis |
References
- Dyall SD, Brown MT, Johnson PJ. Ancient invasions: from endosymbionts to organelles. Science. 2004;304:253-257. doi:10.1126/science.1094884.
- Pakendorf B, Stoneking M. Mitochondrial DNA and human evolution. Annu Rev Genomics Hum Genet. 2005;6:165-183. doi:10.1146/annurev.genom.6.080604.162249.
- Ng YS, Turnbull DM. Mitochondrial disease: genetics and management. J Neurol. 2016;263:179-191. doi:10.1007/s00415-015-7884-3.
- Shoubridge EA, Wai T. Mitochondrial DNA and the mammalian oocyte. In: St John JC, editor. Current Topics in Developmental Biology. Vol. 77: The Mitochondrion in the Germline and Early Development. San Diego (CA): Academic Press; 2007. p. 87-111. doi:10.1016/S0070-2153(06)77004-1.
- Fox EJ, Reid-Bayliss KS, Emond MJ, Loeb LA. Accuracy of next generation sequencing platforms. Next Gener Seq Appl. 2014;1:1000106. doi:10.4172/jngsa.1000106.
- Kennedy SR, et al. Detecting ultralow-frequency mutations by Duplex Sequencing. Nat Protoc. 2014;9:2586-2606. doi:10.1038/nprot.2014.170.
- Schmitt MW, et al. Detection of ultra-rare mutations by next-generation sequencing. Proc Natl Acad Sci U S A. 2012;109:14508-14513. doi:10.1073/pnas.1208715109.
- Stoler N, et al. Family reunion via error correction: an efficient analysis of duplex sequencing data. BMC Bioinformatics. 2020;21:96. doi:10.1186/s12859-020-3419-8.
- Abascal F, et al. Somatic mutation landscapes at single-molecule resolution. Nature. 2021;593:405-410. doi:10.1038/s41586-021-03477-4.
- The ESHRE Guideline Group on Ovarian Stimulation, Ata B, Bosch E, Broer S, Griesinger G, Grynberg M, et al. ESHRE guideline: ovarian stimulation for IVF/ICSI: an update in 2025. Hum Reprod. 2026;41:498-514. doi:10.1093/humrep/deag018.
- The ESHRE Working Group on Ultrasound in ART, et al. Recommendations for good practice in ultrasound: oocyte pick up. Hum Reprod Open. 2019;2019:hoz025. doi:10.1093/hropen/hoz025.
- Arbeithuber B, et al. Age-related accumulation of de novo mitochondrial mutations in mammalian oocytes and somatic tissues. PLoS Biol. 2020;18:e3000745. doi:10.1371/journal.pbio.3000745.
- Arbeithuber B, et al. Advanced age increases frequencies of de novo mitochondrial mutations in macaque oocytes and somatic tissues. Proc Natl Acad Sci U S A. 2022;119:e2118740119. doi:10.1073/pnas.2118740119.
- The Galaxy Community. The Galaxy platform for accessible, reproducible, and collaborative data analyses: 2024 update. Nucleic Acids Res. 2024;52:W83-W94. doi:10.1093/nar/gkae410.
- Stoler N, Arbeithuber B, Guiblet W, Makova KD, Nekrutenko A. Streamlined analysis of duplex sequencing data with Du Novo. Genome Biol. 2016;17:180. doi:10.1186/s13059-016-1039-4.
- Nekrutenko A, Stoler N. Calling very rare variants. Galaxy Training Network. Available from: https://training.galaxyproject.org/training-material/topics/variant-analysis/tutorials/dunovo/tutorial.html. Accessed July 25, 2026.
- Barnett DW, et al. BamTools: a C++ API and toolkit for analyzing and managing BAM files. Bioinformatics. 2011;27:1691-1692. doi:10.1093/bioinformatics/btr174.
- Illumina. Double sided size selection and bead clean up. Illumina Knowledge Base. Available from: https://knowledge.illumina.com/library-preparation/general-library-prep/library-preparation-general-library-prep-reference_material-list/000006157. Accessed July 25, 2026.
- Arbeithuber B, et al. Allele frequency selection and no age-related increase in human oocyte mitochondrial mutations. Sci Adv. 2025;11:eadw4954. doi:10.1126/sciadv.adw4954.
- Mertens J, et al. Mitochondrial DNA variants segregate during human preimplantation development into genetically different cell lineages that are maintained postnatally. Hum Mol Genet. 2022;31:3629-3642. doi:10.1093/hmg/ddac059.
- Mertens J, et al. Children born after assisted reproduction more commonly carry a mitochondrial genotype associating with low birthweight. Nat Commun. 2024;15:1232. doi:10.1038/s41467-024-45446-1.
- Van Der Kelen A, et al. The interplay between mitochondrial DNA genotypes, female infertility, ovarian response, and mutagenesis in oocytes. Hum Reprod Open. 2025;2025:hoae074. doi:10.1093/hropen/hoae074.
Reprints and Permissions
This article has been published
Video Coming Soon