This study aimed to predict the efficacy of rituximab (RTX) in membranous nephropathy (MN). In this retrospective cohort, combined anti-phospholipase A2 receptor (PLA2R) antibody titer and early B-cell reconstitution demonstrated better predictive performance for poor response and were independently associated with non-remission in internal analysis.
Research Article
Combined Anti-Phospholipase A2 Receptor and Early B-Cell Reconstitution Predict Rituximab Response in Membranous Nephropathy
In This Article
Summary
Abstract
A retrospective observational design was adopted for this clinical investigation. 105 anti-phospholipase A2 receptor (PLA2R)-associated membranous nephropathy (MN) patients who received standard rituximab (RTX) treatment at Ganzhou People's Hospital between January 2023 and December 2024 were enrolled, 102 patients were retained after exclusion. They were divided into remission and non-remission groups at 12-month follow-up. The receiver operating characteristic (ROC) curve assessed the predictive performance of anti-PLA2R measurement, early B-cell recovery assessment, and their combination. Multivariate Cox regression identified independent risk factors for poor treatment response. Patients were stratified by cut-off values, and cumulative remission rates were compared using the Log-rank test. Of all enrolled patients, 66 (64.7%) achieved remission, and 36 (35.3%) did not. Baseline characteristics were comparable between groups (all P > 0.05). Non-remission patients had higher baseline anti-PLA2R levels and higher rates of early B-cell reconstitution (both P < 0.001). ROC analysis showed single anti-PLA2R predicted poor RTX efficacy with an area under the curve (AUC) = 0.756 [95% confidence interval (CI): 0.663–0.849], while early B-cell reconstitution yielded an AUC = 0.681 (95% CI: 0.567–0.794). Their combined prediction achieved an AUC of 0.854 (95% CI: 0.784–0.924), superior to the single indicators (all P < 0.05). Multivariate analysis identified baseline anti-PLA2R > 155 RU/mL and early B-cell reconstitution as independent risk factors for unsatisfactory RTX response (all P < 0.05). Log-rank test revealed differences in cumulative remission rates across risk subgroups (P < 0.001): low-risk (72.5% at 6 months, 90.0% at 12 months), medium-risk (40.5%, 64.3%), and high-risk (15.0%, 30.0%). In this retrospective single-center cohort, the combined baseline anti-PLA2R titer and early B-cell reconstitution showed promising discriminative performance for RTX outcomes in an internal cohort evaluation. This represents an internally evaluated risk-stratification approach; prospective external validation is mandatory prior to any clinical application.
Introduction
Regarded as one of the most prevalent pathological causes contributing to primary nephrotic syndrome in adult populations, membranous nephropathy (MN) accounts for roughly 20% to 30% of all adult-onset nephrotic syndrome cases in clinical practice1,2. Characteristic pathological changes can be clearly observed in this disorder. Immune complex deposits tend to accumulate on the epithelial side of glomerular basement membranes, thereby further triggering basement membrane thickening and progressive podocyte injury in renal tissues. Clinically affected patients are mostly manifested with massive proteinuria, hypoalbuminemia, systemic edema, and hyperlipidemia3,4. Close correlations have been confirmed between the onset progression of MN and endogenous autoimmune disturbances. The identification of circulating anti-phospholipase A2 receptor (PLA2R) antibodies has been acknowledged as a landmark advancement within contemporary nephrology research5. Being identified as the predominant target antigen for idiopathic MN, PLA2R can trigger specific immune responses in most affected individuals. Relevant clinical findings reveal that such autoantibodies are detectable in the serum specimens obtained from 70% to 80% patients diagnosed with primary MN6. Wide clinical application values have been embodied by these specific serum antibodies. They are now widely used not only to confirm the definitive diagnosis of primary MN but also to distinguish it from various secondary MN subtypes. Moreover, these serological indicators can effectively reflect ongoing disease activity and provide reliable reference evidence for long-term clinical prognostic judgment.
The clinical course of MN varies substantially among affected individuals. Spontaneous disease remission can be achieved in roughly thirty percent of diagnosed cases. Another 30% to 40% of patients will retain persistent nephrotic syndrome throughout follow-up. The remaining cases, by contrast, tend to develop end-stage renal disease (ESRD) gradually within a period of 10 to 15 years of observation7,8. For high-risk individuals who suffer from unrelenting proteinuria or progressive deterioration of renal function, immunosuppressive interventions are regarded as a core measure to slow down disease advancement. Conventional therapeutic regimens mainly combine glucocorticoids with alkylating agents such as cyclophosphamide or applying calcineurin inhibitors (CNIs) alone or in combination. Satisfactory therapeutic effects have been verified in clinical practice, yet long-term administration of these agents will trigger a host of undesirable side effects. Bone marrow suppression, recurrent infection events, elevated malignancy possibility, and inherent renal toxicity are among the most commonly reported adverse reactions9,10. Given the above clinical limitations, the exploration of safer and more efficacious therapeutic approaches has long been deemed a core research hotspot in the clinical management of MN.
As a chimeric anti-cluster of differentiation (CD) 20 monoclonal antibody, rituximab (RTX) selectively depletes peripheral B lymphocytes. It further blocks the abnormal production of pathogenic antibodies, thereby fundamentally interfering with the immune-mediated pathogenesis underlying MN11. According to clinical guidelines issued by Kidney Disease: Improving Global Outcomes (KDIGO)12, this biological agent has been listed as one of the preferred immunosuppressive options for MN management. Nevertheless, real-world clinical observations have confirmed obvious interindividual discrepancies in its therapeutic performance13. Certain patients gain rapid and sustained disease remission after RTX administration, whereas others fail to respond adequately or experience early disease relapse shortly after treatment14. Such distinct response diversities reveal that traditional clinical and pathological indicators alone cannot precisely forecast treatment outcomes. Reliable early predictive biomarkers are therefore urgently required to facilitate individualized therapeutic planning. This strategy also helps prevent unnecessary medical interventions and reduces waste of clinical resources.
As a specific serological marker of disease activity in MN, circulating anti-PLA2R antibody levels show a strong correlation with long-term clinical outcomes. Multiple clinical investigations have validated that patients presenting with elevated baseline anti-PLA2R titres tend to suffer from more severe proteinuria, attain lower rates of spontaneous remission, and gain unsatisfactory responses to standard immunosuppressive regimens15. Prospective clinical analyses have further demonstrated that an early drop in anti-PLA2R antibody concentrations following RTX intervention is a vital predictor of subsequent alleviation of proteinuria. Even so, such serological titres merely mirror the final status of humoral immune activation, namely the overall burden of autoantibody synthesis, and fail to fully account for widespread interindividual variations in therapeutic efficacy16. Clinical realities have demonstrated that satisfactory disease remission can still be achieved in certain cases with notably high initial antibody values. By comparison, several patients with relatively low baseline titres may develop obvious drug insensitivity instead. This phenomenon strongly indicates that inherent host responsiveness toward targeted medications also exerts a non-negligible influence on final treatment prognosis.
Being the direct therapeutic target of RTX, B lymphocytes undergo distinct depletion and repopulation processes. Such dynamic immune shifts not only mirror the actual pharmacological effect of this agent but may also shed light on the intrinsic immune reconstruction capacity within the human body. CD20+ B-cells can be eliminated by RTX via multiple functional pathways, including antibody-dependent cellular cytotoxicity (ADCC), complement-dependent cytotoxicity (CDC), as well as direct cellular apoptosis induction17. In theoretical terms, sufficient depletion of peripheral B-cells stands as an essential prerequisite for RTX to exert its clinical benefits. In actual clinical scenarios, however, marked differences are observed among patients in how long B-cell depletion lasts and how quickly these immune cells recover. Previous clinical evidence has pointed out that individuals experiencing relatively quick B-cell recovery after RTX exposure face a higher likelihood of disease relapse18. Early B-cell reconstitution is presumed to stem from accelerated drug metabolism and clearance, robust endogenous B-cell regenerative potential, or alternative signaling routes that trigger abnormal B-cell activation. All these underlying mechanisms can lead to unsatisfactory therapeutic outcomes19. From this perspective, early B-cell reconstitution is far more than a simple pharmacodynamic indicator. It can also act as a tangible manifestation of individual immune characteristics and possesses independent predictive significance that differs completely from serum autoantibody titres.
Combined application of serum anti-PLA2R antibody titres and early B-cell reconstitution is proposed to forecast the clinical efficacy of RTX. The former index reflects overall disease severity and the cumulative burden of target antigens, while the latter captures individual host responsiveness, including drug susceptibility and inherent immune restoration capacity. These two biomarkers complement each other from separate research perspectives, which makes it feasible to establish a more accurate prognostic prediction system20. Even so, relevant clinical research that integrates both indicators to predict RTX treatment outcomes in MN remains scarce worldwide. In particular, evidence for validation from Chinese patient cohorts remains largely insufficient. Most currently available studies merely concentrate on the prognostic role of a single biomarker, or only carry out basic correlation analyses. Few investigations have systematically evaluated the incremental clinical benefits brought by combined risk stratification, nor have they clarified its practical guiding value in routine clinical decision-making.
Against the aforementioned research backdrop, this retrospective cohort study enrolled 102 patients with PLA2R-associated MN. The hypothesis was that elevated baseline anti-PLA2R antibody titers and early B-cell reconstitution (defined as the percentage of CD19+ B-cells among total lymphocytes exceeding the assay-defined threshold within 6 months after treatment) are independently associated with 12-month non-remission, and that their combination predicts RTX response more accurately than either biomarker alone. The novelty lies in integrating a humoral indicator of autoimmune burden (anti-PLA2R titer) with a cellular indicator of pharmacodynamic response and immune recovery capacity (early B-cell reconstitution) in a Chinese PLA2R-associated MN cohort, and in constructing a three-tier risk-stratification system for internal evaluation; this tool is hypothesis-generating, not validated for routine clinical decision-making, and awaits prospective external confirmation.
Protocol
This retrospective research protocol has been formally reviewed and approved by the Ethics Committee of Ganzhou People's Hospital (Approval No.: PJB2026-157-01; approval date: May 26, 2026). Ethical approval for this retrospective data analysis was obtained before the data analysis was initiated, and the study was conducted in full compliance with the institutional regulations of Ganzhou People's Hospital. All study procedures were strictly implemented in full compliance with the ethical principles laid down in the Declaration of Helsinki. Informed consent was waived for this study.
Study design
This study was conducted in a retrospective cohort manner. A total of 105 patients diagnosed with PLA2R-related MN who received RTX therapy at Ganzhou People's Hospital between January 2023 and December 2024 were initially screened, and 3 patients were excluded because of secondary MN (n = 2) and a history of malignant tumor (n = 1); thus, 102 eligible subjects were finally enrolled after strict implementation of exclusion criteria. All enrolled participants were further categorized into two subgroups based on therapeutic outcomes assessed at the 12-month follow-up. Those achieving complete or partial remission were assigned to the remission group, while cases with persistent treatment failure or disease relapse were classified into the non-remission group (Figure 1).
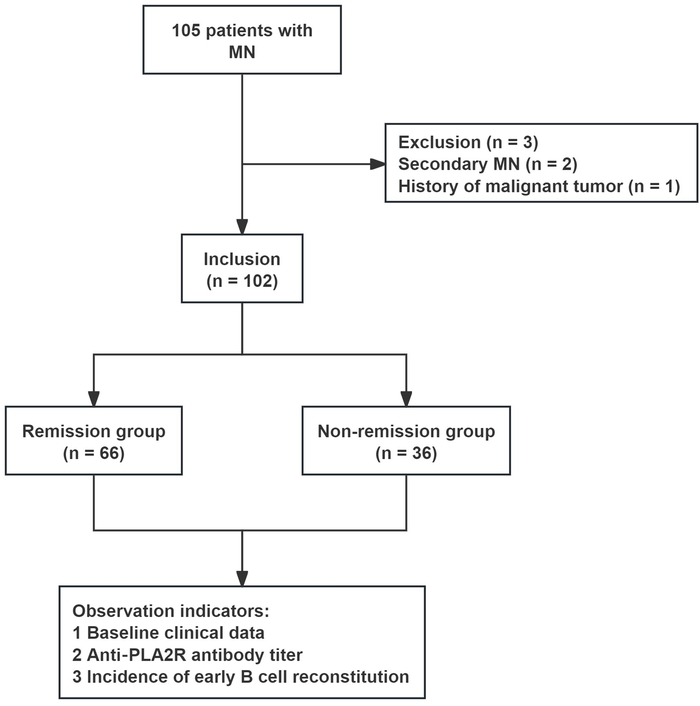
Figure 1: Flow chart of the study. A total of 105 patients with MN were initially screened. After excluding 3 patients (2 with secondary MN and 1 with a history of malignant tumor), 102 patients with PLA2R-associated MN were finally enrolled. Based on 12-month treatment response, patients were divided into the remission group (n = 66) and the non-remission group (n = 36). The main observation indicators included baseline clinical data, anti-PLA2R antibody titer and incidence of early B-cell reconstitution. Abbreviations: MN: membranous nephropathy; PLA2R: phospholipase A2 receptor. Please click here to view a larger version of this figure.
Inclusion criteria
Subjects aged between 18 years and 75 years old; Definite diagnosis of MN confirmed by renal biopsy pathology; Positive serological detection results of serum anti-PLA2R antibodies; Administration of RTX in accordance with standardized clinical regimens; No prior use of other immunosuppressive agents before RTX initiation, or prior use of systemic glucocorticoids, alkylating agents (e.g., cyclophosphamide), CNIs (e.g., tacrolimus, cyclosporine), mycophenolate mofetil/mycophenolic acid, azathioprine, or leflunomide had been discontinued for no less than 6 months. This eligibility rule was set to eliminate the confounding influence of former therapies on therapeutic effect evaluation21. Complete and accessible clinical medical records were available for all enrolled candidates.
Exclusion criteria
Patients with secondary MN; those with other glomerular diseases; individuals with severe renal insufficiency, defined as an estimated glomerular filtration rate (eGFR) <30 mL/min/1.73 m2 or serum creatinine (Scr) >3.0 mg/dL (265 μmol/L); patients with active or uncontrolled infections; those with a confirmed history of malignancy; patients with severe cardiopulmonary disease or primary immunodeficiency disorders; and participants with incomplete clinical data22.
Therapeutic regimen
All enrolled patients received an intravenous infusion of RTX. All 102 patients received the same standardized RTX regimen: a weekly dosage of 375 mg per square meter of body surface area for four consecutive weeks; no patient received the intensified high-dose regimen. To prevent infusion-related adverse reactions, preventive medications were given half an hour before drug delivery. Specifically, 40 mg methylprednisolone was injected intravenously, together with 25 mg promethazine via intramuscular injection. The initial infusion rate was fixed at 50 mg per hour for the first administration. If no untoward symptoms occurred, the flow rate would be increased by 50 mg/h every 30 min, with the upper limit strictly limited to 400 mg/h throughout the process. Throughout the treatment period, angiotensin-converting enzyme inhibitors or angiotensin receptor blockers were routinely prescribed to stabilize blood pressure and reduce urinary protein (Upro) excretion, and their therapeutic doses were kept unchanged throughout the period22. Because all enrolled patients received an identical RTX regimen, the treatment regimen was not a source of between-patient heterogeneity and was not considered a potential confounder. Therefore, RTX regimen was not included as a covariate in the multivariable logistic regression or Cox proportional hazards models.
Data collection
Baseline clinical data were gathered within one week prior to RTX initiation. Collected indicators covered age, gender, disease course, body mass index (BMI), blood pressure, 24 h UPro quantification, serum albumin (ALB), Scr, eGFR, blood lipid profiles, and concurrent medication records. Serum anti-PLA2R antibody titres were tested at baseline as well as 1, 3, and 6 months after treatment commencement. Absolute counts of peripheral blood CD19+ B-cells were detected at identical time points via flow cytometry. Early B-cell reconstitution was defined as the percentage of CD19+ B-cells among total lymphocytes exceeding the assay-defined threshold at any time within six months post-treatment. Therapeutic outcome-related parameters including 24 h UPro and serum ALB were recorded at 1, 3, 6, and 12 months after intervention. Remission status was finally judged by relevant biochemical indicators at the 12-month follow-up. Complete remission was confirmed when 24 h UPro was less than 0.3 g accompanied by serum ALB exceeding 35 g/L. Partial remission was defined as a minimum 50% reduction in UPro, with the final level below 3.5 g per 24 h. Cases failing to meet partial remission criteria were classified as non-remission, and disease relapse was defined as recurrent nephrotic-range proteinuria after achieving prior remission. All raw research data were systematically extracted from hospital electronic medical records and laboratory information systems.
Subsequent treatments after protocol-defined RTX therapy
During the 12-month follow-up period, patients who experienced disease relapse after achieving initial remission could receive additional immunosuppressive therapy at the discretion of the treating physicians. Permitted rescue regimens included a second course of RTX (1 g per infusion given twice at a 2-week interval), oral cyclophosphamide (1.5 mg/kg/day for 8-12 weeks), or CNIs (tacrolimus 2-4 mg/day with target trough levels maintained at 5-10 ng/mL). Rescue therapy was administered only in the non-remission group: 0 of 66 patients (0%) in the remission group received rescue therapy, whereas 11 of 36 patients (30.6%) in the non-remission group received rescue therapy after relapse. Among these 11 patients, 3 received a second RTX course, 5 received cyclophosphamide or CNIs, and 3 received intensified supportive care alone (including dose-adjusted ACEI/ARB and diuretics). Because this was a retrospective cohort study, administration of rescue therapy was not prospectively recorded for research purposes; it was documented in routine medical records and extracted from them for this analysis. Rescue therapy was not included as a covariate in the multivariable logistic regression or Cox proportional hazards models, and a sensitivity analysis excluding patients who received rescue therapy was not performed. This is because rescue therapy occurred exclusively in the non-remission group and was therefore structurally linked to the outcome, such that its inclusion as a covariate would have led to complete separation or collinearity, and because the small number of relapsed patients (n = 11) limited the feasibility of meaningful sensitivity or subgroup analyses. Consequently, the influence of rescue therapy on the 12-month endpoint cannot be entirely ruled out. For the primary outcome analysis, treatment response was defined as the clinical status at 12 months, regardless of whether patients received subsequent rescue interventions, consistent with the intention-to-treat principle. Formal subgroup analysis by rescue regimen was not performed due to the limited sample size of the relapse subgroup (n = 11).
Observation indicators
24 h UPro quantification
All urine samples collected within a full 24 h period were fully blended, and a 10 mL homogenized specimen was reserved for laboratory detection. The pyrogallol red-molybdate colorimetric method was adopted to measure UPro concentration, and the final 24 h total UPro value was calculated by multiplying the detected concentration by the total daily urine volume23. All measurements were completed using an automatic biochemical analyzer (see Table of Materials).
Serum ALB
A total of 3 mL of fasting venous blood was drawn from each participant, and serum samples were separated by centrifugation. Serum ALB levels were subsequently quantified via the bromocresol green assay23. All relevant biochemical analyses were performed using an automated clinical chemistry analyzer (see Table of Materials).
Scr
Three milliliters of fasting venous blood were collected and centrifuged to isolate serum. Scr levels were determined using the sarcosine oxidase method, and the eGFR was further calculated in line with the widely acknowledged CKD-EPI formula23. All laboratory tests were performed on an automatic biochemical analyzer (see Table of Materials).
Anti-PLA2R antibody titer
Five milliliters of fasting venous blood were harvested and processed to obtain serum samples. An enzyme-linked immunosorbent assay (ELISA) was used to quantitatively measure serum anti-PLA2R IgG antibody levels. The matching detection kit used was the commercial anti-PLA2R antibody ELISA kit. All specimen measurements were accomplished with the fully automated ELISA analyzer. The final test outcomes were presented in RU/mL units. The seropositivity cut-off of > 20 RU/mL was assay-defined per the instructions of the commercial ELISA kit, while readings above 200 RU/mL were categorized as high antibody titres24. By contrast, the 155 RU/mL risk threshold for predicting RTX non-remission was data-derived from the receiver operating characteristic (ROC) analysis of the present study cohort, selected to maximize the Youden index. To mitigate overfitting risk for this data-driven cut-off, the threshold was applied strictly within internal ROC and risk-stratification analyses; formal external validation in independent cohorts was prespecified as required before clinical adoption of this cut-off (see Table of Materials)
Absolute count of peripheral blood CD19+ B lymphocytes
A total of 2 mL fasting venous blood was drawn and preserved in ethylene diamine tetra-acetic acid (EDTA) anticoagulant tubes. Flow cytometry was adopted to quantify the absolute number and proportion of peripheral circulating CD19+ B-cells. The primary predictor of early B-cell reconstitution in this study was defined as the percentage of CD19+ B-cells among total lymphocytes that exceeded the assay-defined threshold at any time within six months post-treatment, and this definition was applied consistently across all study analyses. All cellular detections were finished using a flow cytometer. Applied fluorochrome-conjugated monoclonal antibodies included CD45-FITC, CD14-PE, and CD19-PC7. Gating controls included an unstained whole-blood negative control and single-stained compensation beads for spectral compensation calibration. The sequential gating strategy was as follows: total leukocytes were first gated in forward-scatter (FSC) versus side-scatter (SSC) dot plots; lymphocytes were subsequently isolated from the leukocyte population based on low FSC and low-to-intermediate SSC characteristics. B-cell populations were further identified via the phenotype of CD45+/CD14-/CD19+: CD45 positivity confirmed leukocyte origin, CD14 negativity excluded monocyte contamination, and CD19 positivity defined the B-cell lineage. Absolute cell enumeration was accomplished with Flow-Count fluorospheres. No fewer than 10 000 events within the lymphocyte gate were acquired for each specimen. This acquisition threshold was justified to minimize random sampling error and guarantee counting precision for CD19+ B-cell populations, which become rare following RTX-mediated B-cell depletion19 (see Table of Materials).
Serum lipid profiles
After 3 mL fasting venous blood was collected and centrifuged to isolate serum specimens, total cholesterol (TC) and triglyceride (TG) contents were determined by enzymatic assay25. All lipid-related biochemical measurements were conducted using a fully automatic biochemical analyzer. (see Table of Materials)
Blood pressure measurement
Systolic and diastolic blood pressure of the right upper arm was measured using a calibrated electronic sphygmomanometer (see Table of Materials). All participants were required to rest quietly for 15 minutes ahead of detection. Three consecutive measurements were performed, and the average value was adopted for final data recording.
Sample size calculation
Referring to previously published clinical evidence20, relevant investigations focusing on RTX therapy guided by anti-PLA2R antibodies for MN revealed distinct serological differences at the 12-month follow-up. Specifically, the median anti-PLA2R antibody level was 2.0 (1.0, 7.0) RU/mL in the remission cohort, whereas in the non-remission group it was 28.0 (5.0, 68.0) RU/mL. Since only median and interquartile range (IQR) data were available from the source study, mean and standard deviation for each group were estimated from quartile values using validated statistical conversion formulas; the estimated Cohen's d effect size derived from these reconstructed summary statistics was 0.78. Sample size estimation was accomplished via software (see Table of Materials). With the significance level set at α = 0.05 and statistical power fixed at 1-β = 0.85, a minimum of 31 participants were required for each group. Taking the data loss rate ranging from 10% to 15% into account, the preliminary enrollment target was set at 34 to 40 subjects per group, totaling 68 to 80 cases. In the actual research process, a total of 102 eligible patients were finally enrolled, comprising of 66 cases in the remission group and 36 cases in the non-remission group, which was sufficient to meet the statistical sample requirement. Post hoc power analysis was further conducted based on the actual enrolled population and the observed effect size. The practical Cohen's d value of antibody titer comparison was 2.548, and the corresponding statistical power was 0.99, fully satisfying rigorous statistical analytical standards.
Statistical analysis
All statistical analyses were performed using software (Table of Materials). Logistic regression models were applied to adjust for potential confounding factors. Normality was assessed via the Shapiro-Wilk test, and homogeneity of variance was verified using the Levene test. Normally distributed data with equal variance were presented as mean ± standard deviation (mean ± SD), and intergroup comparisons were carried out by independent-samples t-test. Non-normally distributed quantitative data were expressed as median (interquartile range) [M(Q1, Q3)], and the Mann-Whitney U test was adopted for between-group comparisons. Categorical variables were described as frequencies and percentages and compared using the chi-square test or Fisher's exact test as appropriate.
The primary endpoint of this study was non-remission at the fixed 12-month follow-up, defined as failure to achieve complete or partial remission at that time point. Consistent with a composite endpoint definition (non-remission or relapse), patients who achieved initial remission but subsequently relapsed before the 12-month visit were also classified as non-remission at the endpoint. Because this is a fixed-time binary outcome rather than a time-to-event outcome, the primary multivariable analysis was performed using binary logistic regression to identify independent risk factors for non-remission and to construct the combined predictive model. Cox proportional hazards regression and Kaplan-Meier/Log-rank analyses were conducted as complementary time-to-remission survival analyses, with their event and censoring rules defined separately below.
For the time-to-event Cox analysis, the event of interest was defined as non-remission (failure to achieve complete or partial remission, or relapse after initial remission) at the 12-month endpoint. The time origin was set as the date of the first RTX infusion, and the time to event was defined as the interval from baseline to the documented non-remission endpoint. Patients who achieved remission and remained in remission by the end of the 12-month follow-up, or who were lost to follow-up before reaching the endpoint, were censored at the date of their last known follow-up. Cumulative remission rates at 6 and 12 months were estimated using the Kaplan-Meier method and compared across risk subgroups using the Log-rank test.
For both the primary logistic regression and the complementary Cox proportional hazards regression, covariates were pre-selected based on clinical relevance and prior literature rather than solely on univariate P-values, in order to adequately adjust for potential confounders. The multivariable models included the following variables: age, sex, BMI, baseline 24 h UPro, serum ALB, TC, TG, SBP, DBP, eGFR, and concomitant use of angiotensin-converting enzyme inhibitor (ACEI)/angiotensin II receptor blocker (ARB) agents, diuretics, and statins, in addition to the primary exposures of interest (baseline anti-PLA2R antibody titer and early B-cell reconstitution status).
The combined predictive model was constructed using binary logistic regression, incorporating baseline anti-PLA2R antibody titer (as a continuous variable) and early B-cell reconstitution (as a binary variable) to estimate the probability of non-remission for each patient. Receiver operating characteristic (ROC) curves were plotted to evaluate the predictive efficiency of baseline anti-PLA2R antibody titer, early B-cell reconstitution, and their combination as single indicators for RTX treatment response. The area under the curve (AUC), sensitivity, specificity, and optimal cut-off values were subsequently calculated. The optimal cut-off value for baseline anti-PLA2R antibody titer (155 RU/mL) was determined as the value maximizing the Youden index (sensitivity + specificity - 1), derived from the ROC curve for predicting non-remission at the 12-month endpoint. The Hosmer-Lemeshow test was used to assess the calibration of the combined logistic model. The DeLong test was used to compare AUCs between the combined model and individual biomarkers.
Based on the two independent risk factors identified by the primary multivariable analysis-baseline anti-PLA2R antibody titer > 155 RU/mL (using the ROC-derived cut-off) and early B-cell reconstitution-all enrolled patients were categorized into three risk subgroups: the low-risk group was defined as having neither risk factor (antibody titer ≤ 155 RU/mL and absence of early B-cell reconstitution); the intermediate-risk group as having exactly one of the two risk factors; and the high-risk group as having both risk factors simultaneously. Cumulative remission rates at 6 months and 12 months were estimated using the Kaplan-Meier method, and comparisons among the three risk subgroups were performed using the Log-rank test. All statistical tests were two-tailed, and a P-value less than 0.05 was regarded as statistically significant.
Results
Baseline clinical characteristics
A total of 102 eligible participants were enrolled in the present study and stratified into the remission group (66 cases) and the non-remission group (36 cases) based on 12-month therapeutic outcomes. Baseline clinical characteristics between the two groups are summarized in Table 1. In terms of demographic profiles, no significant intergroup difference was observed in age distribution (P = 0.188). Identical gender composition was found in both cohorts, with the male proportion accounting for 66.7% and the female proportion for 33.3%, showing no statistical discrepancy (P = 1.000). For physical and biochemical parameters, comparable levels of BMI, 24-h UPro excretion, serum ALB, Scr, TC, TG, SBP, DBP, and eGFR were detected between groups. The corresponding P values were 0.716, 0.337, 0.110, 0.416, 0.560, 0.245, 0.461, 0.279, and 0.248, respectively, all without statistical significance. No obvious divergence was discovered in the application rates of angiotensin-converting enzyme inhibitors/angiotensin receptor blockers, diuretics, and statins between the two groups, with corresponding P values of 0.798, 0.581, and 0.577. Further analysis using odds ratios (ORs) and 95% confidence intervals (CIs) demonstrated that all CIs for the above baseline indicators included 1.0. Collectively, demographic features, routine biochemical indices, blood pressure status, and concomitant medication conditions were well-balanced and comparable between the two groups, indicating no statistically significant differences were observed in the measured baseline variables. Of the total cohort, 45 patients achieved complete remission and 21 patients achieved partial remission, constituting the 66 patients in the overall remission group. In total, 11 patients experienced disease relapse within the 12-month follow-up window. Among the 36 patients classified as non-remission at 12 months, these 11 (30.6%) patients experienced disease relapse after achieving initial remission (relapse was defined as recurrence of nephrotic-range proteinuria after prior remission), and the remaining 25 (69.4%) were primary non-responders who never achieved remission throughout the follow-up period. For the primary analysis of the fixed 12-month composite endpoint (non-remission or relapse), all patients with post-remission relapse were categorized as non-remission at the 12-month time-point. In the complementary time-to-remission survival analysis, only the time of first documented clinical remission was counted as the event; subsequent relapse was neither defined as a new event nor used for censoring. Rescue subsequent immunosuppressive or supportive treatments could be administered to relapsed patients after the protocol-specified RTX course, including a second RTX course, oral cyclophosphamide, CNIs, or optimized supportive care. Primary outcome assessment at 12-month follow-up was performed according to the intention-to-treat principle regardless of these subsequent rescue interventions. Given the limited sample size of relapsed patients (n = 11), formal subgroup analyses stratified by type of subsequent rescue therapy were not performed. All relapsed cases were included in the non-remission group for the 12-month outcome analysis, in accordance with the composite endpoint definition.
Table 1: Baseline clinical data. Comparison of baseline clinical parameters between remission and non-remission groups. All baseline indicators showed no significant between-group differences.
Abbreviations: OR: odds ratio; 95% CI: 95% confidence interval; SD: standard deviation; BMI: body mass index; 24-h UPro: 24-h urinary protein; ALB: albumin; Scr: serum creatinine; TC: total cholesterol; TG: triglyceride; SBP: systolic blood pressure; DBP: diastolic blood pressure; eGFR: estimated glomerular filtration rate; ACEI: angiotensin converting enzyme inhibitor; ARB: angiotensin II receptor blocker. Please click here to download this Table.
Changes in anti-PLA2R antibody titers
The dynamic trends of anti-PLA2R antibody levels at baseline, 1 month, 3 months and 6 months after treatment are illustrated in Figure 2. A repeated-measures analysis of variance (ANOVA) was applied to longitudinal anti-PLA2R titer data, with group (remission vs. non-remission) as the between-subjects factor and time (baseline, 1-, 3-, 6-month) as the within-subjects factor; the group-by-time interaction term was tested to evaluate divergent temporal changes between groups. At pretreatment baseline, the mean anti-PLA2R antibody titer in the remission group was 117.82 ± 52.30 RU/mL, which was markedly lower than 312.33 ± 107.59 RU/mL in the non-remission group (between-group P < 0.001). Along with RTX administration, antibody titres declined in both groups. Patients in the remission group exhibited a rapid serological reduction, with values decreasing to 57.56 ± 29.51 RU/mL at 1 month, 16.06 ± 8.83 RU/mL at 3 months, and 7.21 ± 3.88 RU/mL at 6 months post-treatment. In comparison, the non-remission group maintained persistently high antibody levels throughout the follow-up period: 266.47 ± 93.45 RU/mL at 1 month, 228.06 ± 80.63 RU/mL at 3 months, and 198.19 ± 69.55 RU/mL at 6 months. Overall, a significant group-by-time interaction was observed (P < 0.001), indicating divergent temporal trajectories of anti-PLA2R titres between groups. Anti-PLA2R titres in the remission group decreased continuously and significantly after intervention (all within-group P < 0.001), whereas the declining magnitude was obviously weaker in the non-remission cohort (all within-group P < 0.001). These findings indicate that dynamic alterations in anti-PLA2R antibody levels are closely correlated with disease remission status.
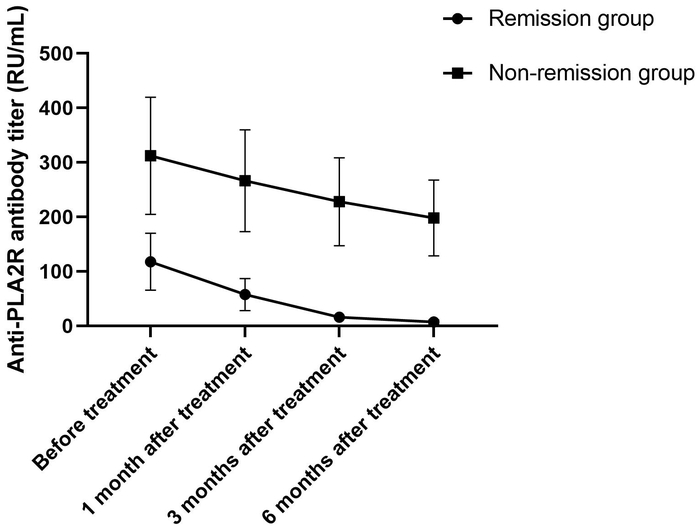
Figure 2: Changes in anti-PLA2R antibody titer. Circles, remission group; squares, non-remission group. Error bars represent SDs. Anti-PLA2R antibody titers decreased more significantly in the remission group over time compared with the non-remission group. Abbreviations: PLA2R: phospholipase A2 receptor; SD: standard deviation. Please click here to view a larger version of this figure.
Incidence of early B-cell reconstitution
The intergroup comparison of the incidence of early B-cell reconstitution is presented in Table 2. Only 11 patients in the remission group developed early B-cell reconstitution, with an incidence of 16.7%. By contrast, this phenomenon was observed in 19 cases within the non-remission group, with a relatively high incidence of 52.8%. There existed a highly significant statistical difference between the two groups (P < 0.001), with the chi-square value of 14.631 and a Phi coefficient of 0.379. These results revealed that early B-cell reconstitution was closely linked to an unsatisfactory therapeutic response, implying that patients with early B-cell reconstitution were more likely to fail to achieve clinical remission.
Table 2: Comparison of the incidence of early B-cell reconstitution [n (%)]. Early B-cell reconstitution was defined as the percentage of CD19+ B-cells among total lymphocytes exceeding the assay-defined threshold within 6 months after treatment. Comparison of early B-cell reconstitution rates between the two groups. The incidence was significantly higher in the non-remission group. Please click here to download this Table.
Independent risk factors for non-remission after RTX therapy via multivariate cox regression
Multivariate Cox proportional hazards regression analysis was performed to identify independent risk factors for treatment non-remission (Table 3). In this Cox model, the event was defined as non-remission at the 12-month endpoint; therefore, a hazard ratio (HR) > 1 indicates a higher risk of non-remission (treatment failure). After adjusting for confounding variables including age, gender, BMI, baseline 24 h UPro, serum ALB, blood lipid profiles, blood pressure, eGFR and concurrent medications such as ACEI/ARB agents, diuretics and statins, the analytical outcomes were obtained as follows.
Elevated baseline anti-PLA2R antibody titer was confirmed as an independent risk factor for treatment failure (B = 0.013, P < 0.001), with a hazard ratio (HR) of 1.013 and 95% CI ranging from 1.008 to 1.018. Likewise, early B-cell reconstitution also served as an independent adverse prognostic indicator (B = 1.149, P = 0.040), with HR = 3.154 and 95% CI: 1.053-9.450. No statistical significance was detected for other enrolled covariates in multivariate regression analyses (all P > 0.05), suggesting that these routine baseline indicators could not independently predict unsatisfactory RTX therapeutic effects in this patient cohort.
Table 3: Multivariate Cox regression analysis of independent risk factors for non-remission after RTX treatment. In this Cox model, the event of interest was non-remission at the 12-month endpoint; therefore, HR > 1 indicates a higher risk of non-remission (treatment failure). Multivariate Cox regression identifying independent risk factors for RTX non-remission. Elevated anti-PLA2R titer and early B-cell reconstitution were independent adverse predictors. Abbreviations: HR: hazard ratio; PLA2R: phospholipase A2 receptor. Please click here to download this Table.
ROC curve analysis for predictive efficacy of RTX therapeutic response
ROC curves were applied to assess the predictive performance of baseline anti-PLA2R antibody titer, early B-cell reconstitution and their combined predictive model for RTX treatment response (Figure 3, Table 4). Using 155 RU/mL as the optimal cut-off value, the baseline anti-PLA2R antibody titer yielded a sensitivity of 88.9% and specificity of 50.0% for predicting treatment non-remission, with an AUC of 0.756 (95% CI: 0.663-0.849). The AUC value of early B-cell reconstitution was 0.681 (95% CI: 0.567-0.794), with corresponding sensitivity of 52.8% and specificity of 83.3%. Notably, the combined prediction model based on the two indicators achieved an elevated AUC of 0.854 (95% CI: 0.784-0.924). The DeLong test verified that its predictive ability was statistically superior to either single biomarker (P = 0.001, P = 0.005). The combined model retained high sensitivity at 88.9% and increased specificity to 68.2%. Moreover, the Hosmer-Lemeshow test confirmed favorable model calibration (P = 0.926). Collectively, the integrated model showed stronger discriminative capacity for forecasting RTX clinical efficacy within this internally validated cohort.
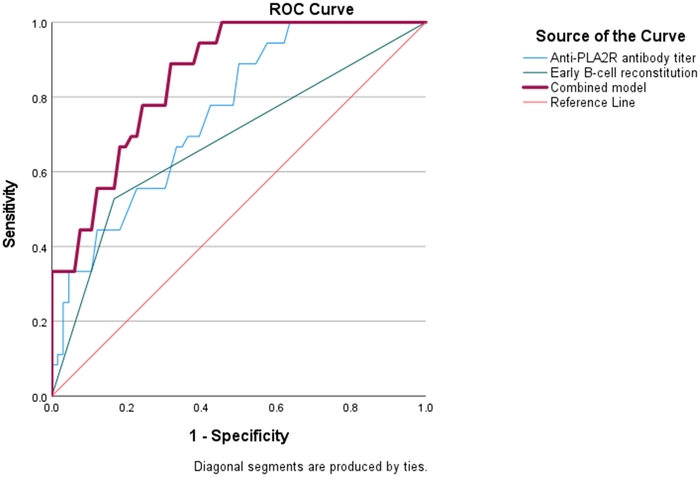
Figure 3: ROC curve analysis for predicting the efficacy of RTX treatment. ROC curves of anti-PLA2R antibody titer, early B-cell reconstitution, and the combined model for predicting treatment response to RTX. The diagonal red line represents the reference line. Abbreviations: ROC: receiver operating characteristic; PLA2R: phospholipase A2 receptor; RTX: rituximab. Please click here to view a larger version of this figure.
Table 4: Diagnostic performance of the ROC curve analysis for predicting RTX non-remission. The combined model achieved a higher AUC than either single indicator. DeLong P values indicate comparisons between the combined model and each single indicator. Abbreviations: ROC: receiver operating characteristic; AUC: area under the curve. Please click here to download this Table.
Comparison of cumulative remission rates at 6 months and 12 Months
Based on the two independent risk factors (baseline anti-PLA2R antibody titer > 155 RU/mL and early B-cell reconstitution), patients were stratified into low-risk (n = 40), intermediate-risk (n = 42), and high-risk (n = 20) subgroups. Kaplan-Meier-estimated cumulative remission probabilities differed markedly across risk strata (Table 5). At 6 months, the cumulative remission probability was 72.5% (95 %CI, 57.2-83.9%) in the low-risk group, 40.5% (95% CI, 27.0-55.5%) in the intermediate-risk group, and 15.0% (95% CI, 5.2-36.0%) in the high-risk group. At 12 months, the corresponding cumulative remission probabilities were 90.0% (95% CI, 76.9-96.0%), 64.3% (95% CI, 49.2-77.0%), and 30.0% (95% CI, 14.5-51.9%). Log-rank testing revealed statistically significant between-group differences in remission trajectories at both 6 months (X2 = 22.35, P < 0.001) and 12 months (X2 = 28.64, P < 0.001).
Table 5: Comparison of 6-month and 12-month cumulative remission rates. Log-rank test comparison of cumulative remission rates at 6 and 12 months across three risk subgroups. Cumulative remission rates declined significantly with higher risk stratification. Abbreviations: KM: Kaplan-Meier. Please click here to download this Table.
Taken together, in this cohort of 102 PLA2R-associated MN patients receiving RTX, baseline anti-PLA2R antibody titer and early B-cell reconstitution were identified as two independent predictors for 12-month non-remission after adjustment for baseline clinical covariates. The combined predictive model incorporating these two biomarkers yielded higher discriminatory performance than either biomarker alone. Baseline 24 h UPro, serum ALB, and eGFR showed no independent prognostic value after adjusting for the two core biomarkers. The three-level risk-stratification scheme, based on anti-PLA2R titer and early B-cell reconstitution, produced statistically significant differences in observed 6-month and 12-month cumulative remission rates across risk subgroups. All above-mentioned findings are based solely on internal cohort analyses.
DATA AVAILABILITY:
Supplementary File 1: Individual participant data on clinical characteristics and longitudinal anti-PLA2R antibody titers stratified by remission status. This table presents the complete raw dataset for all 102 enrolled patients, grouped by remission status (remission group, n = 66; non-remission group, n = 36). Columns include baseline demographic and clinical characteristics (age, gender, BMI, 24-h UPro, serum ALB, Scr, eGFR, TC, TG, SBP, DBP), concurrent medication use (ACEI/ARB, diuretics, statins), anti-PLA2R antibody titers measured at four time points (baseline and 1, 3, and 6 months after treatment), early B-cell reconstitution status (defined as the percentage of CD19+ B-cells among total lymphocytes exceeding the assay-defined threshold within 6 months after treatment), and remission type (complete remission, partial remission, relapse after initial remission, or primary non-responder). These individual-level data underpin the group-level analyses of antibody dynamics, the risk-stratification model, and the remission analyses reported in the main manuscript.
Abbreviations: BMI: body mass index; 24-h UPro: 24-h urinary protein; ALB: albumin; Scr: serum creatinine; TC: total cholesterol; TG: triglyceride; SBP: systolic blood pressure; DBP: diastolic blood pressure; eGFR: estimated glomerular filtration rate; PLA2R: phospholipase A2 receptor; RTX: rituximab; ACEI: angiotensin-converting-enzyme inhibitor; ARB: angiotensin II receptor blocker. Please click here to download this file.
Discussion
This retrospective single-center cohort study enrolled 102 patients with PLA2R-associated MN who received RTX and assessed whether baseline anti-PLA2R antibody titer, combined with early B-cell reconstitution, predicted 12-month remission. In this cohort, patients who failed to achieve remission presented higher baseline anti-PLA2R levels and a higher incidence of early B-cell reconstitution. Internal ROC analysis showed that the combined model achieved an AUC of 0.854 (95% CI: 0.784-0.924), outperforming single indicator. Multivariate Cox regression identified anti-PLA2R titer > 155 RU/mL and early B-cell reconstitution as independent factors associated with a higher risk of non-remission. The three-tier risk model yielded 12-month cumulative remission rates of 90.0%, 64.3%, and 30.0% in low-, intermediate-, and high-risk groups, respectively. However, because this was a retrospective, single-center study with internal validation only, these results should be interpreted as hypothesis-generating rather than as evidence that the model is ready for clinical use.
MN is an autoimmune glomerulopathy predominantly driven by pathogenic autoantibodies. More than 70% of affected patients present with elevated anti-PLA2R antibodies, which bind to podocyte surface antigens, activate complement, and induce glomerular basement membrane damage, ultimately leading to nephrotic syndrome26. RTX, a monoclonal antibody targeting CD20+ B lymphocytes, depletes peripheral B-cells and reduces pathogenic autoantibody synthesis27. In the present cohort, higher baseline anti-PLA2R titres correlated with increased treatment failure risk. This observation is consistent with the view that elevated antibody levels reflect intense systemic autoimmune activation; in such patients, a single RTX course may be insufficient to sustainably suppress autoantibody production28. Similarly, early B-cell reconstitution was associated with poor response, likely because residual memory B-cells and plasma cell precursors in lymphoid tissues can repopulate and resume pathogenic autoantibody secretion, counteracting RTX efficacy29,30. However, these mechanistic interpretations are inferred from a single-center retrospective cohort and require confirmation in independent populations.
The combined model’s better performance may reflect complementary information: baseline anti-PLA2R titer reflects the pre-treatment autoimmune burden, while early B-cell reconstitution captures the post-treatment pharmacodynamic response and immune recovery capacity. Their integration may provide a more comprehensive assessment of systemic immune disturbance and improve predictive accuracy31. Risk stratification outcomes further support this synergy, as patients with both risk factors had significantly lower remission rates than those with one or none. These results are broadly consistent with the MENTOR trial post-hoc analysis20, which identified baseline anti-PLA2R titer as a predictor of non-response, although the optimal cut-off value differed (155 RU/mL vs. 323 RU/mL), possibly due to differences in patient characteristics and assay methods. Another study18 linked early reconstitution of B-cell subsets to relapse, aligning with the present observation, though that study focused on relapse rather than initial response. A Chinese multi-center cohort32 emphasized dynamic B-cell and antibody monitoring during follow-up, whereas the present study concentrated on pre-treatment stratification based on baseline and early biomarkers. However, the present model was derived and evaluated only in this single-center cohort; its apparent superiority and risk strata require external validation before clinical application.
Several limitations directly affect the interpretation of the predictive model. First, the retrospective single-center design and 102-patient sample introduce selection and information biases, and exclusion of non-PLA2R-associated MN subtypes limits generalizability; the AUC of 0.854 may therefore be overestimated and should not be assumed to transfer to external cohorts. Second, the 12-month follow-up restricts assessment to this endpoint and does not establish the model’s value for sustained remission or late relapse20. Third, the analysis used total CD19+ B-cell recovery without assessing B-cell subsets or serum RTX concentrations, thereby limiting mechanistic depth and preventing exclusion of confounding due to suboptimal drug exposure. Fourth, proteinuria, serum ALB, and eGFR were adjusted for in multivariate Cox regression but did not show independent significance, so they were not included in the stratification model; formal sensitivity analyses were not performed to avoid overfitting. Thus, the model’s robustness applies only to this internal dataset and to the two selected biomarkers, and its predictive capacity beyond them remains unverified.
In conclusion, in this retrospective single-center cohort, baseline anti-PLA2R antibody titer and early B-cell reconstitution were independently associated with 12-month non-remission after RTX, and their combination showed promising discriminatory performance in internal evaluation. However, given the retrospective single-center design, short follow-up, limited biomarker panel, and lack of broader external validation, these findings are preliminary and hypothesis-generating. The proposed model requires prospective multicenter validation before any clinical translation.
Disclosures
The authors declare that they have no financial conflicts of interest. The manuscript has neither been previously published nor is under consideration by any other journal. No generative-AI or AI-assisted tools were utilized in manuscript drafting, language editing, figure preparation, or data analysis for this work.
Materials
| Name | Company | Catalog Number | Comments |
|---|---|---|---|
| automatic biochemical analyzer | Mindray Bio-Medical Electronics Co., Ltd. | BS-2800M | Instruments |
| automatic clinical chemistry analyzer | Roche Diagnostics GmbH | Cobas c 702 | Instruments |
| calibrated electronic sphygmomanometer | Omron Healthcare Co., Ltd. | HBP-9020 | Instruments |
| CD19-PC7 | Beckman Coulter | A82959 | kit; clone: J3-119 (CD19-PC7) |
| CD45-FITC/CD14-PE | Beckman Coulter, Inc. | B23591 | kit; clones: J33 (CD45-FITC), RMO52 (CD14-PE) |
| commercial anti-PLA2R antibody ELISA kit | EUROIMMUN Medizinische Labordiagnostika AG | E20240301 | ELISA kit |
| Flow-Count fluorospheres | Beckman Coulter, Inc. | 7547053 | Reagents |
| flow cytometer | Beckman Coulter, Inc. | Navios | Instruments |
| fully automated ELISA analyzer | EUROIMMUN Medizinische Labordiagnostika AG | EUROLineMaster Plus | Instruments |
| G*Power | Heinrich - Heine - Universität Düsseldorf | 3.1.9.7 | sample size calculation |
| methylprednisolone | Pfizer Manufacturing Belgium N | H20234156 | drug |
| promethazine | Shanghai Hefeng Pharmaceutical Co., Ltd. | H32024123 | drug |
| rituximab | Shanghai Roche Pharmaceuticals Co., Ltd. | S20230087 | drug |
| SPSS software | IBM | SPSS 27.0 | statistical analysis |
| VersaComp Antibody Capture Beads Kit | Beckman Coulter, Inc. | B28407 | Reagents (single-stain compensation control) |
References
- Dantas M et al. Membranous nephropathy. J Bras Nefrol. 2023;45(2):229-243.
- Bharati J, Waguespack DR, Beck LH Jr. Membranous nephropathy: updates on management. Adv Kidney Dis Health. 2024;31(4):299-308.
- Radhakrishnan Y, Zand L, Sethi S, Fervenza FC. Membranous nephropathy treatment standard. Nephrol Dial Transplant. 2024;39(3):403-413.
- Caravaca-Fontan F, Yandian F, Fervenza FC. Updated diagnostic and therapeutic management for membranous nephropathy. Curr Opin Nephrol Hypertens. 2025;34(1):23-32.
- Ronco P et al. Membranous nephropathy. Nat Rev Dis Primers. 2021;7(1):69.
- Rojas-Rivera JE, Ortiz A, Fervenza FC. Novel treatments paradigms: membranous nephropathy. Kidney Int Rep. 2023;8(3):419-431.
- Sethi S, Fervenza FC. Antigens in membranous nephropathy: discovery and clinical implications. Nat Rev Nephrol. 2025;21(10):653-670.
- Hoxha E, Reinhard L, Stahl RAK. Membranous nephropathy: new pathogenic mechanisms and their clinical implications. Nat Rev Nephrol. 2022;18(7):466-478.
- Tomas NM, Huber TB, Hoxha E. Perspectives in membranous nephropathy. Cell Tissue Res. 2021;385(2):405-422.
- Claudio P. Primary membranous nephropathy: an endless story. J Nephrol. 2023;36(2):563-574.
- Teisseyre M et al. Advances in the management of primary membranous nephropathy and rituximab-refractory membranous nephropathy. Front Immunol. 2022;13:859419.
- Rovin BH et al. Kidney Disease: Improving Global Outcomes (KDIGO) Glomerular Diseases Work Group. KDIGO 2021 clinical practice guideline for the management of glomerular diseases. Kidney Int. 2021;100(4S):S1-S276.
- Hu X et al. Comparison of obinutuzumab and rituximab for treating primary membranous nephropathy. Clin J Am Soc Nephrol. 2024;19(12):1594-1602.
- Chen Z et al. The role of obinutuzumab in rituximab-refractory membranous nephropathy and minimal change disease. Clin Kidney J. 2025;18(3):sfaf039.
- McDonnell T, Wu HHL, Sinha S, Chinnadurai R. The role of PLA2R in primary membranous nephropathy: do we still need a kidney biopsy? Genes (Basel). 2023;14(7):1343.
- Ragy O et al. PLA2R autoantibodies, a multifaceted biomarker in nephrotic syndrome and membranous nephropathy. Nephrol Dial Transplant. 2025;40(8):1458-1469.
- So BY, Yap DY, Chan TM. B cells in primary membranous nephropathy: escape from immune tolerance and implications for patient management. Int J Mol Sci. 2021;22(24):13560.
- Cheddadi Y et al. Early-stage B cells predict relapse after rituximab treatment in patients with membranous nephropathy. Kidney Int Rep. 2026;11(5):106365.
- Yang R et al. Delayed but durable remission to rituximab in PLA2R-associated membranous nephropathy despite B-cell reconstitution: a case report. BMC Nephrol. 2026;27(1):270.
- Barbour SJ et al. Anti-PLA2R antibody levels and clinical risk factors for treatment nonresponse in membranous nephropathy. Clin J Am Soc Nephrol. 2023;18(10):1283-1293.
- Xu M et al. Obinutuzumab versus rituximab for the treatment of refractory primary membranous nephropathy. Nephrol Dial Transplant. 2025;40(5):978-986.
- Kadatz M et al. Rituximab or cyclosporine A for the treatment of membranous nephropathy: economic evaluation of the MENTOR trial. Nephrol Dial Transplant. 2024;39(12):2058-2066.
- Cai N et al. Rituximab, tacrolimus, cyclophosphamide and cyclosporin in primary membranous nephropathy with nephrotic syndrome: comparison of safety profiles, effect on remission rate, 24-h urinary total protein, serum albumin, and serum creatinine levels using network meta-analysis. Int Urol Nephrol. 2025;57(11):3733-3750.
- Luo J et al. Seropositive PLA2R-associated membranous nephropathy but biopsy-negative PLA2R staining. Nephrol Dial Transplant. 2021;36(12):2216-2223.
- Lu Z, Liu C, Wu Q, Deng Y. High-coverage targeted lipidomics could reveal lipid alterations and evaluate therapeutic efficacy of membranous nephropathy. Nutr Metab (Lond). 2022;19(1):68.
- Zhang Y, Zhou Y, Guan H, Yu M. Exploring PLA2R and HLA in membranous nephropathy: a narrative review of pathogenic mechanisms and emerging therapeutic potentials. Int J Biol Macromol. 2024;280(Pt 1):136200.
- Ou JY et al. Evaluation of efficacy of rituximab for membranous nephropathy: a systematic review and meta-analysis of 11 studies. Nephrol Ther. 2022;18(2):104-112.
- Islam S et al. Rituximab for the treatment of primary membranous nephropathy. Can J Health Technol. 2022;2(4).
- Buse M et al. Newer B-cell and plasma-cell targeted treatments for rituximab-resistant patients with membranous nephropathy. Clin Kidney J. 2025;18(5):sfaf088.
- Yu Y, Xu R, Li Z, Wan Q. Different dosage regimens of rituximab in primary membranous nephropathy treatment: a systematic review. Int J Nephrol Renovasc Dis. 2024;17:265-273.
- You L et al. Rituximab for the treatment of idiopathic membranous nephropathy with nephrotic syndrome: a systematic review and meta-analysis. Turk J Med Sci. 2021;51(6):2870-2880.
- Gao S et al. Rituximab therapy for primary membranous nephropathy in a Chinese cohort. Front Med (Lausanne). 2021;8:663680.