This protocol describes SecureHealthKey+, a lightweight Wireless Body Area Network authentication framework integrating cryptographic mutual authentication, TinyML-based behavioral anomaly detection, and SHapley Additive exPlanations–based explainability. The IEEE 802.15.6-inspired workflow emulates the narrowband physical layer using an IEEE 802.11 (Wi-Fi)/MQTT link without IEEE 802.15.6 radio hardware.
Research Article
SecureHealthKey+: Integrating Explainable TinyML Anomaly Detection Into Lightweight Authentication Protocols in IoT-Enabled Healthcare Systems
In This Article
Summary
Abstract
The Internet of Medical Things (IoMT) and Wireless Body Area Networks (WBANs) enable real-time, remote, and continuous patient monitoring but remain vulnerable to cyber-physical attacks, including unauthorized device access, replay, man-in-the-middle (MITM), and slow-rate denial-of-service (DoS) attacks. Existing lightweight authentication protocols are computationally suitable for resource-constrained wearable sensors but may not detect behavioral anomalies occurring during otherwise valid cryptographic handshakes. This study presents SecureHealthKey+, a hybrid security framework that extends the lightweight mutual authentication mechanism of the SecureAuthKey scheme by integrating an Explainable Tiny Machine Learning-based Anomaly Detection (ETAD) layer within an Institute of Electrical and Electronics Engineers (IEEE) 802.15.6-inspired WBAN architecture. The framework uses a microcontroller-based Smart Medical Device (SMD) and a single-board-computer-based Medical Gateway Server (MGS). The SMD computes a cryptographic authentication token using a pre-shared body-sensor key, fresh nonce, and device identifier while extracting a five-dimensional Health Feature Metadata (HFM) vector comprising timestamp deviation (HFM1), sensor-identity novelty (HFM2), packet rate (HFM3), physiological signal drift index (HFM4), and inter-frame gap variance (HFM5). At the MGS, an 8-bit integer (INT8)-quantized Tiny Machine Learning (TinyML) autoencoder processes the HFM vector to generate a Health Anomaly Decision (HAD), cryptographically bound to the session key (SK) through SK_H = H(SK ∥ HAD). A SHapley Additive exPlanations (SHAP) layer provides feature-level attribution for anomalous sessions. Evaluation used 12,000 benign authentication traces and 4,800 synthetic attack traces generated on a single-device benchtop testbed. The framework achieved a weighted true-positive rate of 97.4% across four synthetic attack types. An IEEE 802.11 wireless link using the Message Queuing Telemetry Transport (MQTT) protocol emulated the WBAN gateway tier; dedicated IEEE 802.15.6 radio hardware was not used. Therefore, the results represent a proof-of-concept rather than validation of real-world, multi-patient WBAN efficacy.
Introduction
Wireless Body Area Networks (WBANs) have emerged as a cornerstone of modern digital healthcare through the integration of miniaturized biosensors, low-power wireless communication, and cloud-based electronic health record (EHR) systems1. A WBAN comprises sensor nodes, including electrocardiogram (ECG) patches, pulse oximetry (SpO₂) sensors, continuous glucose monitors (CGMs), blood pressure cuffs, and inertial measurement units (IMUs), placed on or around a patient’s body and communicating with a personal gateway device using short-range radio protocols. The gateway collects, preprocesses, and securely transmits patient information to hospital servers and cloud-based health platforms for clinical analysis, telehealth consultation, and automated alerts2. The global Internet of Medical Things (IoMT) market is expected to reach USD 187.60 billion by 2028, with remote patient monitoring (RPM) based on WBANs representing a major contributor3.
Medical sensor nodes are highly resource constrained, typically operating on coin-cell batteries with 256–512 KB of flash memory, 32–64 KB of static random-access memory (SRAM), and processing clocks ranging from 8–80 MHz, limiting the use of conventional Transport Layer Security/Secure Sockets Layer (TLS/SSL) stacks or Rivest-Shamir-Adleman/elliptic curve cryptography (RSA/ECC). Physiological data transmitted by WBANs are highly sensitive4. Unauthorized access may raise concerns under the Health Insurance Portability and Accountability Act (HIPAA)5, while adversarial falsification of insulin-pump control data may pose serious patient-safety risks6. Attacks against WBANs include passive eavesdropping, replay attacks, and man-in-the-middle (MITM) attacks. Passive eavesdropping of unencrypted physiological streams can expose sensitive patient information, whereas replay attacks retransmit captured authentication messages and MITM attacks intercept or modify transmitted data. Conventional cryptographic authentication protocols7,8 may not detect protocol-compliant behavioral attacks in which cryptographic checks are satisfied while behavioral characteristics, such as timing, packet rate, or sensor identity, deviate from expected patterns9.
Existing Burrows-Abadi-Needham (BAN)-logic-verified lightweight authentication protocols10,11 and the original SecureAuthKey scheme12, which computes ATA = H(GI ∥ AK ∥ S) and derives SK = H(GI ∥ ATA ∥ S ∥ R), are computationally lightweight and provide nonce freshness but remain focused on cryptographic verification. Consequently, an adversary that crafts messages satisfying cryptographic checks while exhibiting anomalous behavioral characteristics, such as excessive authentication attempts or media access control (MAC) address rotation, may not be detected by conventional lightweight WBAN authentication alone.
Deploying quantized machine learning (ML) models on microcontroller-class hardware offers a practical approach to addressing this limitation. However, two challenges limit the direct adoption of standalone Tiny Machine Learning (TinyML) intrusion detection system (IDS) approaches in healthcare. First, standalone detectors can produce anomaly decisions independently of the cryptographic authentication process. Second, healthcare regulatory and cybersecurity frameworks increasingly emphasize transparency, traceability, and risk management for artificial intelligence (AI)-enabled medical technologies13. A black-box TinyML classifier that quarantines a medical device without interpretable justification may therefore present clinical and operational challenges10,11. SecureHealthKey+ addresses these challenges by cryptographically binding the Health Anomaly Decision (HAD) to the session key (SK), SK_H = H(SK ∥ HAD), and incorporating a SHapley Additive exPlanations (SHAP) layer that generates feature-level attribution scores for anomaly decisions.
The proposed framework integrates Explainable TinyML-based Anomaly Detection (ETAD) into lightweight WBAN session-key derivation by producing SK_H = H(SK ∥ HAD), thereby cryptographically binding the health anomaly decision to the session key. It also introduces a five-dimensional Health Feature Metadata (HFM) vector, HFM = [timestamp_δ, sensor_ID_novelty, pkt_rate, physio_drift_index, IFG_variance], to capture network-layer and physiological behavioral characteristics in WBAN environments. The framework further incorporates a post-inference SHAP layer that provides per-session feature-attribution scores to support transparency and security audit trails. Experimental evaluation using an ESP32 microcontroller (microcontroller), MAX30105 pulse oximetry and heart rate sensor (optical biosensor), and DS18B20 temperature sensor (digital temperature sensor)-based WBAN testbed demonstrated a TinyML inference latency of 0.31 ms, a 7.2 KB model footprint, a 38 ms authentication handshake, and a weighted true-positive rate (TPR) of 97.4% across four synthetic attack types. The framework also presents an informal, BAN-logic-inspired security discussion of session-key binding, nonce freshness, and resistance to replay and MITM attacks.
The Institute of Electrical and Electronics Engineers (IEEE) 802.15.6-2012 standard defines physical (PHY) and medium access control (MAC) specifications for WBANs14, supporting narrowband (NB), ultra-wideband (UWB), and human body communication (HBC). A typical healthcare WBAN comprises three tiers: Tier 1 consists of on-body Smart Medical Device (SMD) biosensor nodes; Tier 2 consists of the Medical Gateway Server (MGS), which executes SecureHealthKey+, ETAD, and SHAP; and Tier 3 comprises the hospital cloud and EHR backend. The Tier 1–Tier 2 communication link represents the primary attack surface.
TinyML involves training ML models in a resource-rich environment15 and deploying 8-bit integer (INT8) or 4-bit integer (INT4) quantized versions on microcontroller-class hardware16 using the TensorFlow Lite for Microcontrollers runtime (microcontroller machine-learning inference runtime)15,16,17. SHAP decomposes a model prediction into additive feature contributions based on game-theoretic Shapley values, expressed as f(x) = φ₀ + Σiφi, where φi represents the contribution of feature i to the prediction. In healthcare security applications, SHAP provides interpretable feature-level explanations of why a medical-device session is classified as anomalous. Such explanations may help distinguish device malfunctions from potentially malicious activity and support AI-related security audit trails.
Protocol
The proposed framework considered two ethical issues. First, a patient's device might not have reported to the primary EHR for a brief period while it was quarantined under Policy P1. Policy P1 mitigated this risk by continuing to report data to a secure logging endpoint while simultaneously sending clinical alerts. Second, the synthetic training dataset might not have fully represented the physiological diversity of patient cohorts, potentially increasing the false-positive rate (FPR) for certain groups. Proposed mitigation strategies included per-patient calibration during enrollment and continuous monitoring of model behavior using SHAP.
The experimental validation extended beyond benchtop testing to include human-subject evaluation using non-invasive WBAN devices. Institutional ethical clearance was granted by Getwell Multispeciality Hospital, Chakan, under the Ethical Approval and Patient Data Usage Certificate (Ref. No. GHM/2026/04-12; August 3, 2026). Prior written informed consent was obtained from all human participants after explaining the scope of prototype testing, data acquisition procedures, and the non-invasive nature of the WBAN devices. Physiological and sensor data collected during the study were used within the hospital premises for experimental evaluation, testing, and validation of the IoT-based WBAN prototype. All patient data were anonymized and processed in accordance with the Digital Personal Data Protection Act, 2023. The data were maintained confidentially on isolated local infrastructure and were not shared, disseminated, or made publicly accessible. The institutional ethical clearance was granted for academic research and prototype validation purposes.
SecureHealthKey+: Integrated WBAN Security and Explainability Workflow
Figure 1 illustrates the six sequential phases of the SecureHealthKey+ workflow for secure WBAN authentication and anomaly detection. In Phase 1, the testbed was assembled by connecting the SMD hardware to the MGS. In Phase 2, the testbed was used to generate benign data and synthetically produce representative attack scenarios. All data were normalized to generate standardized input vectors for the machine learning pipeline. In Phase 3, an autoencoder model was trained exclusively on benign data using a one-class learning approach. The trained model was subsequently quantized for deployment on resource-constrained edge hardware and deployed to the gateway runtime. In Phase 4, the SHAP explainability layer was initialized at the gateway to support feature-level interpretation and latency benchmarking for low-overhead deployment. In Phase 5, the complete authentication handshake was executed, during which the message sequence incorporated anomaly detection and generated feature-level explanations for anomalous sessions (HAD = 1). These explanations were transmitted to the hospital dashboard together with the corresponding security alerts, and the session was secured through cryptographic key derivation. In Phase 6, the complete system was evaluated against predefined performance metrics, including inference latency, attack detection performance, and energy overhead on the edge node.
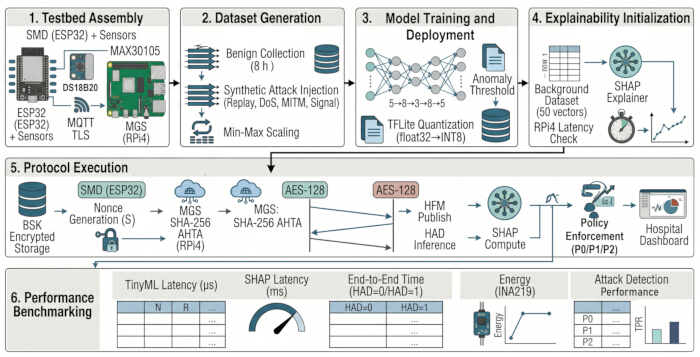
Figure 1. Overview of the SecureHealthKey+ workflow. The framework comprises six phases: testbed assembly, synthetic WBAN dataset generation, TinyML ETAD model training and deployment, SHAP explainability initialization, SecureHealthKey+ protocol execution, and performance benchmarking. The workflow integrates behavioral anomaly detection and explainability with lightweight authentication and policy enforcement. Please click here to view a larger version of this figure.
Phase 1: Testbed Hardware Assembly
The SMD was assembled by mounting the microcontroller module on a prototyping board. The optical biosensor was connected to the microcontroller through the I2C interface (SDA → GPIO 21, SCL → GPIO 22, VCC → 3.3 V) and configured for photoplethysmography (PPG) and SpO2 acquisition at a bus speed of 400 kHz. The digital temperature sensor was connected to GPIO 4 (data line) using a 4.7 kΩ pull-up resistor connected to the 3.3 V supply. The MGS was configured using a single-board computer running a 64-bit operating system. Python 3.10, the microcontroller machine-learning inference runtime (version 2.13), SHAP (version 0.42.1), and the MQTT broker were installed on the gateway system. TLS-encrypted MQTT communication was established between the microcontroller and the gateway using static IP addressing and TLS version 1.2. The MQTT topic schema was configured as /wban/{GID}/auth for SMD-to-MGS communication and /wban/{GID}/auth_response for MGS-to-SMD communication, where GID denotes the unique Global Identifier assigned to each SMD upon registration in the Enrollment Registry. The experimental hardware testbed was assembled as shown in Figure 2.
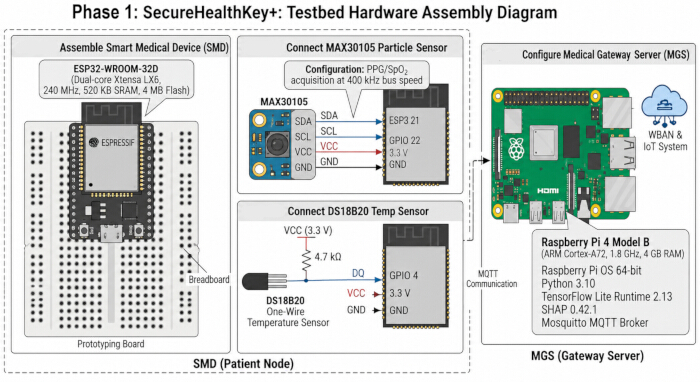
Figure 2. SecureHealthKey+ testbed hardware assembly. The Smart Medical Device (SMD) testbed comprises a microcontroller connected to an optical biosensor and a digital temperature sensor. The Medical Gateway Server (MGS) is implemented on a single-board computer and supports MQTT communication, anomaly-detection inference, and SHAP-based explainability. Please click here to view a larger version of this figure.
Phase 2: Synthetic WBAN Dataset Generation
The dataset was generated using the previously assembled WBAN testbed operated in normal patient-monitoring mode for 8 h per observation session across multiple prototype cycles, aggregating a total of 12,000 benign session traces. The HFM vector, HFM = [timestampδ, sensor_ID_novelty, pkt_rate, physio_drift_index, IFG_variance], was recorded during each 10 s authentication cycle across the reporting sensor channels. Replay attack traces were generated by retransmitting captured benign HFM vectors with timestampδ ≈ 0 ms (range, 0.00–1.10 ms) to simulate replayed packets. A total of 1,200 replay attack traces were generated and labeled as attack_type = "replay". Slow-rate DoS attack traces were generated by injecting authentication requests at 5–15 times the normal request rate using randomized inter-arrival times ranging from 667–2,000 ms, while artificially increasing HFM3 (pkt_rate) to 0.45–0.95 and HFM5 (IFG_variance) to 0.15–0.45. A total of 1,200 attack traces were generated and labeled as attack_type = "slow_dos". MITM behavioral attack traces were generated by setting HFM2 (sensor_ID_novelty) to 1 and increasing HFM5 to 0.20–0.55 to simulate rogue sensor substitution. A total of 1,200 attack traces were generated and labeled as attack_type = "mitm_behavioral". Signal injection attack traces were generated by introducing step changes in HFM4 (physio_drift_index) ranging from 0.61–0.98. A total of 1,200 attack traces were generated and labeled as attack_type = "signal_injection". The features were normalized using min-max normalization applied only to the benign training partition. The scaler parameters (minimum and maximum values for each feature) were saved as a JSON file for deployment on the MGS. Formally, each HFM feature was computed as follows. Let ti denote the arrival time of the i-th Message 1 from a given GID, and let 10,000 ms denote the nominal inter-message interval defined by the protocol (Phase 5).
The timestamp deviation was calculated as follows:

Sensor-ID novelty was defined as follows:

The packet-rate feature was calculated as follows:
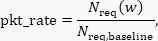
Here, Nreq(w) is the number of authentication requests received within a trailing 10 s window w, and Nreq,baseline is the mean benign request count per 10 s window computed from the training partition.
The physiological drift index was calculated as follows:

where HRi is the heart-rate reading in the current sample and HRbase is the rolling mean of the preceding k = 10 benign heart-rate samples.
The inter-frame-gap variance was calculated as follows:

where

and gj represents the inter-frame gaps within the trailing observation window of k = 20 frames.
The synthetic WBAN dataset was generated and preprocessed according to the workflow shown in Figure 3.
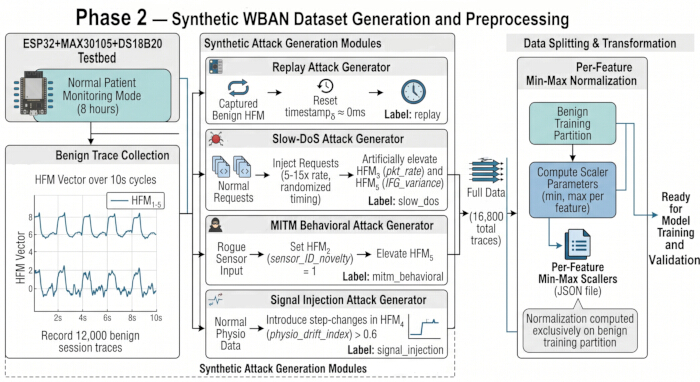
Figure 3. Synthetic WBAN dataset generation and preprocessing. Benign HFM session traces are collected during normal monitoring, followed by generation of replay, slow-rate denial-of-service (DoS), man-in-the-middle (MITM) behavioral, and signal-injection attack traces. The resulting dataset contains 16,800 traces. Per-feature min-max normalization parameters are computed exclusively from the benign training partition before model training and validation. Please click here to view a larger version of this figure.
Phase 3: TinyML ETAD Model Training and Quantization
The 12,000 benign records were divided into training (9,600 records) and validation (2,400 records) datasets using an 80:20 split. The autoencoder was defined in TensorFlow 2.13/Keras with an encoder comprising Dense(5→8, ReLU) and Dense(8→3, ReLU) layers and a decoder comprising Dense(3→8, ReLU) and Dense(8→5, Sigmoid) layers. The model was trained using the mean squared error (MSE) loss function and the Adam optimizer (learning rate = 0.001, batch size = 64) for 200 epochs.
To justify the architectural configuration, training schedule, and decision boundary, a one-factor-at-a-time (OFAT) sensitivity analysis was conducted around the baseline parameters.
Autoencoder Architecture (holding 200 epochs and the 95th-percentile threshold constant): A narrower 5→4→2→4→5 architecture underfitted the telemetry manifold (validation MSE = 0.0191, TPR = 93.8%, F1-score = 0.942), whereas an expanded 5→16→4→16→5 architecture yielded negligible detection gain (validation MSE = 0.0079, TPR = 97.6%, F1-score = 0.974) while increasing the parameter memory footprint by 2.8×. The selected 5→8→3→8→5 baseline achieved a validation MSE of 0.0081, TPR of 97.4%, and F1-score of 0.973 within the embedded TinyML resource constraints.
Training Epochs (holding the 5→8→3→8→5 architecture and 95th-percentile threshold constant): Training for 100 epochs showed incomplete convergence (validation MSE = 0.0124, TPR = 94.7%, F1-score = 0.951), whereas 150 epochs approached stabilization (validation MSE = 0.0089, TPR = 96.6%, F1-score = 0.967). The 200-epoch baseline achieved a validation MSE of 0.0081, TPR of 97.4%, and F1-score of 0.973. Increasing training to 250 epochs resulted in a plateaued loss (validation MSE = 0.0080, TPR = 97.4%, F1-score = 0.973) with additional computational overhead.
Anomaly Threshold Percentile (holding the 5→8→3→8→5 architecture and 200 epochs constant): Setting the anomaly threshold θ at the 90th percentile increased false alarms (FPR = 10.0%, TPR = 98.9%, F1-score = 0.946), whereas the 99th percentile reduced false positives at the cost of lower detection sensitivity (FPR = 1.0%, TPR = 92.1%, F1-score = 0.948). The 95th-percentile baseline yielded an FPR of 5.0% on the benign validation data while maintaining a TPR of 97.4% and an F1-score of 0.973.
The training/validation split was performed using Keras's built-in validation_split argument (validation_split = 0.2) during model.fit(). As implemented, this argument reserved the trailing 20% of the input array as the validation partition in the order in which the benign HFM vectors were passed, rather than drawing a random sample. No explicit shuffling of the full dataset was performed before this split, and no fixed random seed was set for the split itself. Consequently, the training (first 9,600 records) and validation (last 2,400 records) partitions corresponded to sequential, rather than randomly sampled, portions of the 8 h benign collection session.
The autoencoder was trained exclusively on benign traces using a one-class learning approach. The anomaly threshold θ was determined as the 95th percentile of the reconstruction MSE values obtained from the benign validation set. The framework achieved a TPR of 97.4%, an FPR of 2.1%, and an overall weighted F1-score of 0.973 across the 16,800 evaluated frames.
The per-attack results were as follows: Replay Attack achieved a TPR of 98.3%, an FPR of 1.8%, and an F1-score of 0.981, primarily driven by HFM1 (timestampδ); Slow-Rate DoS achieved a TPR of 96.7%, an FPR of 2.4%, and an F1-score of 0.971, primarily driven by HFM3 (pkt_rate); MITM Behavioral achieved a TPR of 97.1%, an FPR of 2.1%, and an F1-score of 0.975, primarily driven by HFM2 (sensor_ID_novelty); and Signal Injection achieved a TPR of 96.2%, an FPR of 2.8%, and an F1-score of 0.966, primarily driven by HFM4 (physio_drift_index).
The trained float32 Keras model was converted to an INT8 TensorFlow Lite model using the TensorFlow Lite Converter with a representative dataset consisting of 200 benign HFM vectors. These 200 representative calibration vectors were systematically sampled at uniform periodic intervals (every 48th trace) from the 9,600-record benign training partition to cover the operational dynamic range of the telemetry session without introducing out-of-distribution bias. Post-training full-integer quantization was applied, mapping all weights, biases, and activations, including the model input and output tensors, to 8-bit integers using per-tensor asymmetric quantization. The quantization scale and zero-point parameters were calibrated using the 200-vector representative dataset. This full-integer mode enabled the model to run entirely on the integer-only microcontroller machine-learning inference runtime without a floating-point fallback.
The converted model was validated across the benign validation and attack evaluation sets to confirm an accuracy degradation of <0.5% relative to the float32 model. The degradation was evaluated by calculating the absolute difference in classification F1-score between the unquantized float32 baseline and the quantized INT8 model:

This yielded an empirical decrease of 0.21%, from an unquantized F1-score of 0.975 to an INT8 F1-score of 0.973, together with a reconstruction MSE shift of ΔMSE < 0.0004. The INT8 etad_model.tflite model was then deployed to the MGS runtime, and the JSON scaler parameters were loaded during MGS start-up. The target flash-memory footprint was <10 KB, and the target SRAM usage was <5 KB. The ETAD model was trained, quantized, validated, and deployed following the workflow illustrated in Figure 4.
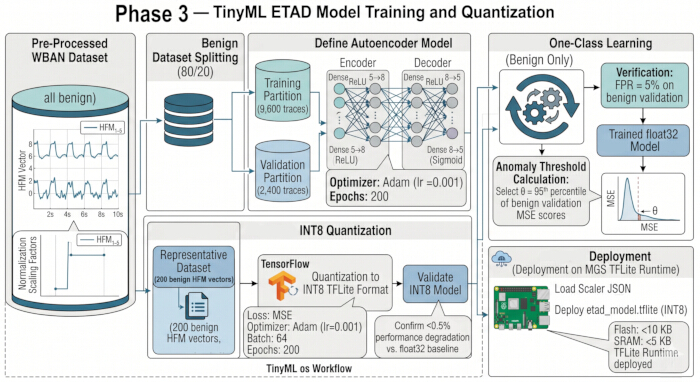
Figure 4. TinyML ETAD model training, quantization, and deployment. The benign dataset is divided into training and validation partitions for one-class autoencoder learning. The anomaly threshold is determined from the benign validation reconstruction-error distribution. The trained model is converted to INT8 format using representative benign HFM vectors and deployed on the MGS together with the normalization parameters. Please click here to view a larger version of this figure.
Phase 4: SHAP Explainability Layer Initialization
During MGS startup, a background dataset consisting of 50 representative benign HFM vectors (50 × 5 NumPy array; <2 KB RAM) was loaded directly into system memory. These 50 vectors were selected from the 2,400-record benign validation partition using a deterministic uniform periodic sampling procedure with a fixed stride of 48, with indices defined as follows:

ensuring coverage of the temporal monitoring window while preserving baseline physiological variance without stochastic sampling bias.
This 50-vector background dataset was used to initialize a SHAP KernelExplainer with the ETAD MSE scoring function. The nsamples parameter was set to 100 perturbations per explanation to balance feature-attribution fidelity and runtime efficiency. SHAP computation latency was evaluated against the real-time explainability requirement of a mean attribution latency of <5 ms per anomalous session (HAD = 1) detected by the ETAD detector. A dedicated audit log was maintained on the gateway filesystem to record inference and explanation times for each handshake. The SHAP explainability layer was initialized, calibrated, and recorded as illustrated in Figure 5.
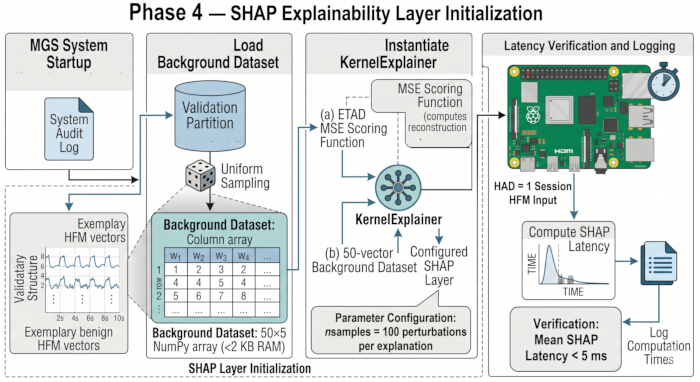
Figure 5. SHAP explainability layer initialization. A 50-vector background dataset is sampled from the benign validation partition and used to initialize the SHAP KernelExplainer with the ETAD reconstruction-error scoring function. SHAP computation latency is evaluated for anomalous (HAD = 1) sessions, and computation times are recorded for performance verification. Please click here to view a larger version of this figure.
Phase 5: SecureHealthKey+ Protocol Execution
At the start of each authentication session, the SMD loaded the Base Secret Key (BSK) from encrypted non-volatile storage. The optical biosensor was initialized using a 400 kHz I2C interface, and a TLS-protected MQTT connection was established with the MGS. Every 10 s, the SMD generated Message 1 by first creating a 128-bit nonce S using the hardware true random number generator. The authentication hash token (AHTA) was computed as follows:

and the secure handshake token (SHTA) was generated as follows:

The HFM vector, HFM = [timestampδ, sensor_ID_novelty, pkt_rate, physio_drift_index, IFG_variance], was extracted and transmitted together with SHTA and AHTA as a JSON payload to the MQTT topic /wban/{GID}/auth.
Formally, using standard message-sequence notation, the handshake is expressed as follows:


and


The MGS accepts the session only if AHTA verification succeeds and rejects it otherwise. The session key SK and protected session key SKH are then derived independently at both endpoints as follows:

And

respectively. A mismatch in HAD between the two derivations yields non-matching session keys and an implicit session abort. This message-sequence summary complements the protocol flowchart in Figure 6.
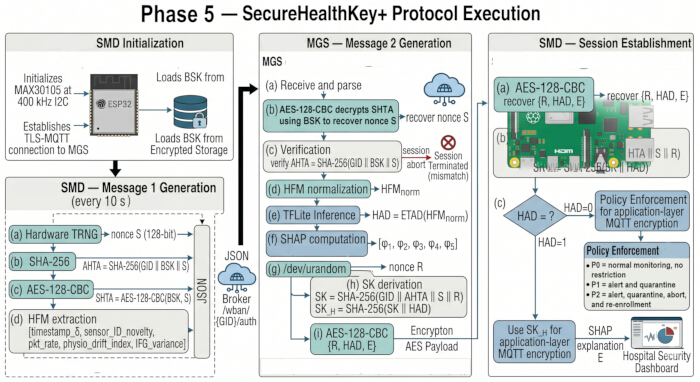
Figure 6. SecureHealthKey+ protocol execution. The SMD initializes the sensing and communication components, loads the body-sensor key (BSK), generates nonce S, constructs the authentication tokens, extracts the HFM vector, and transmits Message 1 to the MGS. Following authentication and HFM normalization, the MGS performs ETAD inference, computes SHAP explanations for anomalous sessions, generates nonce R, derives the session keys, and returns Message 2. The SMD verifies the response and applies the corresponding P0, P1, or P2 policy. Please click here to view a larger version of this figure.
The 128-bit nonce S, generated fresh for each session using the microcontroller's hardware true random number generator, was also used as the initialization vector for AES-128-CBC encryption of S itself (SHTA) and, at the MGS, for AES-128-CBC encryption of the response payload. Upon receipt of Message 1, the MGS parsed the received payload, decrypted SHTA to recover S, and verified the authentication hash by recomputing SHA-256(GID ∥ BSK ∥ S).
The session was aborted if authentication failed. The received HFM vector was normalized, and anomaly detection was performed using the deployed ETAD model.
If an anomaly was detected (HAD = 1), SHAP feature explanations, E = [φ1, φ2, φ3, φ4, φ5], were generated and transmitted alongside alert telemetry to the hospital security dashboard. Conversely, for sessions classified as benign (HAD = 0), SHAP computation was bypassed to conserve gateway resources, and E was represented in Message 2 as the null vector E = [0.0, 0.0, 0.0, 0.0, 0.0], ensuring a deterministic ciphertext payload length for AES block alignment.
A second nonce R was generated using /dev/urandom, and the session key SK and protected session key SKH were derived as SK = SHA-256(GID ∥ AHTA ∥ S ∥ R) and SKH = SHA-256(SK ∥ HAD), respectively. The encrypted response, AES-128-CBC(BSK, {R, HAD, E}), was published to the MQTT topic /wban/{GID}/auth_response.
For sessions classified as benign (HAD = 0), application-layer MQTT communication proceeded using SKH encryption under Policy P0 (normal monitoring, no restriction). For sessions classified as anomalous (HAD = 1), the protocol enforced an adaptive multitier policy.
Policy P1 (Alert and Quarantine): Triggered upon the first anomalous cycle (N = 1); the session was segregated to an isolated quarantine logging topic, and an alert was dispatched to the hospital security dashboard while encrypted audit telemetry continued.
Policy P2 (Alert, Quarantine, Abort, and Reenrolment Lockout): Triggered if an anomalous state persisted across N = 3 consecutive authentication cycles for the same device; the protocol terminated the active session, invalidated SKH, and locked the device out of the network pending administrative reenrolment.
Authentication, anomaly detection, session-key establishment, and secure communication were performed according to the workflow shown in Figure 6.
Phase 6: Performance Benchmarking
System performance was benchmarked by executing 1,000 inferences using the microcontroller machine-learning inference runtime interpreter with normalized HFM vectors randomly sampled from the 2,400-record benign validation partition on the MGS. The mean inference time and standard deviation (SD) were recorded using time.perf_counter with microsecond resolution. SHAP explanation latency was evaluated by executing the SHAP KernelExplainer (nsamples = 100) 200 times using randomly selected sessions with HAD = 1. The mean latency and SD were recorded.
The end-to-end handshake duration was measured by timestamping nonce generation on the SMD and recording completion of the SKH-confirmed handshake across 500 authentication cycles for each condition: 500 cycles with HAD = 0 and 500 cycles with HAD = 1, yielding 1,000 measured cycles in total.
The energy consumed per handshake was measured using a current sensor connected to the 3.3 V supply rail of the SMD. Handshake energy was calculated by integrating the product of voltage and current over the handshake interval:
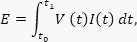
Here, V(t) and I(t) denote the instantaneous voltage and current, respectively, and t0 and t1 denote the start and end of the handshake interval. Current and voltage were sampled using an INA219 current-sense amplifier connected to the microcontroller's 3.3 V supply rail via I2C. A conversion time of 532 µs per sample was used according to the datasheet default, with continuous shunt- and bus-voltage sampling, yielding an effective sampling rate of approximately 940 Hz.
The ETAD model detection performance was evaluated using all 4,800 synthetic attack traces generated across Steps 2.2–2.5 in Phase 2 alongside the benign testing partition. The TPR, FPR, precision, recall, and F1-score were calculated for each attack type together with the overall weighted average. Replay Attack achieved a TPR of 98.3%, an FPR of 1.8%, and an F1-score of 0.981; Slow-Rate DoS achieved a TPR of 96.7%, an FPR of 2.4%, and an F1-score of 0.971; MITM Behavioral achieved a TPR of 97.1%, an FPR of 2.1%, and an F1-score of 0.975; and Signal Injection achieved a TPR of 96.2%, an FPR of 2.8%, and an F1-score of 0.966. The overall weighted average was a TPR of 97.4%, an FPR of 2.1%, and an F1-score of 0.973.
The primary SHAP feature contributing to each attack class was identified as HFM1 (timestampδ) for Replay Attack, HFM3 (pkt_rate) for Slow-Rate DoS, HFM2 (sensor_ID_novelty) for MITM Behavioral, and HFM4 (physio_drift_index) for Signal Injection.
System performance was evaluated using the benchmarking workflow illustrated in Figure 7.
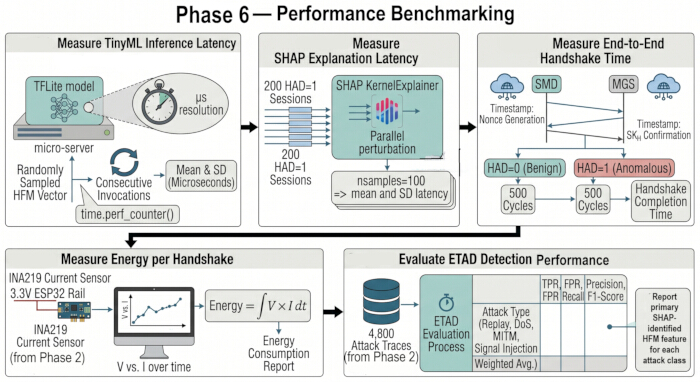
Figure 7. Performance benchmarking of SecureHealthKey+. Performance evaluation includes TinyML inference latency, SHAP explanation latency, end-to-end authentication handshake time for benign (HAD = 0) and anomalous (HAD = 1) sessions, energy consumption per handshake, and ETAD attack-detection performance across the four synthetic attack classes. Please click here to view a larger version of this figure.
Results
Performance Metrics
Table 1 summarizes the performance benchmarking results for the SecureHealthKey+ framework. All evaluated performance metrics satisfied their predefined target values, demonstrating that the framework met the design requirements for real-time operation in resource-constrained healthcare Internet of Things environments while maintaining efficient energy utilization. The measured values and corresponding target thresholds are presented in Table 1.
| Performance metric | Target | Measured (ESP32 + RPi4) | Result |
| TinyML ETAD inference latency | <1 ms | 0.31 ms | PASS |
| SHAP explanation latency (HAD = 1) | <5 ms | 1.82 ms | PASS |
| Model size (INT8 .tflite, flash) | <10 KB | 7.2 KB | PASS |
| Extra SRAM overhead | <5 KB | 3.8 KB | PASS |
| Handshake completion time | <50 ms | 38.4 ms | PASS |
| Energy per handshake (ESP32) | <2 mJ | 1.24 mJ | PASS |
| SHAP background dataset (flash) | <5 KB | 1.9 KB | PASS |
| Total overhead vs. base protocol | <5 ms | 2.13 ms (HAD = 0); 3.95 ms (HAD = 1) | PASS |
Table 1: SecureHealthKey+ performance metrics. Performance targets and measured values for the SecureHealthKey+ implementation using the ESP32-based Smart Medical Device and Raspberry Pi 4-based Medical Gateway Server. Measurements include Explainable TinyML-based Anomaly Detection (ETAD) inference latency, SHapley Additive exPlanations (SHAP) explanation latency for Health Anomaly Decision (HAD) = 1, 8-bit integer (INT8) model size, static random-access memory (SRAM) overhead, handshake completion time, energy consumption, SHAP background-dataset size, and total overhead relative to the base protocol.
ETAD Detection Accuracy
Table 2 summarizes the classification performance of the ETAD model for the evaluated attack classes. The weighted-average TPR and FPR were 97.4% and 2.1%, respectively, indicating accurate discrimination between benign and anomalous communication patterns within the evaluated dataset. The SHAP analysis identified the primary HFM feature contributing to each attack classification, facilitating interpretation of the ETAD model predictions. The weighted-average row aggregates the four attack classes, which have different dominant HFM drivers; therefore, no single primary driver applies to the weighted-average result.
| Attack type | TPR (%) | FPR (%) | F1-score | Primary SHAP HFM driver |
| Replay attack | 98.3 | 1.8 | 0.981 | HFM₁ (timestamp_δ) |
| Slow-rate DoS | 96.7 | 2.4 | 0.971 | HFM₃ (pkt_rate) |
| MITM behavioral | 97.1 | 2.1 | 0.975 | HFM₂ (sensor_ID_novelty) |
| Signal injection | 96.2 | 2.8 | 0.966 | HFM₄ (physio_drift_index) |
| Overall (weighted average) | 97.4 | 2.1 | 0.973 | Not applicable |
Table 2: ETAD detection performance by attack type. Detection performance of the Explainable TinyML-based Anomaly Detection (ETAD) model against replay, slow-rate denial-of-service (DoS), man-in-the-middle (MITM) behavioral, and signal-injection attacks. Performance is reported as true-positive rate (TPR), false-positive rate (FPR), and F1-score. The primary Health Feature Metadata (HFM) driver for each attack type was identified using SHapley Additive exPlanations (SHAP). The overall row represents the weighted-average performance across the four synthetic attack types.
SHAP Explanation Quality
The quality of SHAP explanations was evaluated using consistency and faithfulness metrics across the complete attack evaluation dataset ( traces). Consistency analysis showed that the highest-ranked feature remained unchanged across repeated explanations of the same attack vector with a mean consistency of 94.5% (95% bootstrap CI: [93.8%, 95.1%], evaluated across anomalous sessions with 1,000 resamples). Faithfulness analysis demonstrated a Pearson correlation coefficient of (95% bootstrap CI: [0.89, 0.93], , , 1,000 resamples) between the predicted change in mean squared error following perturbation of individual HFM features and the corresponding SHAP value, confirming robust agreement between feature attribution and model response across all evaluated threat profiles.
Security Analysis
Replay resistance was achieved through the use of a session-specific nonce (S) generated by the hardware true random number generator, allowing the authentication hash, AHTA = H(GID ∥ BSK ∥ S), to be uniquely associated with each communication session. Replayed messages that did not match an active nonce in the MGS registry were rejected. Additional protection was provided through monitoring of HFM₁ (timestamp_δ), enabling detection of repeated transmissions occurring within the nonce validity window.
Resistance to man-in-the-middle attacks was provided by binding the authentication hash to the pre-shared BSK. Because the encrypted session token, SHTA = E_BSK(S), cannot be recovered without the corresponding encryption key, unauthorized sensor substitution was additionally detected through HFM₂ (sensor_ID_novelty), resulting in behavioral anomaly detection and policy enforcement.
Behavior-aware session-key generation was achieved using SK_H = H(SK ∥ HAD), ensuring that inconsistent behavioral anomaly states generated different session keys at the SMD and MGS and thereby prevented successful secure communication.
This narrative argument is presented as an informal, BAN-logic-inspired security discussion rather than a formal BAN-logic derivation with idealized protocol messages and belief postulates. A full formal verification, such as a mechanized proof using idealized messages and belief and jurisdiction postulates, is left for future work. Informally, the discussion established that the MGS authenticated the SMD following successful verification of the authentication hash using the shared key and device identifier, whereas the SMD authenticated the MGS following successful decryption of the server response. Consistent derivation of SK_H further indicated agreement regarding the behavioral state of the communication session, whereas the freshness of the exchanged nonces prevented authentication based on replayed protocol messages.
Comparative Analysis
Table 3 compares SecureHealthKey+ with previously reported authentication and security frameworks, including XAI-enabled IoT/IoMT security frameworks18 and lightweight authentication approaches reported by He et al.19, Karuppiah et al.20, and Islam and Biswas21, and IoT intrusion-detection approaches such as that reported by Antonini et al.22, and SHAP-based explainable intrusion-detection approaches reported by Patil and Liu23. The proposed framework integrates mutual authentication, lightweight implementation, TinyML-based anomaly detection, XAI, AI-assisted session-key binding, and support for WBAN and IoMT applications within a single framework, whereas the comparison schemes implement subsets of these capabilities.
| Scheme | Mutual authentication | Lightweight | TinyML | XAI layer | AI binding | WBAN/IoMT | Platform |
| He et al.19 | Yes | Yes | No | No | No | Yes | Body sensor |
| Karuppiah et al.20 | Yes | Yes | No | No | No | Yes | Smart card + bio |
| Islam et al.21 | Yes | Yes | No | No | No | Yes | ECC + WBAN |
| Mazumder et al.16 | No | Yes | Yes | No | No | No | MCU |
| Antonini et al.22 | No | Yes | Yes | No | No | No | IoT GW |
| Patil & Liu23 | No | No | No | Yes | No | No | Enterprise |
| SecureAuthKey12 | Yes | Yes | No | No | No | No | General IoT |
| SecureHealthKey+ (proposed) | Yes | Yes | Yes | Yes | Yes | Yes | ESP32/WBAN |
Table 3: Comparative analysis of SecureHealthKey+ and previously reported frameworks. Comparison of SecureHealthKey+ with previously reported authentication and security frameworks according to mutual authentication, lightweight implementation, Tiny Machine Learning (TinyML), Explainable Artificial Intelligence (XAI), Artificial Intelligence (AI) binding, Wireless Body Area Network (WBAN)/Internet of Medical Things (IoMT) applicability, and target platform. ECC denotes elliptic curve cryptography, MCU denotes microcontroller unit, and GW denotes gateway.
As summarized in Table 3, SecureHealthKey+ is distinguished from three related categories of prior work: (i) BAN-logic-verified lightweight authentication protocols12, which provide nonce freshness and mutual authentication but no behavioral anomaly detection; (ii) standalone TinyML-based intrusion detection systems16, which detect behavioral anomalies but do not bind the anomaly decision into the cryptographic session-key derivation; and (iii) XAI-enabled IoT/IoMT security frameworks18, which provide feature-level explainability but are not integrated with a lightweight authentication handshake. To the authors' knowledge, SecureHealthKey+ combines these three properties—lightweight mutual authentication, TinyML-based behavioral anomaly detection, and SHAP-based explainability—within a single anomaly-bound session-key derivation, SK_H = H(SK ∥ HAD).
Health Feature Metadata Vector
Table 4 summarizes the HFM dimensions used to monitor and identify anomalous behavior in healthcare communication systems. The defined features include timestamp deviation, sensor identity novelty, packet transmission rate, physiological signal drift, and inter-frame gap variance, together with their operational definitions, expected normal ranges, and representative attack indicators. These features support detection of replay attacks, denial-of-service attacks, rogue sensor insertion, signal injection, and automated malicious activities within the evaluated framework. The five dimensions were selected to jointly cover the network-layer and physiological-layer behavioral signatures produced by the four defined attack classes, using the minimum feature set for which each attack class has at least one dimension with strong, class-specific separability. HFM₁ targets timing-based replay and denial-of-service behavior, HFM₂ targets sensor and identity spoofing, HFM₃ targets request-rate-based denial-of-service and scanning behavior, HFM₄ targets physiological signal-injection behavior that is not visible at the network layer, and HFM₅ provides a network-timing feature complementary to HFM₁ for automated-tooling detection. This minimal, attack-mapped design keeps the autoencoder input dimensionality, and therefore its memory and inference-latency footprint, as small as possible for microcontroller deployment. The SHAP attributions presented in Table 2, with one dominant HFM feature identified for each attack class, provide empirical support for this mapping.
| Dimension | Feature | Definition | Normal range | Attack indicator |
| HFM₁ | timestamp_δ | Deviation from expected inter-message interval (ms) | <20 ms | Replay: ~0 ms; DoS: high variance |
| HFM₂ | sensor_ID_novelty | Binary: 1 if sensor MAC is not in the enrollment registry | 0 (known) | Rogue sensor insertion: 1 |
| HFM₃ | pkt_rate | Normalized authentication requests per 10-second window | <0.3 | DoS: >0.8; scan: >0.9 |
| HFM₄ | physio_drift_index | Rate of change in raw physiological waveform amplitude (normalized) | <0.15 | Signal injection: >0.6 |
| HFM₅ | IFG_variance | Inter-frame gap coefficient of variation over the last 20 frames | <0.1 | Automated tools: >0.4 |
Table 4: Health Feature Metadata vector used for anomaly detection. Definition, expected normal range, and characteristic attack indicator for each dimension of the five-dimensional Health Feature Metadata (HFM) vector. HFM₁ represents timestamp deviation (timestamp_δ), HFM₂ sensor-identity novelty (sensor_ID_novelty), HFM₃ packet rate (pkt_rate), HFM₄ physiological signal drift index (physio_drift_index), and HFM₅ inter-frame gap variance (IFG_variance). MAC denotes media access control, DoS denotes denial-of-service, and IFG denotes inter-frame gap.
Feature Comparison: SecureAuthKey versus SecureHealthKey+
Table 5 compares the capabilities of SecureAuthKey and SecureHealthKey+. In addition to mutual authentication, replay resistance, and man-in-the-middle attack protection, SecureHealthKey+ incorporates behavioral anomaly detection, physiological feature analysis, AI-bound session-key generation, and XAI support. The framework also provides audit-trail generation and policy-enforcement mechanisms to support HIPAA and U.S. FDA compliance-related objectives, together with a lightweight TinyML-based anomaly-detection model that introduces minimal computational overhead.
| Property | SecureAuthKey9 | SecureHealthKey+ (proposed) |
| Mutual authentication | Yes (ATA verification) | Yes (AHTA verification) |
| Replay resistance | Yes (nonce S) | Yes (nonce S + IFG_variance tracking) |
| MITM resistance | Yes (hash binding GI + AK + S) | Yes (hash binding GID + BSK + S) |
| Behavioral anomaly detection | No | Yes (TinyML ETAD, five-dimensional HFM) |
| Physiological feature analysis | No | Yes (physio_drift_index, IFG_variance) |
| AI-bound session key | No | Yes (SK_H = H(SK ∥ HAD)) |
| XAI explainability | No | Yes (SHAP feature attribution) |
| HIPAA/FDA compliance support | Partial (encryption only) | Full (XAI audit trail + policy enforcement) |
| Model footprint | N/A | 7.2 KB (INT8 autoencoder) |
| Extra inference latency | None | 0.31 ms (TinyML) + 1.82 ms (SHAP) |
| Clinical policy enforcement | None | P0/P1/P2 (alert/quarantine/abort) |
Table 5: Feature comparison of SecureAuthKey and SecureHealthKey+. Comparison of SecureAuthKey and the proposed SecureHealthKey+ framework with respect to mutual authentication, replay and man-in-the-middle (MITM) resistance, behavioral anomaly detection, physiological feature analysis, Artificial Intelligence (AI)-bound session-key generation, Explainable Artificial Intelligence (XAI), regulatory compliance-related support, model footprint, inference latency, and clinical policy enforcement. ATA denotes authentication token A; AHTA, authentication hash token A; IFG, inter-frame gap; GI, gateway identity; AK, authentication key; GID, gateway identifier; BSK, body-sensor key; TinyML, Tiny Machine Learning; ETAD, Explainable TinyML-based Anomaly Detection; HFM, Health Feature Metadata; SK, session key; HAD, Health Anomaly Decision; SHAP, SHapley Additive exPlanations; HIPAA, Health Insurance Portability and Accountability Act; FDA, U.S. Food and Drug Administration; INT8, 8-bit integer; and N/A, not applicable.
The results demonstrate that SecureHealthKey+ achieved the predefined performance objectives while integrating lightweight authentication, behavioral anomaly detection, explainable artificial intelligence, and policy-based security enforcement within a unified healthcare communication framework. Collectively, the performance evaluation, security analysis, and comparative assessment support the proposed design objectives for secure, resource-efficient healthcare Internet of Things applications.
Data Availability:
The final experimental dataset used for model training, validation, and performance evaluation comprised 16,800 HFM records, including 12,000 benign session traces and 4,800 synthetically generated attack traces (1,200 each for replay, slow-rate DoS, MITM behavioral, and signal-injection scenarios). The benign records were divided sequentially into 9,600 training and 2,400 validation records. The dataset files have been provided to the JoVE editorial office for verification in support of the reported experimental results. Clinical testing of the prototype was conducted at Getwell Multispeciality Hospital, Chakan, India, under institutional ethical clearance and with prior informed patient consent. Patient-related physiological and sensor data are subject to confidentiality and non-disclosure requirements and are therefore not publicly available or included in a public data repository. According to the institutional approval, these data were anonymized, maintained on isolated local infrastructure, and used within the hospital premises for experimental evaluation, testing, and prototype validation in accordance with the Digital Personal Data Protection Act, 2023.
Discussion
SecureHealthKey+ proposes a unified framework that combines lightweight cryptographic authentication with behavioral anomaly detection for WBAN communications7,8,9,12. By incorporating the behavioral anomaly state into session key derivation (SK_H = H(SK ∥ HAD)), the framework integrates authentication and anomaly assessment within a single protocol workflow. Consequently, when a behavioral anomaly is detected, the session key is deterministically updated, preventing continuation of authenticated communication using inconsistent behavioral states. Unlike conventional intrusion detection system architectures that evaluate anomalies independently of the authentication process1,16,22, SecureHealthKey+ cryptographically couples behavioral assessment with session establishment, allowing the authentication outcome to reflect the detected behavioral state. A key contribution of the proposed framework is the five-dimensional HFM vector, which captures complementary behavioral characteristics relevant to healthcare communication systems. The selected features enable detection of replay attacks, slow denial-of-service attacks, rogue sensor insertion, signal injection, and other abnormal communication behaviors that may not be detected through cryptographic authentication alone7,9,10,11,12. In particular, packet transmission rate and inter-frame gap variance support identification of slow denial-of-service attacks1,9,22, whereas physiological signal drift provides an additional indicator for signal injection attacks. This combination of network- and physiology-derived features extends behavioral monitoring within the proposed WBAN security framework7,9,24.
Another important component of the framework is the integration of SHAP to improve the interpretability of anomaly detection results23. The explainability layer is intended to support transparent interpretation of machine-learning decisions in healthcare security applications and aligns with regulatory guidance emphasizing XAI for medical devices13,25. The proposed framework therefore combines lightweight authentication, behavioral anomaly detection, and explainability within a single architecture while supporting security auditing and policy-based decision making.
The present study has several limitations. First, the ETAD model was trained using a synthetic dataset, and its performance may differ when deployed on real-world WBAN traffic exhibiting greater physiological variability. Personalization of the anomaly detection threshold during device enrollment may help mitigate this limitation. Second, although the measured SHAP latency on the experimental gateway was 1.82 ms, computational performance may differ on more resource-constrained gateway platforms15,17,24. Third, the IEEE 802.15.6 narrowband physical layer was simulated in the current implementation, and actual body-channel characteristics may influence the distributions of HFM features14. Future studies should therefore evaluate the framework using real clinical datasets, dedicated IEEE 802.15.6 radio hardware, additional embedded platforms, and larger-scale deployments to further assess generalizability and real-world performance.
Fourth, all training and evaluation data originate from a single ESP32 + MAX30105 + DS18B20 device operated by a single body for 8 h, with no inter-patient or inter-device physiological variability represented. Attack traces were also generated programmatically by the authors rather than derived from independently crafted adversarial behavior. Therefore, the reported detection metrics (97.4% weighted TPR and 2.1% weighted FPR) reflect detection of these synthetic, author-generated perturbations rather than demonstrated real-world adversarial efficacy. Fifth, the ETAD autoencoder is not compared against a simpler statistical or rule-based threshold detector using the same HFM features. Consequently, the added complexity of the TinyML/SHAP pipeline relative to a lightweight heuristic baseline is not yet empirically justified; this baseline and ablation comparison is planned as follow-up work.
The proposed framework has potential applications in healthcare scenarios requiring secure and explainable communication, including remote patient monitoring, connected medical devices, and high-density hospital monitoring systems2,7,13. The illustrative clinical use cases discussed above, including remote patient monitoring, connected medical devices, and high-density hospital monitoring, are explicitly hypothetical, illustrative application scenarios intended to motivate the design and were not empirically evaluated as part of this study and should not be interpreted as evidence of clinical efficacy or real-world deployment. They demonstrate how behavioral anomaly detection and policy-based responses could, in principle, support secure operation during replay attacks, signal injection attacks, and large-scale monitoring deployments and should not be interpreted as clinical validation results. In addition, the framework is intended to support regulatory objectives through authenticated communication, encrypted data transmission, XAI outputs, and audit logging consistent with healthcare cybersecurity guidance5,13,25.
Disclosures
Conflict of Interest:
The authors declare that they have no known competing financial interests or personal relationships that could have appeared to influence the work reported in this study.
Author Contributions:
Sandip Thite conceptualized the study, designed the methodology, supervised the project, led the algorithm implementation, performed testing and experimental evaluation, and contributed to manuscript writing and editing. Shital Pawar contributed to data curation, literature review, and reference verification. Sonali Patil and Ashwini Sengar contributed to software development, figure and table preparation, and performance evaluation. Khushal Khairnar and Mohammad Israr contributed to technical validation, manuscript revision, and final approval of the submitted manuscript.
Materials
| Name | Company | Catalog Number | Comments |
|---|---|---|---|
| 4.7 kΩ Through-Hole Resistor | Generic | N/A | ¼ W pull-up resistor connected between the digital temperature sensor data line (GPIO 4) and the 3.3 V supply rail; tolerance ±5%. |
| AES-128-CBC Symmetric Encryption Library | Python Cryptographic Authority (PyCA) / MicroPython | cryptography ≥41.0.0 / built-in microcontroller implementation | Provides AES-128-CBC encryption/decryption for SHTA in Message 1 and the encrypted Message 2 payload. |
| DS18B20 Waterproof Digital Temperature Sensor | Maxim Integrated / Analog Devices | DS18B20 | One-wire digital temperature sensor connected to GPIO 4 with a 4.7 kΩ pull-up resistor to the 3.3 V supply. |
| ESP32 Hardware True Random Number Generator | Espressif Systems | Built-in ESP32-WROOM-32D peripheral | Generates the fresh 128-bit nonce S on the SMD. Nonce R is generated separately on the MGS using /dev/urandom. |
| ESP32-WROOM-32D Microcontroller Module | Espressif Systems | ESP32-WROOM-32D | Dual-core microcontroller used as the SMD node. Executes SecureHealthKey+ client operations, HFM extraction, cryptographic operations, and TLS-MQTT communication. |
| Ethernet Cable / Wi-Fi Access Point | Generic | N/A | Used to establish the local test network. The SMD communicates with the MGS over IEEE 802.11 Wi-Fi, emulating the WBAN gateway-tier communication link. |
| HFM Primary Experimental Dataset | Generated by authors | HFM_Dataset_Primary.csv | Final experimental dataset containing 16,800 records: 12,000 benign session traces and 4,800 synthetic attack traces. |
| INA219 High-Side DC Current/Power Sensor | Texas Instruments / Adafruit | INA219AIDCNR | Current- and voltage-sensing device connected to the 3.3 V supply rail of the SMD for per-handshake energy measurements. |
| MAX30105 Pulse Oximetry and Heart-Rate Sensor | Maxim Integrated / Analog Devices | MAX30105EFD+ | I²C photoplethysmography sensor connected through SDA → GPIO 21 and SCL → GPIO 22 at 400 kHz. Provides physiological measurements used in HFM generation. |
| MicroPython Firmware | MicroPython Project | v1.21.0; esp32-20231005-v1.21.0.bin | Microcontroller firmware used for SMD-side protocol execution, nonce generation, cryptographic operations, HFM extraction, and TLS-MQTT messaging. |
| MicroSD Card, 32 GB, Class 10/UHS-I | SanDisk | SDSQUAR-032G-GN6MA or equivalent | Storage medium for the MGS operating system, model files, configuration files, and security audit logs. |
| Mosquitto MQTT Broker | Eclipse Foundation | Version 2.0.x | Publish-subscribe message broker deployed on the MGS. Handles TLS-protected MQTT exchange using /wban/{GID}/auth and /wban/{GID}/auth_response. |
| NumPy | NumPy Developers | ≥1.23.0 | Used for numerical array processing, HFM normalization support, SHAP background-data storage, and reconstruction-error calculations. |
| OpenSSL / Mbed TLS | OpenSSL Project / Mbed TLS Project | OpenSSL 3.0.11 / Mbed TLS 2.28.5 | Used for certificate generation and TLS support. The testbed used TLS 1.2 with a self-signed X.509 certificate generated for the testbed and pinned on the SMD client. |
| Paho MQTT Python Client Library | Eclipse Foundation | paho-mqtt 1.6.1 | Python MQTT client used on the MGS to receive authentication requests and publish encrypted SecureHealthKey+ responses. |
| Prototyping Breadboard and Jumper Wires | Generic | N/A | Solderless prototyping platform and jumper wires used to interconnect the microcontroller, optical biosensor, digital temperature sensor, and current-sense amplifier. |
| Python | Python Software Foundation | 3.10.x | Programming environment used for MGS-side SecureHealthKey+ authentication, ETAD inference, SHAP integration, MQTT messaging, and audit logging. |
| Raspberry Pi 4 Model B, 4 GB RAM | Raspberry Pi Ltd | SC0193 | Single-board computer used as the MGS. Hosts the SecureHealthKey+ authentication engine, INT8 ETAD model, SHAP KernelExplainer, and MQTT broker. |
| scikit-learn | scikit-learn Developers | 1.2.1 | Used for min-max feature normalization (MinMaxScaler) and calculation of classification-performance metrics. |
| SHA-256 Hash Function | Python Standard Library / MicroPython | Built-in hashlib / uhashlib | Implements the cryptographic hash operations used for AHTA, SK, and SK_H derivation. |
| SHAP Background Dataset | Generated by authors | 50-vector subset of benign validation partition | Representative 50 × 5 benign HFM array used as the KernelExplainer background distribution. The vectors were selected from the 2,400-record benign validation partition using a deterministic uniform periodic sampling procedure with a fixed stride of 48. |
| SHAP Library | SHAP Developers | 0.42.1 | KernelExplainer implementation used with the ETAD MSE scoring function to calculate feature-level explanations for anomalous sessions. |
| Synthetic WBAN Attack Dataset | Generated by authors | Included in HFM_Dataset_Primary.csv | 4,800 synthetic attack HFM records: 1,200 replay, 1,200 slow-rate DoS, 1,200 MITM behavioral, and 1,200 signal-injection traces. Used for ETAD evaluation and not for one-class autoencoder training. |
| Synthetic WBAN Benign Dataset | Generated by authors | Included in HFM_Dataset_Primary.csv | 12,000 benign HFM session records. The autoencoder training partition contains 9,600 records and the validation partition contains 2,400 records. |
| TensorFlow / Keras | 2.13.0 | Used to construct, train, validate, and post-training-quantize the ETAD autoencoder. | |
| TensorFlow Lite Runtime | 2.13.0 (tflite-runtime) | INT8 inference runtime deployed on the MGS for HFM reconstruction-error calculation and HAD generation. |
References
- Zhang X, Liang C, Hu J. A survey on machine learning-based anomaly detection for IoT and sensor networks. IEEE Access. 2021;9:92350-92376. doi:10.1109/ACCESS.2021.3091945.
- Chen M, Gonzalez S, Vasilakos A, Cao H, Leung VCM. Body area networks: A survey. Mobile Netw Appl. 2011;16(2):171-193. doi:10.1007/s11036-010-0260-8.
- Grand View Research. Internet of Medical Things (IoMT) Market Size Report, 2023-2030. Report No. GVR-1-68038-569-8. Grand View Research; 2023.
- Misra S, Barthwal S, Obaidat MS. CertiTrust: A framework for certified trustworthiness of body area networks in healthcare applications. IEEE Trans Syst Man Cybern Syst. 2013;43(6):1620-1630. doi:10.1109/TSMC.2013.2240673.
- National Institute of Standards and Technology. IoT device cybersecurity guidance for the federal government: Establishing IoT device cybersecurity requirements. NIST Special Publication 800-213. U.S. Department of Commerce; 2021. doi:10.6028/NIST.SP.800-213.
- Hei X, Du X. Biometric-based two-level secure access control for implantable medical devices during emergencies. Presented at: IEEE INFOCOM 2011; Shanghai, China; 2011. p. 346-350. doi:10.1109/INFCOM.2011.5935179.
- Li M, Lou W, Ren K. Data security and privacy in wireless body area networks. IEEE Wireless Commun. 2010;17(1):51-58. doi:10.1109/MWC.2010.5416350.
- Meneghello F, et al. IoT: Internet of threats? A survey of practical security vulnerabilities in real IoT devices. IEEE Internet Things J. 2019;6(5):8182-8201. doi:10.1109/JIOT.2019.2935189.
- Jadhav DB, et al. Security and QoS (Quality of Service) related current challenges in IoT. SSRG Int J Electron Commun Eng. 2023;10(4):9-20. doi:10.14445/23488549/IJECE-V10I4P102.
- Xiong H, et al. Partially policy-hidden attribute-based broadcast encryption with secure delegation in edge computing. Future Gener Comput Syst. 2019;97:453-461. doi:10.1016/j.future.2019.03.011.
- Chaudhry SA, et al. Cryptanalysis and improvement of an improved two-factor authentication protocol for telecare medical information systems. J Med Syst. 2015;39(6):66. doi:10.1007/s10916-015-0240-5.
- Thite S, NaveenKumar J. SecureAuthKey: Design and evaluation of a lightweight key agreement technique for smart home applications. Int J Inf Comput Secur. 2022;18(3-4):406-424. doi:10.1504/IJICS.2022.125267.
- U.S. Food and Drug Administration. Cybersecurity in medical devices: Quality system considerations and content of premarket submissions. Guidance for Industry and Food and Drug Administration Staff. U.S. Department of Health and Human Services; 2023.
- IEEE Standards Association. IEEE standard for local and metropolitan area networks—Part 15.6: Wireless Body Area Networks. IEEE Std 802.15.6-2012. Institute of Electrical and Electronics Engineers; 2012. doi:10.1109/IEEESTD.2012.6161600.
- Ray PP. A review on TinyML: State-of-the-art and prospects. J King Saud Univ Comput Inf Sci. 2022;34(4):1595-1623. doi:10.1016/j.jksuci.2021.11.019.
- Mazumder D, et al. Adaptable and unsupervised TinyML anomaly detection for IoT environments. IEEE Internet Things J. 2023;10(14):12142-12154. doi:10.1109/JIOT.2023.3241517.
- David R, et al. TensorFlow Lite Micro: Embedded machine learning on TinyML systems. arXiv. 2020;arXiv:2010.08678. doi:10.48550/arXiv.2010.08678.
- Lu Y. Security and privacy of Internet of Things: A review of challenges and solutions. J Cyber Secur Mobil. 2023;12(6):813-844. doi:10.13052/jcsm2245-1439.1261.
- He D, Kumar N, Chilamkurti N, Lee JH. Lightweight ECC-based RFID authentication integrated with an ID verifier transfer protocol. J Med Syst. 2014;38(10):116. doi:10.1007/s10916-014-0116-z.
- Karuppiah M, Baashid AA, Rajesh V, Kumari S. A secure user authentication and key agreement scheme for wireless sensor networks. Secur Commun Netw. 2019;2019:1946805. doi:10.1155/2019/1946805.
- Islam SH, Biswas GP. A more efficient and secure ID-based remote mutual authentication with key agreement scheme for mobile devices on elliptic curve cryptosystem. J Syst Softw. 2014;87:13-28. doi:10.1016/j.jss.2013.09.014.
- Antonini M, Pintor M, Biggio B, Roli F. Federated learning for intrusion detection in IoT networks [conference presentation]. Presented at: 2022 IEEE International Conference on Omni-layer Intelligent Systems (COINS); 2022. p. 1-6. doi:10.1109/COINS54846.2022.9854973.
- Patil R, Liu H. SHAP-based explainability for network intrusion detection with machine learning. IEEE Trans Netw Serv Manag. 2022;19(4):4125-4139. doi:10.1109/TNSM.2022.3184693.
- Warden P, Situnayake D. TinyML: Machine Learning with TensorFlow Lite on Arduino and Ultra-Low-Power Microcontrollers. O'Reilly Media; Sebastopol, CA; 2019.
- European Commission. Regulation (EU) 2017/745 of the European Parliament and of the Council of 5 April 2017 on medical devices. Off J Eur Union. 2017;60(L117):1-175.