This computational study presents a compartment-aware workflow for benchmarking public respiratory-virus transcriptomes, demonstrating that nasal and blood host responses show limited gene-level concordance yet yield reproducible, biologically interpretable compartment-specific modules across independent datasets, clinical comparisons, longitudinal recovery, and robustness analyses.
Research Article
Compartment-Aware Benchmarking of Respiratory-Virus Transcriptomes for Nasal and Blood Host-Response Modules: A Computational Study
In This Article
Summary
Abstract
Public respiratory-virus transcriptomes are valuable for studying host responses, but differences in tissue source, control definition, and study design can confound pooled analyses. We developed a compartment-aware computational workflow to determine whether reproducible host-response activity can be identified while preserving nasal and blood biological context. The paired GSE117827 paediatric cohort served as the anchor dataset, comprising nasal-swab and whole-blood transcriptomes from symptomatic picornavirus infection, symptomatic respiratory syncytial virus infection, asymptomatic picornavirus detection, and virus-negative controls. After HUGO Gene Nomenclature Committee (HGNC) filtering, 27,685 genes were analyzed. Separate 50-gene protein-coding nasal and blood modules were defined from the top positive responses and locked before external evaluation. Gene-level nasal and blood effects were nearly independent (Pearson r = 0.015), and the modules shared six exploratory rank-overlap genes (Jaccard index = 0.064). Nevertheless, the nasal module separated infection from controls in independent upper-airway cohorts, with areas under the receiver operating characteristic curve (AUROCs) of 0.749, 0.693, and 0.609, whereas the blood module achieved AUROCs of 0.832, 0.924, and 0.870 in external blood cohorts. In longitudinal natural-infection data, matched scores decreased from acute illness to discharge, with paired deltas of 0.436 for nasal samples and 0.330 for blood. Three additional benchmark datasets comprising 666 external samples, together with random-gene nulls, module-size sweeps, bootstrap stability, marker-program correlations, and variance partitioning, defined the robustness and limitations of the workflow. The Pandya 33-messenger ribonucleic acid (mRNA) set remained stronger for viral-versus-bacterial discrimination, while the blood module also increased in bacterial pneumonia. These findings support compartment-specific modules as reusable host-response activity scores for cohort comparison and recovery tracking, rather than universal pan-tissue biomarkers or stand-alone pathogen classifiers.
Introduction
Host transcriptomic signatures are widely used to classify infectious syndromes and compare immune responses across pathogens1,2,3,4,5. Respiratory viruses often activate overlapping interferon-stimulated genes (ISGs), inflammatory mediators, and antigen-presentation pathways6,7,8,9,10. Recent paired and longitudinal studies also show that local airway and systemic responses can differ in timing, cellular composition, and magnitude11. This issue extends beyond influenza, respiratory syncytial virus (RSV), rhinovirus, and SARS-CoV-2. Human metapneumovirus remains an important cause of respiratory illness, yet its host-response and intervention literature is still developing12,13. These observations across respiratory-virus infections further highlight differences between local airway and systemic host responses14. For computational host-virus studies, the practical question is therefore not only whether a response exists. It is whether public data can be reused through a transparent workflow that preserves tissue context and yields reproducible host-response scores.
Most public respiratory-virus transcriptome datasets were not designed for clean cross-virus or cross-tissue inference. Tissue source, timing, severity, age, control definition, and platform often vary together. High-throughput expression datasets are also vulnerable to unwanted technical and study-level variation15,16. A pooled analysis can therefore recover a strong interferon or inflammatory signature while obscuring its origin. Nasal samples capture epithelial and mucosal immune biology, whereas whole blood reflects systemic leukocyte responses. Treating these compartments as exchangeable makes a score easy to calculate but difficult to interpret.
We built the analysis around GSE117827, a same-study paired nasal-blood cohort, rather than the largest available discovery collection17. The cohort is small, but it reduces between-study confounding when nasal and blood effect sizes are compared. It includes symptomatic picornavirus infection, symptomatic RSV infection, asymptomatic picornavirus detection, and virus-negative controls. We therefore used it only as an anchor for separate compartment-specific modules. Module membership was locked before external testing. The stability of the small-cohort selection was examined by stratified bootstrap resampling, random-gene nulls, and module-size sensitivity analyses.
We added a benchmarking layer with bacterial and non-infectious comparators. GSE63990 contains whole-blood acute respiratory illness samples labelled viral, bacterial, or non-infectious18. GSE40012 contains severe community-acquired pneumonia, systemic inflammatory response syndrome (SIRS), and healthy controls19. These cohorts test whether a module reflects general host-response activity or pathogen-class specificity. GSE53543 was analysed separately as an ex vivo peripheral blood mononuclear cell (PBMC) rhinovirus perturbation benchmark. It measures leukocyte responsiveness under a controlled stimulus but is not equivalent to natural infection.
Our premise is deliberately conservative. We do not try to prove a universal antiviral signature from heterogeneous public data. Instead, we ask whether a compartment-aware workflow can produce module scores that remain useful after external testing. The intended use is complementary to diagnostic classifiers such as Pandya 33-mRNA. These modules score nasal and blood host-response activity across cohorts, recovery, and symptom gradients. They are not designed to assign pathogen class.
Protocol
This study reanalyzed de-identified, publicly available data and involved no new recruitment, intervention, or specimen collection. Institutional ethics approval and new informed consent were therefore not required for the present secondary analysis. Ethics approval and informed consent for the original studies were reported by the respective data generators.
Study design and workflow logic
We conducted a retrospective public-data bioinformatics study using datasets deposited in the Gene Expression Omnibus20,21. No new patient samples, cell-culture experiments, animal models, or wet-lab validation were generated. The workflow used an anchor-first design. GSE117827 was used for effect-size estimation, module construction, cross-compartment concordance, and symptom-gradient analysis. Independent datasets were introduced only after module membership had been fixed. The workflow comprised paired-compartment anchoring, HGNC mapping and protein-coding filtering, separate nasal and blood module construction, tissue-matched and longitudinal validation, clinical benchmarking, and robustness analyses. Confirmatory analyses comprised the locked tissue-matched and longitudinal tests. The overlap-gene, symptom-gradient, marker-program, and variance analyses were exploratory or descriptive.
Anchor cohort and primary contrast
GSE117827 contains nasal-swab and whole-blood expression profiles from 26 children: 9 symptomatic picornavirus cases, 5 asymptomatic picornavirus detections, 6 symptomatic RSV cases, and 6 asymptomatic virus-negative controls17. Two RSV cases lacked blood specimens. The complete anchor design therefore contained 50 samples, and the primary infected-versus-control contrast contained 40 samples after excluding asymptomatic picornavirus detections from module construction. For the primary contrast, symptomatic picornavirus and symptomatic RSV samples were labelled infected, and asymptomatic virus-negative samples were labelled controls. Asymptomatic picornavirus detections were not treated as controls because viral detection without symptoms is biologically distinct from virus-negative health. These samples were held out from module construction and later used for a symptom-gradient analysis.
Probe mapping and preprocessing
GSE117827 was profiled on GPL23126. Transcript-cluster identifiers were mapped to gene symbols using the Clariom D Human na36, hg38 annotation file distributed through GEO platform GPL24539. Only HGNC-approved symbols were retained22. Control probes, ERCC probes, unmapped transcript clusters, and non-approved symbols were removed. Multiple transcript clusters mapping to the same approved symbol were collapsed by median expression. After filtering and collapsing, 27,685 genes were available for the anchor analysis. A log₂(x + 1) transformation was applied only when the 95th percentile of the expression matrix exceeded 50, indicating an unlogged intensity scale. Genes with more than 20% missing values were removed; remaining missing values were replaced by the within-gene median. Each gene was then standardized across all samples in that dataset as z = (x − mean)/sample standard deviation (ddof = 1). Zero-variance genes were assigned a standardized value of 0. Module construction was restricted to entries classified as protein-coding genes in the HGNC complete set.
Effect-size analysis and module construction
Nasal and blood compartments were analyzed separately. Symptomatic viral samples were compared with virus-negative controls using Hedges g standardized mean differences and two-sided Welch tests23. Hedges g was calculated as the infected-minus-control mean difference divided by the pooled standard deviation and multiplied by the small-sample correction 1 − 3/(4df − 1), where df = ninfected + ncontrol − 2. Welch tests were implemented with unequal variances. Benjamini–Hochberg false discovery rates were calculated across all tested genes within each compartment24. Because no protein-coding gene met the prespecified strict combination of FDR < 0.05 and Hedges g > 0.8 in the small anchor cohort, positive-effect genes were ranked first by ascending two-sided Welch P value, then by descending Hedges g, with gene symbol as the deterministic final tie-breaker. The top 50 genes formed each primary module. Fifty genes were chosen a priori as a moderate module size that retained biological breadth while limiting missing-gene loss across platforms. This module size was not tuned to external AUROC. Sensitivity analyses using 10, 25, 50, 100, and 200 genes yielded the same qualitative anchor-separation result. The aim was module-level reproducibility, not single-gene discovery.
Cross-compartment concordance
Nasal and blood Hedges g estimates were aligned by gene and compared using Pearson and Spearman correlations. The overlap between the top 50 nasal and top 50 blood modules was summarized by overlap count and Jaccard index. Overlap genes were interpreted as exploratory cross-compartment rank-overlap candidates rather than validated conserved biomarkers.
External tissue-matched validation
Module-score validation used independent public datasets with interpretable source groups. Upper-airway validation included GSE41374 RSV nasal-wash samples and the SARS-CoV-2 datasets GSE152075 and GSE156063. Blood validation included GSE171110 and two separately normalized GSE38900 units: GPL10558 (36 samples; 28 RSV and 8 controls) and GPL6884 (138 samples; 107 RSV and 31 controls). For every external dataset, probes were mapped to HGNC symbols, and duplicate symbols were collapsed by median expression. The same transformation, missing-value filtering, median imputation, and per-gene z-standardization rules used for the anchor dataset were applied within each dataset. A module score was calculated as the unweighted mean of standardized expression values for the represented module genes. AUROC, average precision, and Welch-test FDR were reported as portability metrics, not as estimates of clinical diagnostic performance.
Large clinical benchmark and ex vivo perturbation datasets
Two whole-blood datasets were used as clinical benchmarks rather than discovery cohorts. In GSE63990, samples were assigned from the deposited infection-status metadata to viral respiratory infection (n = 117), bacterial respiratory infection (n = 73), or non-infectious illness (n = 90); samples without one of these unambiguous labels were excluded18. In GSE40012, deposited diagnosis fields were mapped to influenza A pneumonia (n = 39), bacterial pneumonia without influenza (n = 61), SIRS without pneumonia (n = 40), healthy controls (n = 36), or mixed bacterial/influenza pneumonia (n = 14)19. Mixed bacterial/influenza samples were described but excluded from binary benchmark contrasts.
GSE53543 contains 196 ex vivo PBMC profiles from 98 individuals. Each individual contributed one media-only sample and one sample exposed to rhinovirus 16 for 24 h; subject identifiers confirmed 98 complete pairs. The principal benchmark reported AUROC across the 98 stimulated and 98 unstimulated samples because AUROC is a rank-separation metric. Subject pairing was retained in the metadata and used in a paired sensitivity analysis of score differences. This experiment was analyzed separately from natural clinical infection and was not used to support clinical diagnostic claims.
Raw GEO series matrices were downloaded for GSE63990, GSE40012, and GSE53543. GPL571 was used for GSE63990, GPL6947 for GSE40012, and GPL10558 for GSE53543. Probes were mapped to HGNC-approved symbols, and duplicate mappings were collapsed by median expression. Deposited normalized matrices were used. The general 95th-percentile rule triggered log₂(x + 1) transformation only for matrices on an unlogged scale. GSE53543 was already log₂-transformed, rank-invariant normalized, and adjusted for processing day by the original investigators, so no additional log transformation was applied. After removing genes with more than 20% missing values and median-imputing the remaining missing values, each gene was z-standardized across all samples within its dataset. The benchmark layer contained 470 clinical whole-blood samples and 196 ex vivo PBMC samples.
Reference signature benchmarking
The anchor nasal and blood modules were benchmarked against three unweighted reference sets. The official Pandya 33-mRNA set was transcribed from Supplementary Table 1 of the original classifier report5. The Andres-Terre comparator comprised 33 interferon-oriented genes curated from the reported multi-virus signature3. The Hallmark comparator comprised a 33-gene interferon-alpha core subset linked to the MSigDB HALLMARK_INTERFERON_ALPHA_RESPONSE set25,26. Complete gene lists for all three reference sets are provided in Supplementary Data 1. These reference scores do not recreate the original weighted classifiers. For each dataset, a score was calculated as the unweighted mean of the available per-gene z scores; at least three represented genes were required, and the number of represented genes was reported. Benchmark contrasts were viral versus bacterial, viral versus non-infectious, viral versus bacterial-or-non-infectious, viral versus healthy/control, and bacterial versus healthy/control where the required groups were available. AUROC and average precision were interpreted as benchmarking metrics. Welch-test P values were adjusted using the Benjamini–Hochberg procedure across all valid dataset-contrast-module combinations in the benchmark table.
Independent longitudinal validation
The paired acute-versus-discharge datasets GSE97741 and GSE97742 were used only for longitudinal validation27. Samples labelled RSV single infection (RSVsi) or rhinovirus (hRV) in the deposited metadata formed the primary analysis; RSV co-infections (RSVco) were retained only in the supplementary output. Acute and discharge labels were parsed from sample titles. Samples were matched by dataset, compartment, virus group, and subject identifier, and only subjects with both time points were retained. The primary combined group comprised 38 RSVsi and 30 hRV pairs (68 pairs per compartment).
No gene selection, module refinement, or threshold tuning used GSE97741 or GSE97742. These datasets were reserved for external validation. Probe identifiers were mapped to approved HGNC symbols, and duplicate symbols were collapsed by median expression. The same 95th-percentile log-transformation rule, missing-value filter, median imputation, and within-dataset per-gene z-standardization procedures were applied before the fixed GSE117827 module scores were calculated.
For each tissue and module, acute and discharge scores were paired by subject and virus group. The acute-minus-discharge difference was calculated for each pair. Cohen dz was calculated as the mean paired difference divided by its sample standard deviation. Two-sided paired t tests and two-sided Wilcoxon signed-rank tests were reported, together with AUROC for acute-versus-discharge score separation. Benjamini–Hochberg FDR values were calculated across all 20 valid paired t tests in the full longitudinal output (two datasets, two module sources, and five prespecified virus-group summaries).
Symptom-gradient and post-hoc analysis
After module membership had been fixed, held-out asymptomatic picornavirus detections in GSE117827 were used only for symptom-gradient analysis. The ordinal clinical score was 0 for virus-negative controls, 1 for asymptomatic picornavirus detections, and 2 for symptomatic infection. Spearman correlation assessed the ordinal trend, whereas the Kruskal–Wallis test assessed overall differences among the three groups. Two-sided Mann–Whitney U post-hoc tests compared the three group pairs. Benjamini–Hochberg correction was applied separately within each compartment to its family of three pairwise comparisons.
Functional enrichment
Nasal and blood module genes were analyzed with Enrichr through gseapy using MSigDB Hallmark 2020, Reactome 2022, and GO Biological Process 2023 libraries25,26,28,29,30,31. Enrichr used its standard over-representation framework based on Fisher's exact test. Library-reported Benjamini–Hochberg-adjusted P values < 0.05 were considered significant. The eight most significant terms per module across the three queried libraries were ranked by adjusted P value. Enrichment results were used only for interpretation.
Robustness, marker-program, and variance analyses
Robustness analyses tested whether the results depended on module size or chance selection. Module sizes of 10, 25, 50, 100, and 200 genes were evaluated. For the random-gene null analysis, the eligible universe comprised HGNC protein-coding genes represented in the processed GSE117827 matrix. Five hundred 50-gene sets were sampled without replacement using a NumPy random seed of 20260622. Bootstrap reselection was restricted to the 1,000 positive-effect protein-coding genes ranked highest in the original anchor analysis for each compartment. In each resample, positive protein-coding genes were ranked by ascending two-sided Welch P value and then by descending mean difference. The top 50 genes were selected. Gene stability was calculated as the number of selections divided by 100. The 20 genes with the highest selection frequency in each compartment were displayed.
Marker-program scores were used as descriptive aids rather than as cell-fraction estimates. Six curated programs were evaluated: epithelial (EPCAM, KRT8, KRT18, KRT19, MUC1, KRT5, KRT14, SCGB1A1, FOXJ1), monocyte/macrophage (LYZ, LST1, S100A8, S100A9, FCGR3A, FCGR1A, CD14, MS4A7, CTSS), neutrophil (S100A8, S100A9, MPO, ELANE, CEACAM8, FCGR3B, OLFM4, MMP8), T/NK (CD3D, CD3E, TRAC, NKG7, GNLY, PRF1, GZMB, KLRD1, IL7R), B/plasma (MS4A1, CD79A, CD79B, MZB1, JCHAIN, IGHG1, SDC1), and myeloid interferon (SIGLEC1, IFI27, IFI44L, ISG15, MX1, OAS1, RSAD2, IFIT3). Each program score was calculated as the mean of the available per-gene z scores, with at least three represented genes required. Spearman P values were adjusted using the Benjamini–Hochberg procedure across the complete family of dataset-module-program correlations. One-way eta-squared was calculated as the between-group sum of squares divided by the total sum of squares for each module-factor pair. Rows missing the relevant factor were excluded from that calculation. This analysis was descriptive and did not adjust for mutually correlated factors.
Reproducibility
All analyses were conducted using scripted workflows in Python 3.12.13, with the software packages and versions reported in the Table of Materials. Randomized procedures used a fixed seed of 20260622. Public GEO expression matrices were processed using a consistent project structure that separated raw inputs, processed data, statistical outputs, tables, and figures. Module definitions, sample-curation records, effect-size estimates, validation statistics, enrichment results, robustness analyses, and figure-source data were retained to support independent verification. The analysis code, dependency specifications, and supporting derived data are available as described in the Data Availability statement.
Results
Anchor-step benchmarking separated tissue-specific from pan-tissue gene effects
The curated GSE117827 anchor matrix contained 27,685 HGNC-approved genes. The primary nasal contrast included 15 symptomatic infected and 6 virus-negative control samples; the blood contrast included 13 symptomatic infected and 6 controls (Table 1). Because this small cohort cannot support stable single-gene discovery, it was used as a paired-compartment anchor. Stability was evaluated at the module level by bootstrap resampling, random-gene null testing, external validation, and module-size sensitivity analyses.
| Source | Group | Condition | Primary contrast | n |
| Blood | RSV | Infected | Yes | 4 |
| Blood | Asymptomatic picornavirus | Secondary | No | 5 |
| Blood | Symptomatic picornavirus | Infected | Yes | 9 |
| Blood | Virus-negative control | Control | Yes | 6 |
| Nasal | RSV | Infected | Yes | 6 |
| Nasal | Asymptomatic picornavirus | Secondary | No | 5 |
| Nasal | Symptomatic picornavirus | Infected | Yes | 9 |
| Nasal | Virus-negative control | Control | Yes | 6 |
Table 1: GSE117827 anchor design after primary contrast curation. Sample distribution across blood and nasal compartments in the paired anchor dataset after primary contrast curation. Symptomatic respiratory syncytial virus (RSV) and symptomatic picornavirus samples were classified as infected and included in the primary contrast, whereas virus-negative controls were classified as controls and included in the primary contrast. Asymptomatic picornavirus samples were designated as secondary and excluded from module construction; they were used only in the exploratory symptom-gradient analysis. Two RSV cases lacked blood specimens, resulting in four blood and six nasal RSV samples.
Across the 27,685 shared genes, nasal and blood Hedges g estimates were nearly uncorrelated (Pearson r = 0.015; Figure 1). This result arose within one study and is less exposed to between-study differences than a pooled cross-cohort comparison. The dense central cloud shows that most genes did not move similarly in both compartments. The highlighted overlap genes were exceptions at the top of both rank lists. This pattern supports separate nasal and blood module construction.
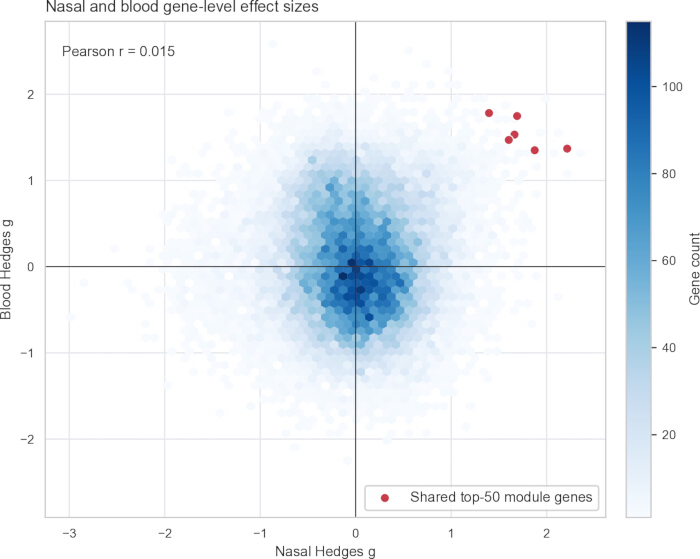
Figure 1. Nasal and blood gene-level effect sizes in the paired GSE117827 anchor cohort. Hedges g values compare symptomatic infection with virus-negative controls for 27,685 genes. Nasal estimates (15 infected, 6 controls) are shown on the x-axis, and blood estimates (13 infected, 6 controls) are shown on the y-axis. Hexagonal-bin shading indicates the number of genes per bin. Red points indicate the six genes shared between the top-50 nasal and blood modules. Pearson r = 0.015. Please click here to view a larger version of this figure.
Module construction produced a small interferon-centered overlap
The top 50 nasal and blood modules shared six genes: ISG15, ACRBP, IFIT1, RSAD2, CCRL2, and XAF1 (Jaccard index = 0.064; Table 2; Figure 2). ISG15, IFIT1, RSAD2, and XAF1 are compatible with interferon-linked antiviral biology32,33,34. CCRL2 is better interpreted in the context of inflammatory leukocyte migration35. ACRBP has no established antiviral role. All six genes are reported for transparency, but none is claimed as a validated cross-tissue biomarker. Their single-gene FDR values were not significant in the small anchor cohort. The main inference therefore rests on locked module-level validation, not on the overlap list.
| Gene | Nasal Hedges g | Nasal FDR | Blood Hedges g | Blood FDR | Interpretation |
| ISG15 | 2.215 | 0.213 | 1.369 | 0.442 | Interferon-stimulated antiviral gene; exploratory overlap |
| ACRBP | 1.69 | 0.205 | 1.748 | 0.429 | No established antiviral role; retained for transparency |
| IFIT1 | 1.875 | 0.213 | 1.35 | 0.442 | Interferon-stimulated antiviral gene; exploratory overlap |
| RSAD2 | 1.663 | 0.213 | 1.532 | 0.442 | Interferon-stimulated antiviral gene; exploratory overlap |
| CCRL2 | 1.396 | 0.217 | 1.782 | 0.442 | Inflammatory leukocyte-migration context; not virus-specific |
| XAF1 | 1.603 | 0.226 | 1.47 | 0.442 | Interferon-linked apoptosis factor; exploratory overlap |
Table 2: Complete exploratory overlap between the top-ranked nasal and blood modules. All six shared genes are reported with nasal and blood Hedges g and gene-wise FDR values. All six genes are treated as exploratory rank-overlap candidates because the gene-wise FDR values were not significant in the small anchor cohort. ACRBP is retained for transparency despite lacking an established antiviral role. None of the six genes is presented as a validated universal biomarker; the primary evidence is based on module-level external validation.
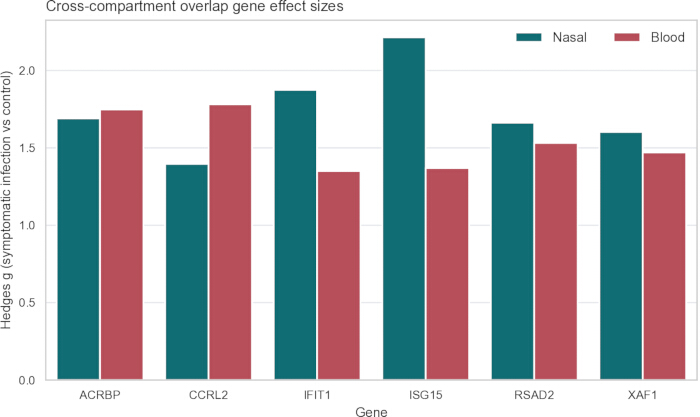
Figure 2. Effect sizes of the six exploratory nasal-blood overlap genes. Nasal and blood Hedges g estimates are shown for ACRBP, CCRL2, IFIT1, ISG15, RSAD2, and XAF1 in GSE117827. Positive values indicate higher expression in symptomatic infection than in virus-negative controls. The complete overlap is shown for transparency; single-gene FDR values were not significant, and these genes are not presented as validated universal biomarkers. Please click here to view a larger version of this figure.
Functional enrichment provided a biological check on module content
Both modules were enriched for interferon and antiviral pathways, although the gene composition and enrichment strength differed (Figure 3). The eight most significant terms per module are displayed. For the nasal module, Hallmark interferon-gamma response (adjusted P = 2.23 × 10⁻24), Hallmark interferon-alpha response (adjusted P = 1.40 × 10⁻22), Reactome interferon-alpha/beta signalling (adjusted P = 3.64 × 10⁻19), and GO defense response to virus (adjusted P = 5.47 × 10⁻15) ranked among the leading terms. The blood module showed the same broad biology at lower enrichment strength: interferon-alpha response (adjusted P = 3.87 × 10⁻6), Reactome interferon-alpha/beta signaling (adjusted P = 5.70 × 10⁻6), interferon-gamma response (adjusted P = 8.89 × 10⁻6), and defense response to virus (adjusted P = 1.07 × 10⁻4). These results support biological coherence without implying identical compartmental gene rankings.
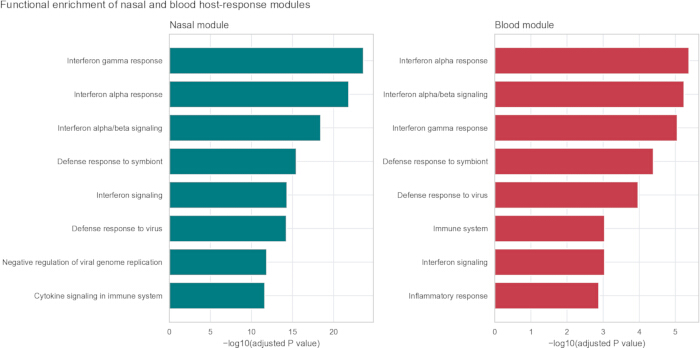
Figure 3. Selected enrichment terms for the nasal and blood modules. Over-representation analysis was performed using Enrichr with Hallmark 2020, Reactome 2022, and GO Biological Process 2023. The eight terms with the smallest Benjamini–Hochberg-adjusted P values for each module are shown. Bar length represents −log10(adjusted P value). The left and right panels show the nasal and blood modules, respectively. Terms are displayed in sentence case. Enrichment analysis did not alter module membership. Please click here to view a larger version of this figure.
Locked modules were tested in tissue-matched external validation
The locked nasal module reached AUROCs of 0.749 in GSE41374, 0.693 in GSE152075, and 0.609 in GSE156063 (Table 3; Figure 4). The locked blood module reached AUROCs of 0.832 in GSE171110, 0.924 in the GSE38900 GPL10558 unit, and 0.870 in the GPL6884 unit. Internal anchor performance is omitted because it is optimistically biased by construction. External AUROCs are treated as portability summaries. They do not establish clinical sensitivity, specificity, or readiness for diagnosis.
| Cohort | Sample/virus | Module | n positive | n negative | Genes represented | AUROC | Average precision | Welch-test FDR |
| GSE152075 | SARS-CoV-2 upper airway | Nasal | 430 | 54 | 50 | 0.693 | 0.935 | 2.20 × 10⁻⁴ |
| GSE156063 | SARS-CoV-2 upper airway | Nasal | 93 | 100 | 49 | 0.609 | 0.551 | 1.38 × 10⁻² |
| GSE171110 | SARS-CoV-2 whole blood | Blood | 44 | 10 | 50 | 0.832 | 0.959 | 7.94 × 10⁻⁴ |
| GSE38900-GPL10558 | RSV whole blood | Blood | 28 | 8 | 50 | 0.924 | 0.979 | 7.94 × 10⁻⁴ |
| GSE38900-GPL6884 | RSV whole blood | Blood | 107 | 31 | 49 | 0.87 | 0.962 | 3.47 × 10⁻¹⁵ |
| GSE41374 | RSV nasal wash | Nasal | 76 | 10 | 50 | 0.749 | 0.951 | 2.63 × 10⁻² |
Table 3: External tissue-matched module-score validation. The locked nasal module was tested in GSE41374, GSE152075, and GSE156063, and the locked blood module was tested in GSE171110 and the GSE38900 platform units GPL10558 and GPL6884. The table reports the numbers of positive and negative samples, represented module genes, AUROC, average precision, and Welch-test FDR. Internal anchor performance is omitted. AUROC and average precision are reported as portability summaries and not as estimates of clinical diagnostic performance.
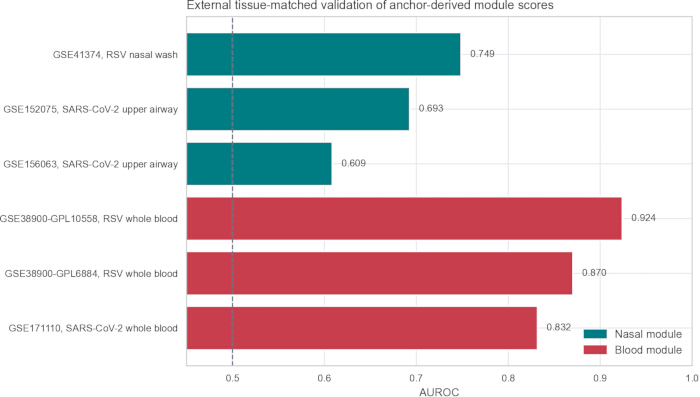
Figure 4. External tissue-matched module-score portability. AUROCs are shown for the nasal module in GSE41374 (76 RSV, 10 controls), GSE152075 (430 SARS-CoV-2, 54 controls), and GSE156063 (93 SARS-CoV-2, 100 controls), and for the blood module in GSE171110 (44 SARS-CoV-2, 10 controls), GSE38900-GPL10558 (28 RSV, 8 controls), and GSE38900-GPL6884 (107 RSV, 31 controls). Scores are unweighted means of represented per-gene z values. The dashed line indicates AUROC = 0.5. Values are portability summaries, not clinical diagnostic estimates. Please click here to view a larger version of this figure.
Longitudinal validation tested whether scores fall during recovery
The GSE97741/GSE97742 companion datasets provided an independent natural-infection validation setting with acute and discharge samples from hospitalized children27. These samples were not used as healthy-control discovery data. They were used to assess whether anchor-derived module scores declined from acute illness to discharge.
For the prespecified combined RSV single-infection and rhinovirus group, 68 paired subjects were analysed in each tissue (Table 4; Figure 5). The blood module decreased from acute illness to discharge in blood (mean delta = 0.330; Cohen dz = 0.740; paired-test FDR = 1.98 × 10⁻7; AUROC = 0.765). The nasal module also decreased in nasopharyngeal samples (mean delta = 0.436; Cohen dz = 0.477; paired-test FDR = 3.06 × 10⁻4; AUROC = 0.679). Paired trajectories and their standard errors show that the group-level decline was not driven by a few unpaired extremes.
| Dataset | Sample source | Module | Tissue matched | n pairs | Mean acute-discharge delta | Cohen dz | AUROC | Paired-test FDR |
| GSE97741 | Blood | Blood | Yes | 68 | 0.330 | 0.740 | 0.765 | 1.98 × 10⁻⁷ |
| GSE97741 | Blood | Nasal | No | 68 | 0.479 | 0.721 | 0.755 | 3.19 × 10⁻⁷ |
| GSE97742 | Nasopharyngeal | Blood | No | 68 | 0.361 | 0.914 | 0.845 | 9.42 × 10⁻¹⁰ |
| GSE97742 | Nasopharyngeal | Nasal | Yes | 68 | 0.436 | 0.477 | 0.679 | 3.06 × 10⁻⁴ |
Table 4: Independent longitudinal acute-versus-discharge validation. The table reports the number of complete pairs, mean acute-minus-discharge score difference, Cohen dz, AUROC, and paired-test FDR for the fixed modules in GSE97741 and GSE97742. Positive delta indicates a higher module score during acute illness. Paired-test FDR values are Benjamini–Hochberg-adjusted two-sided paired t-test P values calculated across all 20 valid paired t tests in the full longitudinal output.
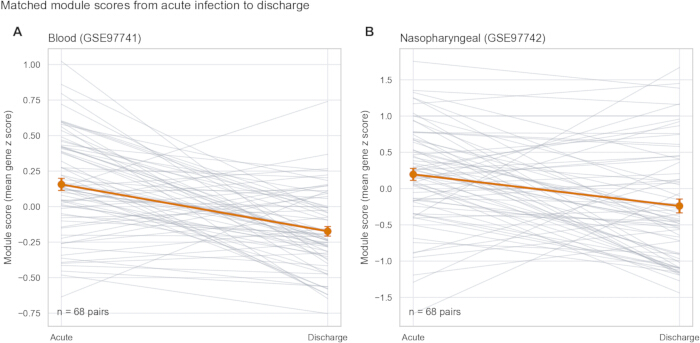
Figure 5. Paired module-score changes from acute illness to discharge. (A) Blood-module scores in whole blood (GSE97741). (B) Nasal-module scores in nasopharyngeal samples (GSE97742). Each panel contains 68 complete subject pairs: 38 RSV single infections and 30 rhinovirus infections. Thin lines connect subject-matched measurements. Orange points indicate group means, and orange error bars indicate the standard error of the mean. Two-sided paired t tests and Wilcoxon signed-rank tests were performed; Benjamini–Hochberg FDR correction was applied across the 20 valid longitudinal paired t tests. Please click here to view a larger version of this figure.
The cross-compartment tests revealed a useful nuance. The blood module applied to nasopharyngeal samples yielded an AUROC of 0.845, even though individual nasal and blood effect sizes were weakly concordant in the anchor. Inspection of paired trajectories showed a consistent score decline rather than a reversed label distribution. Thus, the result is not evidence that the same individual genes dominate both tissues. It indicates that a coordinated interferon/inflammatory program can be summarized by different but partially redundant gene sets. Compartment specificity is strongest at the gene-ranking level and is not absolute at the pathway or score level.
Held-out asymptomatic detections tested symptom-gradient behavior
Asymptomatic picornavirus detections in GSE117827 were excluded from module construction to avoid including them in the primary control group. This held-out group then provided a biological check. In both compartments, module scores increased across the ordered groups of virus-negative controls, asymptomatic picornavirus detection, and symptomatic infection (Figure 6A,B).
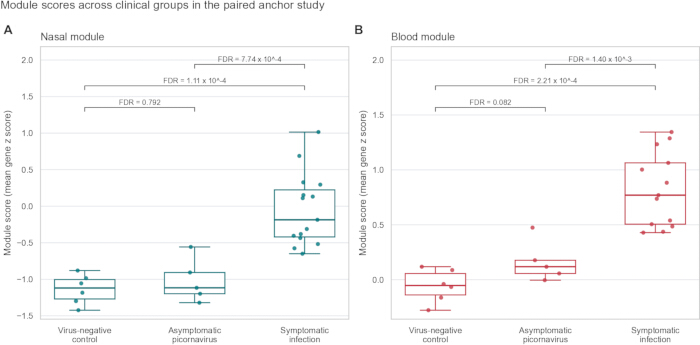
Figure 6. Module scores across the held-out symptom gradient. (A) Nasal module: 6 virus-negative controls, 5 asymptomatic picornavirus detections, and 15 symptomatic infections. (B) Blood module: 6 virus-negative controls, 5 asymptomatic picornavirus detections, and 13 symptomatic infections. Points represent individual samples. Centre lines indicate medians; boxes span the 25th to 75th percentiles; and whiskers extend to the most extreme values within 1.5 times the interquartile range. Labels report two-sided Mann–Whitney U post-hoc comparisons with Benjamini–Hochberg correction across three comparisons per compartment. Please click here to view a larger version of this figure.
The nasal module correlated with the ordinal symptom score (Spearman rho = 0.818, P = 3.28 × 10⁻7; Kruskal-Wallis P = 1.57 × 10⁻4). The blood module showed a similar gradient (rho = 0.861, P = 6.89 × 10⁻8; Kruskal-Wallis P = 1.92 × 10⁻4). After correction within each three-comparison family, symptomatic infection differed from controls and asymptomatic detections in both compartments. Asymptomatic detections did not differ from virus-negative controls (nasal FDR = 0.792; blood FDR = 0.082). The modules therefore tracked symptomatic host-response activity more clearly than viral detection alone.
Clinical benchmarks defined the boundary between host response and pathogen specificity
Clinical benchmarks defined the distinction between host-response activity and pathogen classification (Table 5; Figure 7). In GSE63990, the nasal module yielded AUROCs of 0.782 for viral versus bacterial illness and 0.791 for viral versus non-infectious illness. The blood module yielded AUROCs of 0.678 and 0.753, respectively. The Pandya 33-mRNA comparator performed better, with AUROCs of 0.867 and 0.852, respectively. This result is expected for a set designed for viral/non-viral discrimination and shows that the anchor modules should not be presented as replacement diagnostic classifiers.
| Dataset | Contrast | Anchor nasal | Anchor blood | Pandya 33 mRNA | Andres-Terre ISG | Hallmark interferon-alpha |
| GSE63990 | Viral vs bacterial | 0.782 | 0.678 | 0.867 | 0.833 | 0.831 |
| GSE63990 | Viral vs non-infectious | 0.791 | 0.753 | 0.852 | 0.851 | 0.848 |
| GSE40012 | Viral vs bacterial pneumonia | 0.755 | 0.789 | 0.893 | 0.867 | 0.872 |
| GSE40012 | Viral pneumonia vs SIRS | 0.897 | 0.907 | 0.985 | 0.965 | 0.956 |
| GSE40012 | Viral pneumonia vs healthy | 0.804 | 0.986 | 0.923 | 0.906 | 0.891 |
| GSE40012 | Bacterial pneumonia vs healthy | 0.476 | 0.917 | 0.465 | 0.391 | 0.378 |
| GSE53543 | Ex vivo rhinovirus-stimulated vs unstimulated PBMCs | 1 | 0.957 | 1 | 1 | 1 |
Table 5: AUROC benchmark for anchor modules and reference host-response sets. GSE63990 and GSE40012 are clinical whole-blood cohorts. GSE53543 is an ex vivo PBMC perturbation experiment involving 98 paired subjects and is reported separately from the natural clinical cohorts. Reference sets were scored as unweighted gene means rather than as their original weighted classifiers. AUROC values are reported as benchmarking metrics and not as estimates of clinical diagnostic performance.
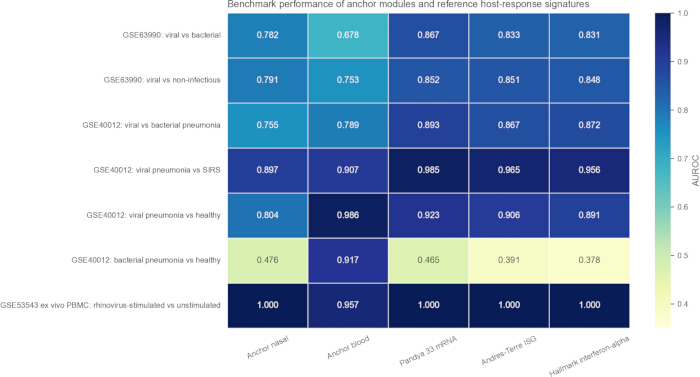
Figure 7. AUROC benchmarking of anchor modules and reference host-response sets. Rows represent prespecified contrasts in GSE63990, GSE40012, and GSE53543; columns represent the two anchor modules and three unweighted reference sets. GSE53543 is labelled as ex vivo rhinovirus-stimulated versus unstimulated PBMCs and is presented separately from the natural clinical cohorts. The Hallmark comparator is labelled Hallmark interferon-alpha. Cell values indicate AUROCs used for method benchmarking and should not be interpreted as estimates of clinical diagnostic performance. Please click here to view a larger version of this figure.
GSE40012 sharpened this boundary. The Pandya comparator reached AUROCs of 0.893 for viral versus bacterial pneumonia and 0.985 for viral pneumonia versus SIRS. The blood module separated influenza A pneumonia from healthy controls (AUROC = 0.986) and from SIRS (AUROC = 0.907), but it also separated bacterial pneumonia from healthy controls (AUROC = 0.917). The blood module therefore measures broad systemic inflammatory and interferon-associated activity. It is not virus-specific, and a high score cannot assign pathogen class.
In the separate GSE53543 ex vivo PBMC benchmark, the nasal module and interferon comparators reached an AUROC of 1.000 for rhinovirus-stimulated versus media-only PBMCs; the blood module reached an AUROC of 0.957. All 98 subjects contributed paired conditions. This controlled result supports responsiveness of the scored programs to rhinovirus stimulation. It does not estimate clinical diagnostic performance.
Robustness checks tested module size, random alternatives, and selection stability
Anchor separation remained unchanged across 10, 25, 50, 100, and 200 top-ranked genes (Figure 8A). These internal AUROCs are not external validation, but they show that the qualitative result did not depend on choosing exactly 50 genes. In 500 random 50-gene sets, null AUROC medians were 0.489 for nasal and 0.705 for blood; the corresponding 99th percentiles were 0.722 and 0.872 (Figure 8B). The observed modules exceeded these null distributions. Bootstrap selection frequencies were distributed rather than concentrated in a single invariant list (Figure 8C). This finding directly reflects the small anchor sample. It supports a stable aggregate signal while cautioning against treating every selected gene as fixed.
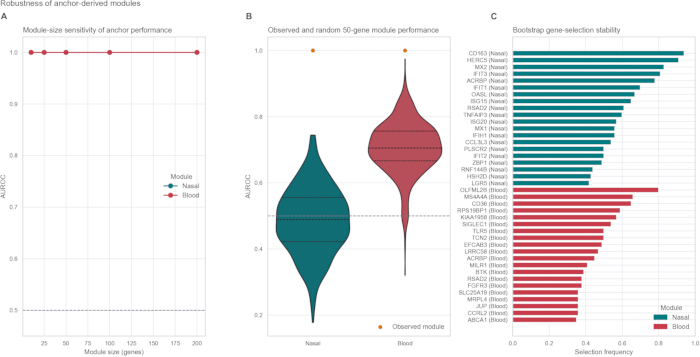
Figure 8. Module-size, random-gene, and bootstrap robustness analyses. (A) Anchor AUROC across module sizes of 10, 25, 50, 100, and 200 genes; these values represent internal sensitivity checks. (B) AUROC distributions from 500 random protein-coding 50-gene sets sampled without replacement from genes represented in GSE117827 (seed = 20260622). Orange points indicate the observed module AUROCs. Horizontal lines within each violin indicate the 25th percentile, median, and 75th percentile. (C) Bootstrap reselection was restricted to the 1,000 positive-effect protein- coding genes ranked highest in the original anchor analysis for each compartment. Bars show the 20 genes with the highest selection frequency per compartment; selection frequency was calculated as the number of selections divided by 100. Please click here to view a larger version of this figure.
Marker-program and variance analyses clarified what the scores measure
Across GSE40012, GSE53543, and GSE63990, both modules correlated most consistently with the myeloid interferon program (Figure 9A). Nasal-module correlations were 0.812, 0.878, and 0.882; blood-module correlations were 0.517, 0.843, and 0.774. Variance partitioning was descriptive (Table 6; Figure 9B). For the blood module, condition and detailed group explained more variance (eta-squared = 0.282 and 0.250, respectively) than dataset (0.066), sample type (0.026), or source group (0.025). For the nasal module, detailed group and condition also explained more variance than dataset, sample type, or source group. Biological condition and detailed group therefore accounted for larger fractions of module-score variance than dataset or sample type, although non-zero dataset and composition effects remain a limitation of bulk public-data reuse.
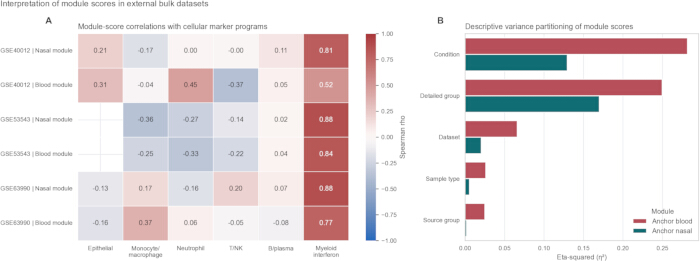
Figure 9. Marker-program correlations and descriptive variance partitioning. (A) Spearman correlations between module scores and six marker-program scores in GSE40012, GSE53543, and GSE63990. Programs required at least three represented genes. P values were adjusted across all dataset-module-program correlations. Blank cells indicate unavailable or non-estimable combinations after gene and sample requirements. (B) One-way eta-squared (η2; between-group sum of squares/total sum of squares) for condition, detailed group, dataset, sample type, and source group. The analysis included 934 blood-module and 1,469 nasal-module scores and is descriptive, not causal. Please click here to view a larger version of this figure.
| Module | Factor | Eta-squared | n samples |
| Anchor blood | Condition | 0.282 | 934 |
| Anchor blood | Detailed group | 0.25 | 934 |
| Anchor blood | Dataset | 0.066 | 934 |
| Anchor blood | Sample type | 0.026 | 934 |
| Anchor blood | Source group | 0.025 | 934 |
| Anchor nasal | Detailed group | 0.17 | 1469 |
| Anchor nasal | Condition | 0.13 | 1469 |
| Anchor nasal | Dataset | 0.021 | 1469 |
| Anchor nasal | Sample type | 0.006 | 1469 |
| Anchor nasal | Source group | 0.002 | 1469 |
Table 6: Descriptive variance partitioning of module scores. One row is provided for each module-factor pair, with the corresponding eta-squared and sample size. Eta-squared was calculated as the between-group sum of squares divided by the total sum of squares after excluding rows missing the relevant module score or factor. Factors were evaluated individually; therefore, the analysis is descriptive, does not adjust for mutually correlated factors, and should not be interpreted causally.
Data Availability:
All transcriptomic datasets analyzed in this study are publicly available from the Gene Expression Omnibus under accession numbers GSE117827, GSE41374, GSE152075, GSE156063, GSE171110, GSE38900, GSE97741, GSE97742, GSE63990, GSE40012, and GSE53543. The analysis-derived data underlying the main figures and tables and the analysis code are available from the corresponding author upon reasonable request. No restricted or newly generated participant-level data were used in this study.
Discussion
The main lesson is operational: start with the sampled compartment, not with the largest pooled matrix. GSE117827 is small, but its paired design permits a direct nasal-blood comparison within one study. The near-zero gene-level effect correlation shows that a pooled pan-tissue rank list would hide substantial compartmental structure. Separate modules were therefore the more defensible design. Their external and longitudinal performance supports reproducible host-response activity at the module level, not a universal gene list.
Gene-level and module-level portability are different. The blood module performed well in nasopharyngeal longitudinal samples (AUROC 0.845), despite weak concordance between individual nasal and blood effect sizes. The paired trajectories did not show label reversal. A more likely explanation is pathway redundancy: coordinated interferon and inflammatory activity can be summarized by different subsets of genes in different compartments6,7,8,9,10,11,32,33,34. This is why we describe the modules as compartment-aware rather than compartment-exclusive. The exact rankings differ, but a shared pathway-level component remains detectable. Bulk profiles also mix expression changes with changes in cell composition. Marker-program correlations can flag this issue, but they cannot provide cell-resolved mechanisms36,37.
The clinical benchmarks define a second boundary. The Pandya 33-mRNA and interferon comparators were stronger for viral-versus-bacterial discrimination. The anchor modules answer a different question: how strongly does a sample express an acute host-response programme? The blood module also increased in bacterial pneumonia. It should therefore be interpreted as a broad systemic inflammatory/interferon activity score, not a virus-specific classifier. A high score may support cohort comparison, response tracking, or inflammatory-state description, but it cannot identify the pathogen. The growing clinical importance of viruses such as human metapneumovirus further argues for pathogen-diverse, tissue-matched validation rather than extrapolation from a narrow virus set12,13.
The six overlap genes are exploratory. ISG15, IFIT1, RSAD2, and XAF1 have plausible interferon-linked roles32,33,34; CCRL2 is associated with inflammatory leukocyte migration35; ACRBP has no established antiviral interpretation. The small cohort and non-significant gene-wise FDR values prevent stronger claims. The methodological innovation lies elsewhere: a same-study paired anchor, locked compartment-specific modules, tissue-matched external tests, paired recovery analysis, clinical comparator benchmarking, and explicit random, size, bootstrap, marker, and variance checks. This evidence hierarchy provides a conservative framework for interpreting the results.
Several limitations remain. The anchor cohort contains only 15 infected and 6 control nasal samples and 13 infected and 6 control blood samples. Bootstrap results confirm that individual gene membership is not fully stable. Symptomatic RSV and picornavirus were combined, so anchor effects are not virus-specific. External cohorts differ in age, platform, severity, timing, and control definition. GSE53543 is an ex vivo paired perturbation study. GSE63990 and GSE40012 provide useful clinical comparators but no paired nasal-blood sampling. Viral load, symptom duration, oxygen need, and severity were not consistently available. A stronger prospective design would collect nasal swabs and blood from the same participants at matched time points, with viral-load and symptom measurements, bacterial and symptomatic virus-negative comparators, and cell-resolved validation11,14,36,37.
In conclusion, current public transcriptomes support reproducible nasal and blood host-response activity modules when tissue context is preserved. They do not support an interchangeable pan-tissue gene signature. The paired anchor showed little gene-level concordance, whereas locked module scores transferred within matched tissues and declined during recovery. The blood module’s response in bacterial pneumonia and the superior viral-versus-bacterial performance of an established classifier define the intended use: these modules describe host-response activity and support transparent cohort benchmarking; they are not stand-alone pathogen classifiers. The analysis code and derived data are available as described in the Data Availability statement to support independent verification and reuse of the workflow.
Disclosures
The authors declare no financial or non-financial conflicts of interest relevant to this work.
Acknowledgements
The authors thank the investigators and participants of the public GEO studies reanalyzed in this work. No additional individuals met the criteria for authorship. This research received no specific grant from any funding agency in the public, commercial, or not-for-profit sectors.
Materials
| Name | Company | Catalog Number | Comments |
|---|---|---|---|
| Andres-Terre multi-virus interferon-stimulated gene set | Andres-Terre et al. | 33-gene comparator; Supplementary Data 1 | Unweighted interferon-oriented comparator curated from the reported multi-virus signature; the complete gene list is provided in Supplementary Data 1. |
| Enrichr | Ma'ayan Laboratory | Accessed 18 August 2026; RRID:SCR_001575 | Gene-set over-representation resource accessed through gseapy. |
| Gene Expression Omnibus | National Center for Biotechnology Information | GEO; RRID:SCR_005012 | Public transcriptome repository used to access the analysed datasets. |
| Gene Ontology | Gene Ontology Consortium | GO Biological Process 2023; RRID:SCR_002811 | Functional annotation library used through Enrichr. |
| GPL10558 | NCBI GEO | GPL10558 | Platform for GSE53543 and the 36-sample GSE38900 validation unit. |
| GPL23126 | NCBI GEO | GPL23126 | Expression platform for GSE117827. |
| GPL24539 | NCBI GEO | Clariom_D_Human.na36.hg38. probeset.csv | Clariom D Human na36, hg38 annotation used for GSE117827 transcript-cluster mapping. |
| GPL571 | NCBI GEO | GPL571 | Platform annotation applied to GSE63990. |
| GPL6884 | NCBI GEO | GPL6884 | Platform for the 138-sample GSE38900 RSV whole-blood validation unit. |
| GPL6947 | NCBI GEO | GPL6947 | Platform annotation applied to GSE40012. |
| GSE117827 | NCBI GEO | GSE117827 | Primary paired nasal-swab and whole-blood anchor dataset. |
| GSE152075 | NCBI GEO | GSE152075 | External SARS-CoV-2 upper-airway validation dataset. |
| GSE156063 | NCBI GEO | GSE156063 | External SARS-CoV-2 upper-airway validation dataset. |
| GSE171110 | NCBI GEO | GSE171110 | External SARS-CoV-2 whole-blood validation dataset. |
| GSE38900 | NCBI GEO | GSE38900; GPL10558 and GPL6884 | External RSV whole-blood validation analysed as separately normalized 36- and 138-sample platform units. |
| GSE40012 | NCBI GEO | GSE40012 | Clinical influenza A pneumonia, bacterial pneumonia, SIRS, and healthy-control benchmark. |
| GSE41374 | NCBI GEO | GSE41374 | External RSV nasal-wash validation dataset. |
| GSE53543 | NCBI GEO | GSE53543 | Paired ex vivo PBMC rhinovirus perturbation benchmark involving 98 subjects and 196 samples. |
| GSE63990 | NCBI GEO | GSE63990 | Clinical viral, bacterial, and non-infectious whole-blood benchmark. |
| GSE97741 | NCBI GEO | GSE97741 | Longitudinal whole-blood acute-versus-discharge validation dataset. |
| GSE97742 | NCBI GEO | GSE97742 | Longitudinal nasopharyngeal acute-versus-discharge validation dataset. |
| gseapy | gseapy developers | Version 1.3.1 | Python interface used to query Enrichr. |
| HGNC gene symbol resource | HUGO Gene Nomenclature Committee | Accessed 18 August 2026; RRID:SCR_002827 | Approved gene-symbol normalization and protein-coding classification resource. |
| Matplotlib | Matplotlib development team | Version 3.11.1 | Figure generation. |
| MSigDB Hallmark gene sets | Broad Institute | Hallmark 2020; RRID:SCR_016863 | Hallmark enrichment library accessed through Enrichr. |
| MSigDB Hallmark interferon-alpha response gene set | Broad Institute | HALLMARK_INTERFERON_ALPHA_ RESPONSE; 33-gene core subset in Supplementary Data 1 | Unweighted interferon-alpha comparator; the exact subset is provided in Supplementary Data 1. |
| NumPy | NumPy developers | Version 2.5.2 | Numerical computing and seeded random sampling. |
| pandas | pandas development team | Version 3.0.5 | Tabular data processing. |
| Pandya 33-mRNA host-response gene set | Pandya et al. | Supplementary Table 1; Supplementary Data 1 | Official 33-gene set scored as an unweighted comparator. |
| Python | Python Software Foundation | Version 3.12.13 | Computational analysis environment. |
| Reactome | Reactome | Reactome 2022; RRID:SCR_003485 | Pathway enrichment library accessed through Enrichr. |
| scikit-learn | scikit-learn developers | Version 1.9.0 | AUROC and average-precision calculations. |
| SciPy | SciPy developers | Version 1.18.0 | Welch, paired t, Wilcoxon, Mann–Whitney, and correlation tests. |
| Seaborn | Seaborn development team | Version 0.13.2 | Statistical graphics. |
| statsmodels | statsmodels developers | Version 0.14.6 | Statistical utilities. |
References
- Zaas AK, et al. Gene expression signatures diagnose influenza and other symptomatic respiratory viral infections in humans. Cell Host Microbe. 2009;6(3):207-17.
- Woods CW, et al. A host transcriptional signature for presymptomatic detection of infection in humans exposed to influenza H1N1 or H3N2. PLoS One. 2013;8(1):e52198.
- Andres-Terre M, et al. Integrated, multi-cohort analysis identifies conserved transcriptional signatures across multiple respiratory viruses. Immunity. 2015;43(6):1199-211.
- Herberg JA, et al. Diagnostic test accuracy of a 2-transcript host RNA signature for discriminating bacterial vs viral infection in febrile children. JAMA. 2016;316(8):835-45.
- Pandya R, et al. A machine learning classifier using 33 host immune response mRNAs accurately distinguishes viral and non-viral acute respiratory illnesses in nasal swab samples. Genome Med. 2023;15(1):64.
- Ioannidis I, et al. Plasticity and virus specificity of the airway epithelial cell immune response during respiratory virus infection. J Virol. 2012;86(10):5422-36.
- Mejias A, et al. Whole blood gene expression profiles to assess pathogenesis and disease severity in infants with respiratory syncytial virus infection. PLoS Med. 2013;10(11):e1001549.
- Blanco-Melo D, et al. Imbalanced host response to SARS-CoV-2 drives development of COVID-19. Cell. 2020;181(5):1036-45.e9.
- Hadjadj J, et al. Impaired type I interferon activity and inflammatory responses in severe COVID-19 patients. Science. 2020;369(6504):718-24.
- Mick E, et al. Upper airway gene expression reveals suppressed immune responses to SARS-CoV-2 compared with other respiratory viruses. Nat Commun. 2020;11(1):5854.
- Yoshida M, et al. Local and systemic responses to SARS-CoV-2 infection in children and adults. Nature. 2022;602(7896):321-7.
- Jamali MC, et al. Respiratory infections by human metapneumovirus: epidemiological evidence and treatment prospects. Res J Pharm Technol. 2026;19(8):3905-12. doi:10.52711/0974-360X.2026.00549.
- Gao G, Lin R, Ma D. Human metapneumovirus: pathogenesis, epidemiology, diagnostic technologies, and potential intervention strategies. Virol J. 2025;22(1):376.
- Lim FY, et al. homeRNA self-blood collection enables high-frequency temporal profiling of presymptomatic host immune kinetics to respiratory viral infection: a prospective cohort study. EBioMedicine. 2025;112:105531.
- Johnson WE, Li C, Rabinovic A. Adjusting batch effects in microarray expression data using empirical Bayes methods. Biostatistics. 2007;8(1):118-27.
- Leek JT, et al. The sva package for removing batch effects and other unwanted variation in high-throughput experiments. Bioinformatics. 2012;28(6):882-3.
- Yu J, et al. Host gene expression in nose and blood for the diagnosis of viral respiratory infection. J Infect Dis. 2019;219(7):1151-61.
- Tsalik EL, et al. Host gene expression classifiers diagnose acute respiratory illness etiology. Sci Transl Med. 2016;8(322):322ra11.
- Parnell GP, et al. A distinct influenza infection signature in the blood transcriptome of patients with severe community-acquired pneumonia. Crit Care. 2012;16(4):R157.
- Edgar R, Domrachev M, Lash AE. Gene Expression Omnibus: NCBI gene expression and hybridization array data repository. Nucleic Acids Res. 2002;30(1):207-10.
- Barrett T, et al. NCBI GEO: archive for functional genomics data sets-update. Nucleic Acids Res. 2013;41(D1):D991-5.
- Tweedie S, et al. Genenames.org: the HGNC and VGNC resources in 2021. Nucleic Acids Res. 2021;49(D1):D939-46.
- Welch BL. The generalization of Student's problem when several different population variances are involved. Biometrika. 1947;34(1-2):28-35.
- Benjamini Y, Hochberg Y. Controlling the false discovery rate: a practical and powerful approach to multiple testing. J R Stat Soc Series B Stat Methodol. 1995;57(1):289-300.
- Subramanian A, et al. Gene set enrichment analysis: a knowledge-based approach for interpreting genome-wide expression profiles. Proc Natl Acad Sci U S A. 2005;102(43):15545-50.
- Liberzon A, et al. The Molecular Signatures Database Hallmark Gene Set Collection. Cell Syst. 2015;1(6):417-25.
- Do LAH, et al. Host transcription profile in nasal epithelium and whole blood of hospitalized children under 2 years of age with respiratory syncytial virus infection. J Infect Dis. 2018;217(1):134-46.
- Ashburner M, et al. Gene Ontology: tool for the unification of biology. Nat Genet. 2000;25(1):25-9.
- The Gene Ontology Consortium. The Gene Ontology resource: enriching a GOld mine. Nucleic Acids Res. 2021;49(D1):D325-34.
- Gillespie M, et al. The Reactome pathway knowledgebase 2022. Nucleic Acids Res. 2022;50(D1):D687-92.
- Kuleshov MV, et al. Enrichr: a comprehensive gene set enrichment analysis web server 2016 update. Nucleic Acids Res. 2016;44(W1):W90-7.
- Schoggins JW, et al. A diverse range of gene products are effectors of the type I interferon antiviral response. Nature. 2011;472(7344):481-5.
- Schneider WM, Chevillotte MD, Rice CM. Interferon-stimulated genes: a complex web of host defenses. Annu Rev Immunol. 2014;32:513-45.
- Perng YC, Lenschow DJ. ISG15 in antiviral immunity and beyond. Nat Rev Microbiol. 2018;16(7):423-39.
- Schioppa T, et al. Molecular basis for CCRL2 regulation of leukocyte migration. Front Cell Dev Biol. 2020;8:615031.
- Avila Cobos F, et al. Benchmarking of cell type deconvolution pipelines for transcriptomics data. Nat Commun. 2020;11(1):5650.
- Maden SK, et al. Challenges and opportunities to computationally deconvolve heterogeneous tissue with varying cell sizes using single-cell RNA-sequencing datasets. Genome Biol. 2023;24(1):288.