A steady-state model of a 100 kW recuperated micro gas turbine generated performance maps and identified favorable operating states. Load-specific optimization increased thermal efficiency by up to 11.5% and reduced specific fuel consumption by up to 6.9% within prescribed constraints.
Research Article
Performance Evaluation and Operational Optimization of Micro Gas Turbine Systems for Engineering Applications
In This Article
Summary
Abstract
This study evaluated the performance and operational optimization of a recuperated 100 kW micro gas turbine intended for distributed generation applications. A steady-state thermodynamic model was developed and benchmarked at the design point against published manufacturer specifications for a representative 100 kW recuperated micro gas turbine. One- and two-dimensional performance maps were generated to identify high-efficiency operating regions and associated trends in specific fuel consumption. The model produced thermodynamically consistent design-point and off-design trends, with a thermal efficiency of approximately 31% and a specific fuel consumption of 0.27 kg/kWh at nominal conditions. Parametric analyses showed that turbine inlet temperature and recuperator effectiveness had the strongest positive influence on efficiency, whereas increasing ambient temperature reduced both efficiency and net power. Two-dimensional maps of efficiency as a function of compressor pressure ratio and turbine inlet temperature revealed a distinct high-efficiency ridge, with the minimum specific fuel consumption region closely aligned with this ridge. Load-specific optimization was then performed over the steady-state operating envelope, parameterized by the compressor pressure ratio and turbine inlet temperature, for three representative load cases. The selected operating points achieved efficiency gains of approximately 6.5%–11.5% and specific fuel consumption reductions of approximately 3.7%–6.9% relative to baseline operation. Within the prescribed steady-state model and feasibility bounds, the selected operating-state combinations were associated with improved predicted thermal efficiency and specific fuel consumption relative to the corresponding baseline cases. These results provide model-based screening guidance and require calibration and validation before use as physical operating or control setpoints.
Introduction
Micro gas turbines have attracted growing attention as a technology for distributed generation, combined heat and power, and small-scale energy conversion because of their compact structure, fuel flexibility, relatively low emissions, and suitability for decentralized energy systems. The increasing need for efficient and reliable small-scale power systems has further strengthened interest in micro gas turbine applications, particularly under operating conditions where flexibility, thermal efficiency, and stable off-design performance are important. Compared with conventional small prime movers, micro gas turbines offer several practical advantages, including lower maintenance requirements, smoother operation, and compatibility with advanced energy systems and hybrid configurations1,2. These characteristics support continued investigation of micro gas turbine performance and operational efficiency.
Existing research has established a basis for understanding the thermodynamic behavior and application potential of micro gas turbine systems. Review studies have examined their use in distributed generation, waste heat recovery, cogeneration, and hybrid energy systems, where operational flexibility provides an important advantage3. Thermodynamic investigations have shown that efficiency, specific fuel consumption, and power output are strongly influenced by pressure ratio, turbine inlet temperature, recuperator effectiveness, and part-load operating conditions4. Numerical and physics-based models have also been used to describe design and off-design performance and to evaluate the effects of component behavior, ambient conditions, and control settings on system response. Other studies have examined dynamic modelling and control strategies for operation under changing loads, with coordinated regulation of temperature, rotational speed, and fuel flow identified as important considerations5,6,7.
Previous optimization studies have used different objectives, decision variables, and levels of model fidelity8,9,10,11,12. De Paepe et al. optimized a Turbec T100 micro gas turbine using turbine outlet temperature and rotational speed as decision variables and obtained a multi-objective trade-off between electrical power and efficiency9. The reported maximum electrical efficiency was 31.5%, whereas the maximum electrical power of 141.3 kWe occurred at a lower efficiency of 29.7%9. That model incorporated component maps and recuperator pressure-loss behavior and was intended as a basis for subsequent robust-design analysis9. In contrast, the present study applies a fixed-parameter, steady-state screening model to a representative 100 kW recuperated micro gas turbine, evaluates three prescribed load factors, and selects the maximum-efficiency feasible state within a bounded two-dimensional grid. The workflow does not claim superior physical fidelity or a more advanced optimization algorithm; its contribution is the explicit and reproducible linkage of performance mapping, feasibility screening, and load-specific operating-state selection for offline engineering assessment.
Despite these advances, thermodynamic performance analysis, operational control, and optimization are often treated as separate tasks. Thermodynamic and numerical models are commonly used to examine parameter trends or individual operating conditions, whereas optimization studies may focus on particular design points, larger gas turbine systems, or restricted decision-variable sets8,9,10,11. For a representative recuperated micro gas turbine, practical value remains in a transparent procedure that links steady-state performance calculation, feasibility screening, performance-map generation, and load-specific selection of favorable operating states. The present work considers a single-shaft, recuperated 100 kW-class micro gas turbine operating with a conventional gaseous fuel and assumes steady-state behavior at each operating point. Dynamic behavior and component degradation are outside the present scope.
Micro gas turbines used in distributed-generation and small-scale energy systems operate under variable load demands and off-design conditions that can influence efficiency, fuel use, and available power. A structured evaluation of the prescribed thermodynamic feasibility envelope can support offline engineering assessment of how prescribed operating conditions affect predicted performance. The study therefore aimed to identify model-based steady-state operating states associated with improved thermal efficiency and specific fuel consumption within prescribed thermodynamic feasibility bounds.
Feasibility denotes compliance with the prescribed steady-state thermodynamic bounds and physical-screening conditions. Candidate states were retained only when the compressor pressure-ratio operating-state value, turbine inlet temperature, load factor, ambient condition, and recuperator effectiveness remained within the stated ranges; net power was positive; calculated quantities were finite; and component-temperature relations, including recuperator temperature ordering, remained physically meaningful. This definition does not constitute a complete physical operability assessment of a commercial micro gas turbine. Compressor surge and choke margins, shaft-speed and actuator limits, emissions, component durability, degradation, transient behavior, and site-specific control constraints were outside the present scope. Despite these advances, thermodynamic performance analysis, operational control, optimization, and component-level assessment are often treated as separate tasks13.
The study does not introduce a new thermodynamic cycle model, component model, or optimization algorithm. The contribution is a transparent and reproducible computational workflow that links steady-state performance mapping, physical feasibility screening, and load-specific selection of high-efficiency candidate states within prescribed thermodynamic bounds. The workflow applies established steady-state Brayton-cycle relations and deterministic exhaustive grid enumeration to a representative 100 kW recuperated micro gas turbine. It is intended for offline engineering assessment in distributed-generation, combined-heat-and-power, and microgrid-planning applications and for future extension using component maps, dynamic models, and measured data.
Protocol
This study involved computational modelling and analysis only and did not involve human participants, human-derived materials, animals, or identifiable personal data. Therefore, institutional ethics approval and informed consent were not required. The tools used in this protocol are listed in the Table of Materials.
1. Overall study design
The computational workflow was designed to assess the steady-state performance of a representative recuperated micro gas turbine and to identify favorable operating states under prescribed load conditions. The workflow comprised definition of component, environmental, fuel, and operating-bound inputs; calculation of thermodynamic states and performance indicators for each candidate operating point; physical-feasibility screening; generation of one- and two-dimensional performance maps; load-specific deterministic grid-search evaluation; and sensitivity analysis. Selected operating states were compared with the corresponding baseline conditions, and their responses to variations in ambient temperature and recuperator effectiveness were subsequently evaluated. The overall computational workflow is summarized schematically in Figure 1.
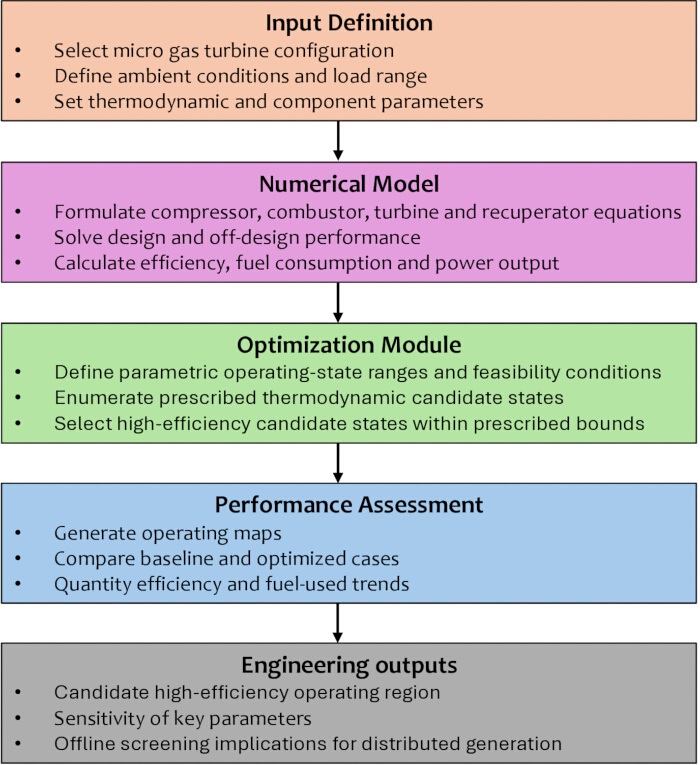
Figure 1: Overall schematic of the numerical performance evaluation and operational optimization workflow for a micro gas turbine system. The workflow proceeds from definition of the micro gas turbine configuration and operating inputs through thermodynamic numerical modelling and parametric performance evaluation to an operational optimization module that evaluates the feasible operating domain. Selected operating points are subsequently compared with baseline performance maps to quantify changes in thermal efficiency, specific fuel consumption, and net power output under the evaluated distributed-generation operating conditions. Please click here to view a larger version of this figure.
The model inputs included ambient temperature, ambient pressure, component efficiencies, fuel lower heating value, recuperator effectiveness, compressor pressure ratio, turbine inlet temperature, and load factor. Admissible ranges and discrete increments were prescribed for compressor pressure ratio, turbine inlet temperature, load factor, ambient temperature, and recuperator effectiveness. These quantities defined the operating domain used for performance mapping, feasibility screening, deterministic grid-search evaluation, and sensitivity analysis.
For each candidate operating point, the compressor outlet temperature and compressor specific work were calculated from the prescribed inlet condition and compressor pressure ratio. The turbine outlet state and turbine specific work were then determined from the prescribed turbine inlet temperature, expansion ratio, and turbine isentropic efficiency. The recuperator outlet temperature was calculated using the prescribed recuperator effectiveness and turbine exhaust temperature, followed by determination of the fuel-to-air ratio from the combustor energy balance. Net specific work, thermal efficiency, net power, and specific fuel consumption were subsequently calculated. Candidate states that violated the prescribed parameter bounds, yielded non-positive net power, produced non-physical temperature relations, or contained undefined numerical outputs were excluded. Physically feasible states were retained for performance-map generation and deterministic grid-search evaluation.
Baseline performance maps were generated by varying individual model inputs to construct one-dimensional response curves and by varying compressor pressure ratio and turbine inlet temperature simultaneously to construct two-dimensional thermal-efficiency and specific-fuel-consumption maps. The evaluated inputs and calculated performance indicators were retained in tabular form for plotting and subsequent comparison. Load-specific deterministic grid searches were performed independently at load factors of 1.00, 0.80, and 0.60 for Cases A, B, and C, respectively. All prescribed compressor-pressure-ratio and turbine-inlet-temperature combinations were evaluated within each load-specific grid. The feasible state with the maximum thermal efficiency was selected for each load case, while specific fuel consumption and net power were retained as associated performance outcomes. Sensitivity analysis was then conducted by repeating the baseline and selected-state calculations at prescribed ambient temperatures and recuperator-effectiveness values.
2. System definition and modelling assumptions
A representative recuperated micro gas turbine configuration was selected for the numerical analysis because recuperated architectures are widely used in small-scale distributed generation and provide a suitable basis for evaluating performance enhancement through operational optimization. The model included the principal cycle components: compressor, combustor, turbine, recuperator, and generator-equivalent output block. The working fluid was treated as an ideal gas mixture, with thermophysical behavior represented using standard gas turbine thermodynamic relations. Pressure losses and component efficiencies were introduced as prescribed input parameters.
The baseline operating domain was defined using ambient temperature, compressor pressure ratio, turbine inlet temperature, recuperator effectiveness, and load fraction as the primary independent variables. The system was assumed to operate at steady state at each simulated condition, and the numerical framework evaluated a sequence of steady operating points across the prescribed parameter space. Transient behavior, fuel-composition variation, and degradation effects were not included.
3. Design-point benchmarking against manufacturer specifications
The model was not validated against independently measured experimental data. Instead, the design-point outputs were benchmarked against published manufacturer specifications for the representative 100 kW recuperated micro gas turbine reported in the AE-T100 data sheet15. The comparison included the available rated operating information, including nominal net power, compressor pressure ratio, turbine inlet temperature, thermal efficiency, specific fuel consumption, and turbine exhaust temperature where reported. The benchmarking was used to assess whether the model reproduced the expected design-point magnitude and thermodynamic behavior of the reference unit. The comparison therefore represents agreement with manufacturer-reported specifications rather than experimental validation.
4. Computational implementation, solver settings, and convergence criteria
The computational workflow was implemented in Python 3.13.0 using NumPy 2.4.0 for numerical-array operations, SciPy 1.16 for scientific numerical routines, and Matplotlib 3.10.5 for post-processing and visualization of the calculated performance data. The implementation comprised six principal stages: input definition and parameter-bound assignment, thermodynamic-state calculation, physical-feasibility screening, parametric performance mapping, load-specific deterministic grid-search evaluation, and sensitivity analysis. Each candidate operating point was defined by ambient temperature, ambient pressure, compressor pressure-ratio operating-state value, turbine inlet temperature, load factor, recuperator effectiveness, component efficiencies, combustion efficiency, fuel lower heating value, and the remaining prescribed model parameters.
The steady-state model was evaluated sequentially for each candidate operating point. Compressor outlet temperature and compressor specific work were determined first. Turbine outlet temperature and turbine specific work were then calculated from the specified turbine inlet temperature, pressure ratio, and turbine isentropic efficiency. The recuperator air-side outlet temperature was subsequently calculated from the prescribed recuperator effectiveness and turbine exhaust temperature. The combustor energy balance was then used to determine the fuel-to-air ratio, followed by calculation of net specific work, net power, thermal efficiency, and specific fuel consumption. Because the prescribed-effectiveness thermodynamic model was evaluated using direct sequential algebraic relations, no iterative nonlinear solver was required and no residual-based convergence tolerance was applicable.
Physical-feasibility screening was applied to each evaluated operating point. Candidate states were excluded when a prescribed operating bound was violated, net power was non-positive, recuperator temperature ordering was non-physical, or calculated values were undefined or non-finite. Input parameters and calculated outputs for retained states were stored in a tabular dataset used for one- and two-dimensional performance mapping and comparison of baseline and selected operating states.
5. Computational workflow and data organization
The numerical implementation used a structured parameter dictionary containing thermodynamic constants, component efficiencies, ambient conditions, fuel properties, recuperator effectiveness, nominal system rating, load factor, and allowable bounds for compressor pressure ratio and turbine inlet temperature. Candidate operating grids were generated from arrays of compressor pressure ratio and turbine inlet temperature. For each prescribed load factor, every pressure-ratio–temperature combination in the discrete search domain was evaluated without adaptive search or early stopping.
For each candidate state, the calculated quantities included compressor outlet temperature and specific work, turbine expansion temperature and specific work, recuperator outlet temperature, fuel-to-air ratio, turbine and compressor mass-flow requirements, net specific work, fuel flow, net power, thermal efficiency, and specific fuel consumption. Each evaluated state was stored as an individual row in a tabular results structure. Stored fields included load factor, compressor pressure ratio, turbine inlet temperature, component outlet temperatures, compressor and turbine specific work, net specific work, air mass flow rate, fuel mass flow rate, net power, thermal efficiency, specific fuel consumption, and feasibility status.
Feasibility screening was applied after calculation of each candidate state. States that violated the prescribed pressure-ratio or turbine-inlet-temperature bounds, yielded non-positive net power, resulted in non-physical temperatures, or violated the recuperator temperature-ordering condition were excluded. The remaining feasible states were retained for performance mapping and load-specific selection. For each load case, the feasible candidate with the maximum thermal efficiency was identified, and the corresponding operating variables and performance indicators were reported.
The primary deterministic grid evaluated compressor pressure ratios from 3.00 to 5.00 in increments of 0.05 and turbine inlet temperatures from 850 to 1000 °C in increments of 5 °C. The resulting grid contained 41 pressure-ratio values and 31 turbine-inlet-temperature values, corresponding to 1,271 candidate states per load case. Three load factors of 1.00, 0.80, and 0.60 were evaluated, yielding 3,813 primary candidate states before feasibility screening. The objective was to maximize thermal efficiency among the retained feasible states. A dictionary-based parameter structure, NumPy arrays for candidate-grid generation and numerical operations, and a tabular results structure were used to retain candidate-state values and feasibility flags.
6. Thermodynamic formulation
The compressor outlet state was established from the specified inlet condition and compressor pressure ratio. The compressor outlet temperature was determined from the isentropic relation corrected by compressor isentropic efficiency according to Equation (1)16:
T2 = T1[1 + ηcπc (γ - 1)/γ - 1]
where (T1) and (T2) are the compressor inlet and outlet temperatures, respectively, (πc) is the compressor pressure ratio, (γ) is the specific heat ratio, and (ηc) is the compressor isentropic efficiency.
The compressor specific work was then calculated from Equation (2):
wc = cp(T2 - T1)
where cp is the specific heat at constant pressure.
The recuperator outlet temperature on the compressed air side was evaluated from the prescribed recuperator effectiveness using Equation (3)17:
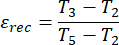
where εrec is the recuperator effectiveness, T3 is the preheated air temperature entering the combustor, and T5 is the turbine exhaust temperature entering the recuperator hot side.
The combustor energy balance was used to determine the required fuel input for the target turbine inlet temperature. The fuel-to-air ratio was obtained from Equation (4)18,19,20,21:
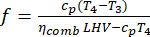
where f is the fuel-to-air ratio, T4 is the turbine inlet temperature, ηcomb is the combustion efficiency, and LHV is the lower heating value of the fuel.
The turbine outlet temperature was determined from the turbine expansion relation corrected by turbine isentropic efficiency according to Equation (5)18,19,20,21:

where nt is the turbine isentropic efficiency and πt is the turbine expansion ratio.
The turbine specific work and net cycle specific work were then calculated from Equations (6) and (7)18,19,20,21:


The thermal efficiency was evaluated from Equation (8)14,17:
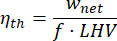
and the specific fuel consumption was computed from Equation (9)22:

where  is fuel mass flow rate and Pnet is net power output.
The governing thermodynamic relations were evaluated sequentially for each candidate operating point using direct algebraic calculations. Because component efficiencies, recuperator effectiveness, pressure losses, and operating inputs were prescribed, no iterative nonlinear solver or residual-based convergence criterion was required. Numerical validity was assessed through feasibility screening, including checks for finite numerical outputs, positive net power, physically meaningful temperatures and mass-flow rates, and valid recuperator temperature ordering19,20,21,22,23,24.
7. Code implementation
The numerical workflow comprised thermodynamic-state calculation, parametric performance mapping, deterministic grid-search evaluation, feasibility screening, and storage of calculated operating states. Baseline environmental and component inputs were specified before execution, including ambient temperature and pressure, compressor and turbine isentropic efficiencies, combustor efficiency, fuel lower heating value, recuperator effectiveness, compressor pressure ratio, turbine inlet temperature, and load factor.
The compressor relation was evaluated first, followed by the turbine expansion relation, the recuperator relation, the combustor energy balance, and the performance equations. The resulting state variables and performance indicators were retained for every feasible operating point in a tabular output dataset used for performance-map generation and comparison of baseline and selected operating states. Candidate points that violated prescribed bounds, yielded non-positive net power, produced non-physical recuperator temperature ordering, or generated undefined or non-finite numerical outputs were excluded. The retained operating points were subsequently used to generate thermal-efficiency and specific-fuel-consumption maps and to identify high-efficiency feasible states for each load case.
8. Deterministic grid-search optimization
A deterministic exhaustive grid-search screening procedure was used to identify high-efficiency steady-state candidate states within the prescribed thermodynamic feasibility bounds. Independent evaluations were conducted at load factors (LF) of 1.00, 0.80, and 0.60. Compressor pressure-ratio operating state, (πc), and turbine inlet temperature, (T4), were evaluated over the prescribed discrete domain. For the fixed-hardware micro gas turbine, (πc) was treated as a parametric proxy for the operating state rather than as an independently actuated physical control variable. It represented pressure-ratio states associated with coupled changes in shaft rotational speed, mass flow rate, fuel scheduling, and compressor–turbine matching.
For each load case, (πc) was evaluated from 3.00 to 5.00 in increments of 0.05, while (T4) was evaluated from 850 to 1000 °C in increments of 5 °C. The resulting grid contained 41 pressure-ratio values and 31 turbine-inlet-temperature values, corresponding to 1,271 candidate states per load case and 3,813 candidate states across the three reported load cases before feasibility screening. Ambient temperature and recuperator effectiveness were maintained at their reference values during the primary grid-search calculations and were varied separately during sensitivity analysis. Recuperator effectiveness was therefore treated as a prescribed model parameter rather than as a resolved off-design heat-exchanger characteristic or independently adjustable control variable.
At each candidate state, the steady-state model calculated compressor and turbine thermodynamic states, recuperator outlet temperature, fuel-to-air ratio, air and fuel mass-flow rates, net electrical power, thermal efficiency, specific fuel consumption, and turbine exhaust temperature. Candidate states were retained only when the specified parameter bounds were satisfied, net electrical power was positive, calculated outputs were finite, and temperature, mass-flow, and recuperator-ordering conditions remained physically meaningful.
The primary selection criterion was maximum thermal efficiency among the retained feasible candidates:
maxηth(πc, T4)
Specific fuel consumption was retained as an associated performance indicator and was used as the first tie-breaker when candidate states had equal thermal efficiency at the reported numerical precision. If a tie remained, the candidate with the lower turbine inlet temperature was selected. Exhaustive enumeration was performed without stochastic sampling, adaptive refinement, gradient-based optimization, heuristic optimization, initialization dependence, or early stopping. Each load-specific grid search was completed only after all 1,271 discrete candidate states had been evaluated and screened.
The prescribed-effectiveness model was evaluated through direct sequential algebraic calculations and therefore did not require an iterative nonlinear solver or residual-based convergence tolerance. Numerical validity was assessed through the prescribed feasibility-screening criteria. The selected candidate states represent model-based steady-state screening results within the prescribed assumptions and do not constitute experimentally validated or directly deployable operational-control setpoints.
Grid-resolution verification was performed to assess the adequacy of the primary discretization. A refined local grid centered on each selected primary-grid state used increments of 0.01 in (πc) and 1 °C in (T4), within ±0.10 in (πc) and ±10 °C in (T4). The maximum thermal efficiency obtained from the refined grid differed from the corresponding primary-grid result by no more than 0.05 percentage points. The selected (πc) and (T4) values remained within 0.03 and 2 °C, respectively, of the corresponding primary-grid values. This verification assessed the adequacy of the primary grid for identifying the local maximum-efficiency region within the prescribed discrete screening domain and did not establish a continuous-space global optimum.
9. Data processing and performance mapping
The calculated results were post-processed to generate operating maps and response surfaces describing the influence of the prescribed operating variables on micro gas turbine performance. Thermal efficiency, net power output, and specific fuel consumption were evaluated as functions of turbine inlet temperature, compressor pressure ratio, and load factor. The selected high-efficiency candidate states were superimposed on the baseline performance maps to indicate their locations within the modeled performance region25. Contour plots and heat maps were generated for thermal efficiency and specific fuel consumption, while line plots were used to compare baseline and selected trajectories as functions of load and power26.
The calculated outputs were examined for internal consistency by assessing the expected increase in compressor work with pressure ratio, the dependence of recuperated-cycle efficiency on turbine exhaust temperature, and the sensitivity of part-load performance to the prescribed operating parameters. Where available, calculated trends were also qualitatively cross-checked against published performance data and modeling studies to assess consistency with prior work.
Results
The numerical results are presented in a progressive sequence, beginning with baseline model behavior, followed by the effects of the primary operating variables, the structure of the two-dimensional performance maps, the performance gains obtained through operational optimization, and the sensitivity of the selected operating states to variations in ambient temperature and recuperator effectiveness. This sequence links design-point benchmarking with identification of favorable operating regions and subsequent load-specific operating-state selection.
Baseline operating characteristics and design-point benchmarking
Baseline design-point performance was evaluated by benchmarking the model outputs against published manufacturer specifications for the representative 100 kW recuperated micro gas turbine15. Baseline input parameters and principal model outputs are summarized in Table 1, including a nominal net power of 100 kW, compressor pressure ratio of 4.0, turbine inlet temperature of 950 °C, recuperator effectiveness of 0.85, and compressor and turbine isentropic efficiencies of 0.80 and 0.85, respectively. Under these prescribed conditions, the model predicted a thermal efficiency of 0.31 and a specific fuel consumption of 0.27 kg/kWh. These values were consistent in magnitude with the published manufacturer specifications and reported performance ranges for commercial micro gas turbines in the same power class. This comparison represents design-point benchmarking against manufacturer-reported information rather than validation against independently measured experimental data.
| Parameter | Manufacturer specification | Model prediction | Difference |
| Net electrical power | 100 ± 3 kWel | 100 kWel | 0.0% versus nominal |
| Electrical efficiency | 30 ± 2% | 0.31 | +1 percentage point; +3.3% relative |
| Fuel thermal input | 333 kWth | 322.6 kWth | −3.1% |
| Turbine inlet temperature | 950 °C | 950 °C | 0 |
| *Implied model fuel thermal input calculated as Pnet/ηth |
Table 1: Quantitative design-point comparison between model predictions and published manufacturer specifications for the representative AE-T100 natural-gas micro gas turbine. Manufacturer specifications are from the AE-T100 data sheet15. The comparison is limited to rated design-point quantities available in the datasheet and does not represent experimental or off-design validation.
Comparable manufacturer or independently measured off-design data for the 80% and 60% load cases were not available in the manufacturer documentation15. Consequently, quantitative off-design validation could not be performed. The off-design results should therefore be interpreted as model-based parametric predictions requiring future calibration and validation using measured load-dependent data, including net power, fuel flow, exhaust temperature, shaft speed, and component operating maps.
The variation in net power output and thermal efficiency with load factor was evaluated at the baseline ambient condition, compressor pressure ratio, turbine inlet temperature, and recuperator effectiveness. As shown in Figure 2, thermal efficiency, ηth, increased from approximately 0.24 at LF = 0.40 to 0.31 at LF = 1.00, while net electrical power, Pnet, increased approximately linearly from 40 kWel to 100 kWel over the same range. The lower efficiency at reduced load factors represents a part-load efficiency penalty in the present steady-state model and serves as the baseline reference for subsequent parametric and operating-state analyses.
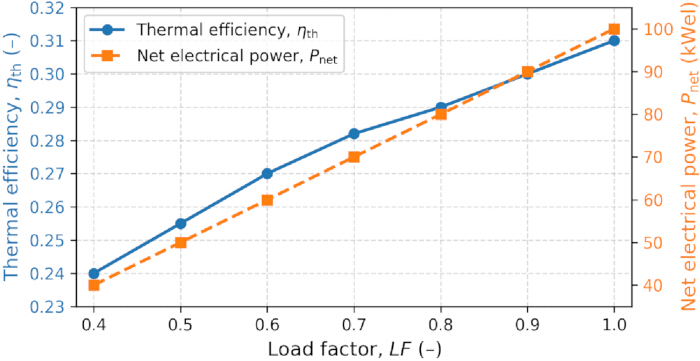
Figure 2: Thermal efficiency, ηth , is shown on the left vertical axis, and net electrical power, Pnet, is shown on the right vertical axis. Both quantities were calculated under the reference ambient conditions, the compressor pressure-ratio operating state, the turbine inlet temperature, and the recuperator effectiveness. Net electrical power increased approximately linearly with load factor, whereas thermal efficiency showed a nonlinear part-load reduction within the present steady-state model. Markers denote discrete deterministic model evaluations, and connecting lines are included to guide visualization. Error bars are not applicable because the plotted values are deterministic model outputs rather than replicated experimental measurements. Please click here to view a larger version of this figure.
Quantitative design-point benchmarking is presented in Table 1. The model predicted a net electrical output of 100 kW, matching the nominal AE-T100 datasheet value of 100 kW and remaining within the stated specification range of 100 ± 3 kW. The predicted electrical efficiency was 31%, compared with the reported value of 30 ± 2%, corresponding to an absolute difference of 1 percentage point and a relative difference of 3.3% from the nominal value. The implied model fuel thermal input was 322.6 kW, calculated from the predicted net power and thermal efficiency, compared with the reported value of 333 kW, giving a relative difference of −3.1%. The prescribed turbine inlet temperature of 950 °C matched the datasheet value. These comparisons are consistent with the manufacturer's available specifications for rated conditions and do not constitute experimental validation.
The part-load trend showed that the reduction in thermal efficiency was proportionally greater than the reduction in net power output. Within the prescribed model, this behavior was associated with reduced component matching quality and less favorable recuperator temperature differentials as load decreased. The baseline response therefore provided the reference condition for evaluating the effects of the primary operating variables and the performance changes associated with the selected operating states.
Effect of primary operating variables
The effects of the principal operating parameters were examined through one-dimensional parametric sweeps. The ranges used for turbine inlet temperature, compressor pressure ratio, load factor, recuperator effectiveness, and ambient temperature are summarized in Table 2. These ranges defined the prescribed parameter domain used to evaluate the principal influences on predicted micro gas turbine performance.
| Parameter | Symbol | Minimum | Maximum | Grid increment | Role |
| Compressor pressure ratio | πc | 3 | 5 | 0.05 | Parametric operating-state variable |
| Turbine inlet temperature | T4 | 850 °C | 1000 °C | 5 °C | Parametric operating-state variable |
| Load factor | LF | 0.4 | 1 | 0.05 | Performance mapping; fixed at 1.00, 0.80, and 0.60 during case-specific optimisation |
| Recuperator effectiveness | εrec | 0.75 | 0.9 | 0.01 | Sensitivity analysis |
| Ambient temperature | Tamb | 273 K | 313 K | 5 K | Sensitivity analysis |
Table 2: Parameter ranges used for baseline performance-map generation. Compressor pressure ratio and turbine inlet temperature were used as the primary parametric operating-state variables in the load-specific search. Load factor, ambient temperature, and recuperator effectiveness were used for performance mapping and sensitivity analyses. Grid increments and prescribed values for each reported case are specified in the table.
Figure 3 shows the influence of turbine inlet temperature on thermal efficiency and specific fuel consumption at a constant compressor pressure ratio. As turbine inlet temperature increased from 850 °C to 1000 °C, thermal efficiency increased from approximately 0.27 to 0.32, whereas specific fuel consumption decreased from approximately 0.30 to 0.25 kg/kWh. Within the evaluated range, increasing turbine inlet temperature was therefore associated with higher predicted thermal efficiency and lower predicted specific fuel consumption.
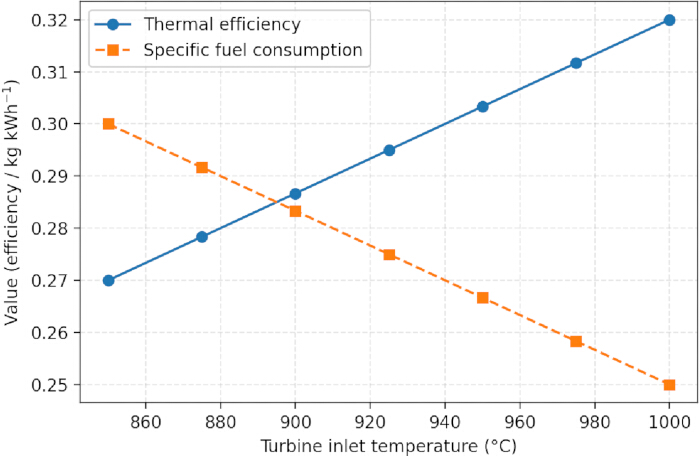
Figure 3: Thermal efficiency and specific fuel consumption as functions of turbine inlet temperature at fixed compressor pressure ratio and ambient conditions. Thermal efficiency and specific fuel consumption are shown as functions of turbine inlet temperature at constant compressor pressure ratio, recuperator effectiveness, and ambient conditions. Increasing turbine inlet temperature from 850 to 1000 °C increases predicted thermal efficiency and reduces predicted specific fuel consumption within the examined operating range. Please click here to view a larger version of this figure.
The effect of recuperator effectiveness was evaluated while the remaining model parameters were held constant. Figure 4 shows the variation in thermal efficiency and turbine exhaust temperature with recuperator effectiveness. Increasing recuperator effectiveness from 0.75 to 0.90 increased thermal efficiency from approximately 0.26 to 0.32, while turbine exhaust temperature decreased from approximately 450 °C to 370 °C. The slope of the efficiency-effectiveness relationship decreased at higher effectiveness values, indicating progressively smaller increments in predicted efficiency over the upper part of the evaluated range.
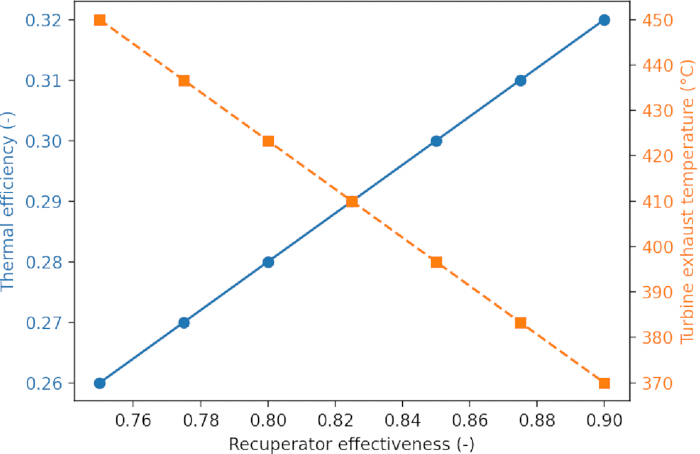
Figure 4: Thermal efficiency and turbine exhaust temperature as functions of recuperator effectiveness at baseline compressor pressure ratio and turbine inlet temperature. Thermal efficiency is shown on the left vertical axis, and turbine exhaust temperature is shown on the right vertical axis. Both quantities are plotted as functions of recuperator effectiveness at baseline compressor pressure ratio, turbine inlet temperature, and ambient conditions. Increasing recuperator effectiveness increases predicted thermal efficiency while reducing turbine exhaust temperature, with progressively smaller efficiency changes at higher effectiveness values. Please click here to view a larger version of this figure.
Ambient-temperature effects were evaluated across inlet temperatures from 273 to 313 K. Figure 5 shows the variation in net power and thermal efficiency with ambient temperature at fixed compressor pressure ratio, turbine inlet temperature, load factor, and recuperator effectiveness. As the ambient temperature increased from 273 to 313 K, the net power decreased from approximately 104 to 88 kW, and the thermal efficiency decreased from approximately 0.32 to 0.30. These results show that increasing ambient temperature reduced both predicted net power and thermal efficiency within the evaluated range.
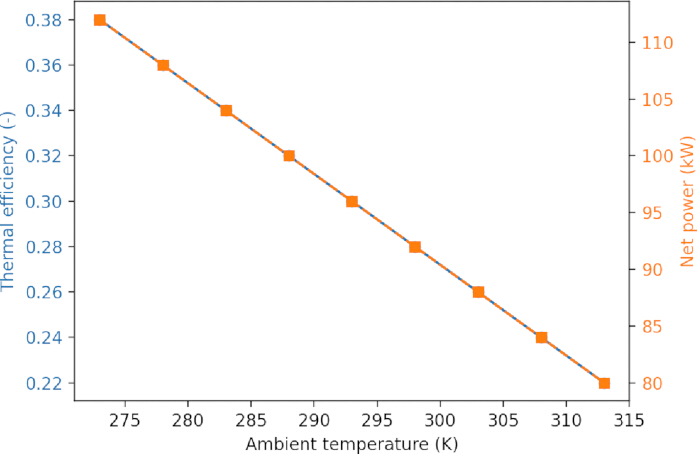
Figure 5: Thermal efficiency and net power output as functions of ambient temperature at fixed compressor pressure ratio, turbine inlet temperature, and load factor. Thermal efficiency is shown on the left vertical axis, and net power output is shown on the right vertical axis. Both quantities are plotted as functions of ambient temperature at fixed compressor pressure ratio, turbine inlet temperature, load factor, and recuperator effectiveness. Increasing ambient temperature from 273 to 313 K reduces predicted net power and thermal efficiency within the evaluated range. Please click here to view a larger version of this figure.
Across the one-dimensional parameter sweeps, turbine inlet temperature and recuperator effectiveness produced the largest positive changes in predicted thermal efficiency, whereas increasing ambient temperature reduced both net power and thermal efficiency. These trends provided the basis for interpreting the two-dimensional performance maps.
Two-dimensional performance maps
Two-dimensional performance maps were generated to evaluate the combined effects of compressor pressure ratio and turbine inlet temperature on thermal efficiency and specific fuel consumption. Figure 6 presents the thermal-efficiency contour map at fixed recuperator effectiveness and ambient conditions. A high-efficiency region was centered near a compressor pressure ratio of approximately 4.0 and elevated turbine inlet temperatures. At lower pressure ratios, predicted thermal efficiency was lower, while at higher pressure ratios the additional compressor work and reduced exhaust temperature were associated with reduced gains in cycle performance.
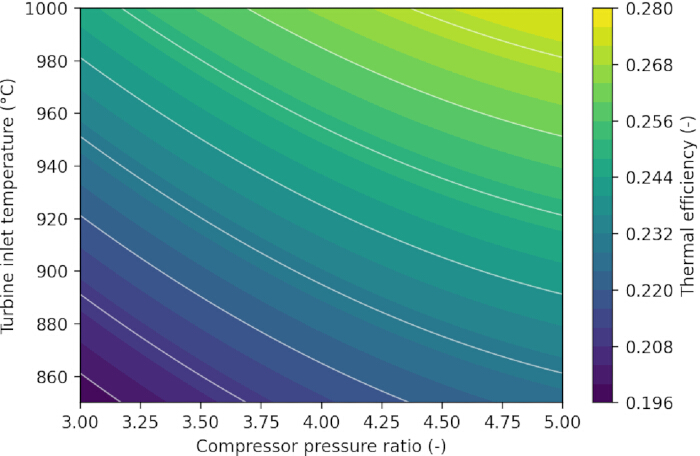
Figure 6: Thermal efficiency contour map as a function of compressor pressure ratio and turbine inlet temperature at fixed recuperator effectiveness and ambient conditions. Thermal-efficiency contours are plotted in the compressor pressure ratio–turbine inlet temperature plane at fixed recuperator effectiveness, load factor, and ambient conditions. The map shows a high-efficiency ridge centered near a compressor pressure ratio of approximately 4.0 and elevated turbine inlet temperatures, indicating a band of operating states with comparable predicted thermal efficiency. Please click here to view a larger version of this figure.
The thermal-efficiency surface formed a high-efficiency ridge rather than a single isolated point. Several neighboring combinations of compressor pressure ratio and turbine inlet temperature therefore produced similar predicted thermal efficiencies. In the corresponding specific-fuel-consumption surface, the minimum-SFC region was closely aligned with the high-efficiency ridge. The two-dimensional maps consequently defined the modeled region from which the load-specific candidate operating states were selected.
Operational optimization results and performance gains
The load-specific screening analysis evaluated compressor pressure-ratio operating states and turbine inlet temperature at fixed load factor. Compressor pressure ratio was treated as a parametric operating-state proxy rather than as an independently actuated control variable. Representative baseline and selected operating points for the three load cases are summarized in Table 3, where, Case A at 100% load, Case B at 80% load, and Case C at 60% load.
For Case A, the selected state shifted the compressor pressure ratio from 4.0 to 4.3 and the turbine inlet temperature from 950 °C to 960 °C. Thermal efficiency increased from 0.31 to 0.33, specific fuel consumption decreased from 0.27 to 0.26 kg/kWh, and net power increased from 100 to 102 kW.
| Case | Load factor | State | πc | T4 | ηth | SFC (kg/kWh) | Pnet (kWel) |
| Case A | 1 | Baseline | 4 | 950 | 0.31 | 0.27 | 100 |
| Case A | 1 | Optimized | 4.3 | 960 | 0.33 | 0.26 | 102 |
| Case B | 0.8 | Baseline | 3.8 | 930 | 0.29 | 0.29 | 80 |
| Case B | 0.8 | Optimized | 4.1 | 945 | 0.31 | 0.27 | 82 |
| Case C | 0.6 | Baseline | 3.5 | 900 | 0.26 | 0.31 | 60 |
| Case C | 0.6 | Optimized | 3.9 | 920 | 0.29 | 0.29 | 62 |
Table 3: Baseline and selected steady-state operating conditions for the three representative load cases. Cases A, B, and C correspond to load factors of 1.00, 0.80, and 0.60, respectively. The selected states were identified from the feasible discrete grid according to maximum thermal efficiency. Specific fuel consumption and net power output are reported as associated performance indicators.
For Case B, the selected state increased the compressor pressure ratio from 3.8 to 4.1 and the turbine inlet temperature from 930 °C to 945 °C. Thermal efficiency increased from 0.29 to 0.31, specific fuel consumption decreased from 0.29 to 0.27 kg/kWh, and net power increased from 80 to 82 kW.
For Case C, the selected state increased thermal efficiency from 0.26 to 0.29 and reduced specific fuel consumption from 0.31 to 0.29 kg/kWh, while net power increased from 60 to 62 kW. Across the three load cases, the relative thermal-efficiency improvements were approximately 6.5% at full load, 6.9% at 80% load, and 11.5% at 60% load. The corresponding specific-fuel-consumption reductions were approximately 3.7%, 6.9%, and 6.5%, respectively. Within the prescribed steady-state model, the baseline-relative difference was greater at the lower evaluated load factors. Confirmation using measured off-design data is required before these results can be applied to physical operating strategies.
Figure 7 compares specific fuel consumption as a function of net power output for the baseline and selected operating states. Across the investigated 60–100 kW range, the selected-state curve remained below the baseline curve, indicating lower model-predicted specific fuel consumption for the selected candidate states. The largest separation between the two curves occurred in the intermediate power region.
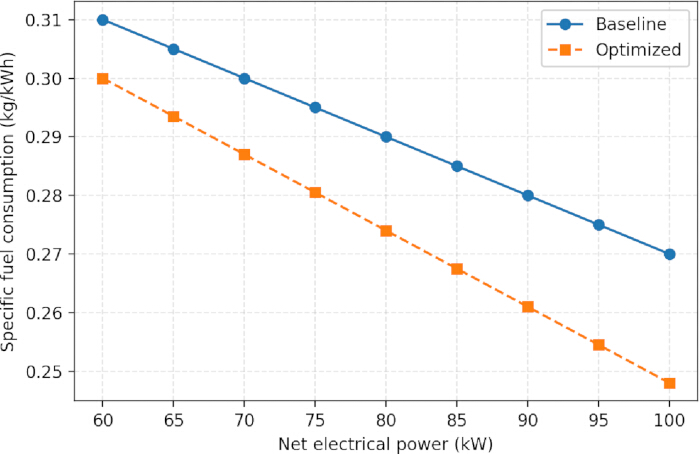
Figure 7: Specific fuel consumption as a function of net power output for baseline and selected operation across the 60–100 kW range. Specific fuel consumption is plotted against net power output for the baseline and selected operating states. Across the evaluated 60–100 kW range, the selected-state curve remains below the baseline curve, with the largest separation occurring in the intermediate power region. Please click here to view a larger version of this figure.
Figure 8 shows the selected operating points superimposed on the thermal-efficiency contour map. The selected states for Cases A, B, and C were positioned along the high-efficiency ridge identified in the two-dimensional performance map. The selected states were therefore consistent with the structure of the modeled thermal-efficiency surface.
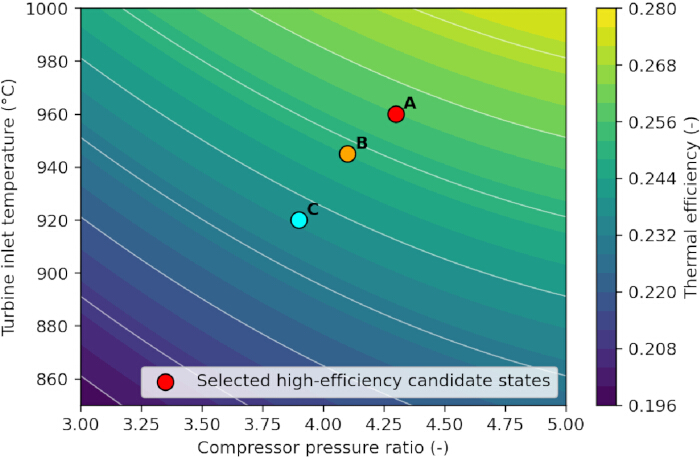
Figure 8: Selected operating points projected onto the thermal efficiency contour map. The selected operating points for Cases A, B, and C, corresponding to load factors of 1.00, 0.80, and 0.60, respectively, are superimposed on the thermal-efficiency contour map in the compressor pressure ratio–turbine inlet temperature plane. The selected states are positioned along the high-efficiency ridge identified in the modeled performance surface. Please click here to view a larger version of this figure.
Figure 9 summarizes the relative percentage changes in thermal efficiency, specific fuel consumption, and net power output for the three load cases. Thermal-efficiency gains ranged from approximately 6.5% at full load to 11.5% at 60% load. Specific fuel consumption decreased by approximately 3.7–6.9%, while net power increased by approximately 2.0–3.3%. Within the prescribed model, the baseline-relative differences were greater at the lower evaluated load factors. This pattern requires confirmation using component-map-based and measured off-design data.
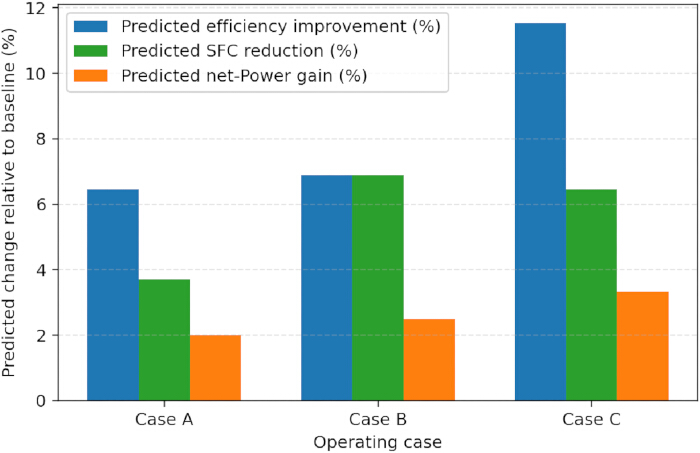
Figure 9: Relative percentage changes in thermal efficiency, specific fuel consumption, and net power output for the selected operating cases relative to baseline operation. Bar charts show the percentage changes in thermal efficiency, specific fuel consumption, and net power output for the selected states relative to their corresponding baseline conditions. Thermal-efficiency gains range from approximately 6.5–11.5%, specific fuel consumption reductions range from approximately 3.7–6.9%, and net power increases range from approximately 2.0%–3.3%. Please click here to view a larger version of this figure.
Taken together, Figures 7–9 show that the selected candidate states were located within the high-efficiency region of the modeled performance surface and were associated with lower predicted specific fuel consumption relative to the corresponding baseline states. These results represent model-based screening outcomes within the prescribed feasibility bounds and do not establish directly deployable operating setpoints or guaranteed improvements for a physical machine.
Robustness and operational implications
Sensitivity analysis was conducted to evaluate the selected operating states under variations in ambient temperature and recuperator effectiveness. Table 4 reports baseline and selected-state thermal efficiency and specific fuel consumption for the evaluated combinations of these parameters.
| Scenario | Ambient temperature (Tamb) (K) | Prescribed recuperator effectiveness (εrec) (-) | State | ηth | SFC (kg/kWh) |
| A1 | 288 | 0.85 | Baseline | 0.31 | 0.27 |
| A1 | 288 | 0.85 | Selected | 0.33 | 0.26 |
| A2 | 313 | 0.85 | Baseline | 0.30 | 0.28 |
| A2 | 313 | 0.85 | Selected | 0.32 | 0.27 |
| A3 | 288 | 0.78 | Baseline | 0.29 | 0.28 |
| A3 | 288 | 0.78 | Selected | 0.31 | 0.27 |
| A4 | 313 | 0.78 | Baseline | 0.28 | 0.29 |
| A4 | 313 | 0.78 | Selected | 0.30 | 0.28 |
Table 4: Model-predicted baseline and selected-state performance at selected ambient temperatures and prescribed recuperator-effectiveness values. Thermal efficiency and specific fuel consumption are compared between the baseline and selected operating states at the evaluated ambient temperatures and recuperator effectiveness values. The table shows whether the relative performance difference between the selected and baseline states persists across the evaluated sensitivity conditions.
Across the evaluated sensitivity conditions, the selected states retained a relative advantage over the corresponding baseline states. Both baseline and selected-state efficiencies decreased at higher ambient temperatures and lower recuperator effectiveness. However, the selected states continued to exhibit higher predicted thermal efficiency and lower predicted specific fuel consumption than the corresponding baseline cases within the examined parameter range.
Table 4 further shows that when the ambient temperature increased from 288 to 313 K or the recuperator effectiveness decreased from 0.85 to 0.78, the selected states retained an efficiency advantage of approximately 0.02 and a specific-fuel-consumption reduction of approximately 0.01 kg/kWh relative to the corresponding baseline states.
Overall, the numerical model produced internally consistent design-point and off-design trends within the prescribed modeling assumptions. The design-point comparison was based on published manufacturer specifications rather than independently measured experimental data. Parametric analysis showed that turbine inlet temperature, recuperator effectiveness, and compressor pressure ratio strongly influenced predicted thermal efficiency and fuel-use performance, while the load-specific screening procedure selected states located within the modeled high-efficiency region. Within the prescribed steady-state model and feasibility bounds, the selected candidate states were associated with improved predicted thermal efficiency and specific fuel consumption relative to the corresponding baseline states. Calibration and validation using measured off-design data are required before application to physical operating strategies.
DATA AVAILABILITY:
The underlying data and analysis materials supporting the findings of this study are publicly available in the Figshare repository at https://doi.org/10.6084/m9.figshare.33314892. The deposited materials include the complete evaluated candidate-state dataset, model input parameters, calculated thermodynamic, hydraulic, and performance variables; feasibility flags, parameter-sweep outputs, sensitivity-analysis outputs, refined-grid verification results, and the analysis files used to generate the figures and tables reported in this article. Supplementary File 1 provides pseudocode and input parameter specifications, and the Figshare repository contains the underlying raw numerical model outputs and processed datasets.
Supplementary File 1: Deterministic grid-search pseudocode and model input-parameter specifications.Please click here to download this file.
Discussion
The computational workflow provides a transparent approach for linking steady-state thermodynamic calculations, performance mapping, feasibility screening, and load-specific operating-state selection for a representative recuperated micro gas turbine. The principal contribution is procedural rather than introducing a new thermodynamic cycle or optimization algorithm. By explicitly defining the sequence of input specification, direct thermodynamic-state calculation, feasibility screening, performance mapping, and exhaustive grid evaluation, the workflow provides a reproducible basis for application to comparable recuperated micro gas turbine systems.
The selected high-efficiency model states represent an offline implementation pathway rather than direct control commands for a physical micro gas turbine. In a practical system, the pressure-ratio operating-state proxy would require translation into coupled shaft-speed and fuel-flow schedules using calibrated compressor and turbine maps. A supervisory control layer would also need to enforce turbine-temperature limits, shaft-speed limits, compressor surge and choke margins, fuel-system and actuator limits, exhaust-temperature requirements, and site-specific electrical and thermal demands. The workflow can therefore identify candidate operating regions for subsequent controller development but cannot prescribe directly deployable machine setpoints. Calibration with measured design-point and off-design data, dynamic simulation, and controlled experimental testing would be required before physical implementation.
For comparison, De Paepe et al. applied a component-map-based Turbec T100 model and multi-objective optimization of turbine outlet temperature and rotational speed, reporting a maximum electrical efficiency of 31.5% and a maximum electrical power of 141.3 kW at an efficiency of 29.7%9. The present workflow has a different purpose and level of model fidelity, using a prescribed-parameter, steady-state 100 kW-class model to compare selected candidate states with corresponding baseline states at three load factors. The predicted relative thermal-efficiency improvements of 6.5%–11.5% and specific-fuel-consumption reductions of 3.7%–6.9% therefore represent baseline-relative screening results rather than absolute values directly comparable with the Turbec T100 results. The workflow provides a reproducible framework for load-specific performance mapping, feasibility screening, and candidate-state selection, which can subsequently be extended with component maps and measured data.
The analysis has several limitations. Model assessment was limited to design-point benchmarking against published manufacturer specifications rather than independently measured experimental data. Quantitative reference data for off-design operation, including the 80% and 60% load cases evaluated in the study, were not available in the cited manufacturer documentation. Accordingly, the off-design performance maps, sensitivity results, and selected candidate states should be interpreted as model-based thermodynamic predictions within the prescribed assumptions rather than experimentally validated operating setpoints. The model assumes steady-state operation, fixed fuel composition, prescribed component efficiencies, and fixed recuperator effectiveness. Transient load changes, detailed compressor and turbine maps, variable recuperator heat-transfer behavior, component degradation, emissions, measurement uncertainty, and site-specific control constraints are not represented.
Recuperator effectiveness was prescribed as a fixed value during each primary load-specific grid search. In a physical machine, recuperator effectiveness and pressure loss vary with mass flow rate, inlet temperatures, gas properties, fouling condition, and heat-transfer characteristics. The fixed-effectiveness assumption may therefore introduce systematic uncertainty into predicted part-load efficiency, fuel consumption, exhaust temperature, and the location of selected high-efficiency candidate states. The separate sensitivity analysis over recuperator-effectiveness values of 0.75–0.90 evaluates dependence on this prescribed parameter but does not constitute a physically resolved off-design recuperator model.
The selected optimum is also defined relative to the specified discrete search grid. Although the search is exhaustive within that grid, the analysis does not establish a continuous-space global optimum or compare outcomes with alternative optimization algorithms. Critical implementation considerations include consistent units, enforcement of physically meaningful recuperator temperature ordering, feasibility screening, and a grid density sufficient to resolve the local performance surface. Application of the workflow to another machine would require replacement of generic component parameters with manufacturer information, component maps, or measured operating data.
The workflow is intended for offline operating-envelope assessment in distributed-generation, combined-heat-and-power, and microgrid-planning studies. Future work should include calibration using measured design-point and off-design data, incorporation of component maps and variable recuperator effectiveness, and extension to dynamic operation, emissions, component life, uncertainty, and multi-objective optimization. These developments are required before the framework can support robust decision-support or supervisory-control applications.
Conclusion:
A transparent steady-state computational workflow was developed and applied to evaluate and select feasible operating states of a recuperated 100 kW micro gas turbine under representative load conditions. The workflow integrates thermodynamic-state calculations, feasibility screening, performance mapping, and deterministic grid-search evaluation to identify operating regions associated with improved predicted thermal performance without modification of system hardware.
Systematic adjustment of the prescribed operating-state variables was associated with improved predicted performance, particularly when turbine inlet temperature, compressor pressure ratio, load demand, and recuperator behavior were evaluated jointly within the defined constraints. The selected states yielded baseline-relative improvements in thermal efficiency and specific fuel consumption within the prescribed steady-state, fixed-parameter model. These results should therefore be interpreted as screening-level operating guidance rather than experimentally validated physical operating setpoints.
Future work should calibrate the framework against measured off-design data and extend the model to incorporate component maps, variable recuperator effectiveness, transient operation, emissions, component life, and multi-objective optimization. These developments would strengthen the application of the workflow to distributed-generation, combined-heat-and-power, and microgrid decision-support studies.
Disclosures
The authors declare no competing financial interests. Claude (Anthropic) and ChatGPT were used during manuscript preparation for editing, formatting consistency, and prose refinement. All AI-assisted content was subsequently reviewed and edited by the authors, who take full responsibility for the article's content.
Acknowledgements
No external funding was received for this work.
Materials
| Name | Company | Catalog Number | Comments |
|---|---|---|---|
| AE-T100 natural-gas micro turbine data sheet | Ansaldo Energia | N/A | Manufacturer design-point benchmarking reference |
| Matplotlib | Matplotlib Development Team | 3.10.5 | Figure generation and visualization |
| NumPy | NumPy Developers | 2.4.0 | Array operations and candidate-grid generation |
| Python | Python Software Foundation | 3.13.0 | Numerical model implementation |
| SciPy | SciPy Developers | 1.16 | Scientific numerical routines |
| Visual Studio Code | Microsoft | 1.98 | Code development and execution |
| Windows | Microsoft | 11 | Operating system |
References
- De Robbio R. Micro gas turbine role in distributed generation with renewable energy sources. Energies. 2023;16(2):704. doi:10.3390/en16020704.
- Konečná E, Teng SY, Máša V. New insights into the potential of the gas microturbine in microgrids and industrial applications. Renewable and Sustainable Energy Reviews. 2020;134:110078. doi:10.1016/j.rser.2020.110078.
- Oreijah M, et al. Modeling of Combined Heat and Power Cycle based on Micro Gas Turbines using Biogas Fuel: an Investigation of Key Parameters. Renewable Energy Research and Applications. 2025;6(1):83–91.
- Banihabib R, Assadi M. Dynamic modelling and simulation of a 100 kW micro gas turbine running with blended methane/hydrogen fuel [conference paper]. Presented at: ASME Turbo Expo 2022: Turbomachinery Technical Conference and Exposition; Rotterdam, Netherlands; 2022. doi:10.1115/GT2022-81276.
- Leylek Z, Anderson WS, Rowlinson G, Smith N. An investigation into performance modeling of a small gas turbine engine [conference paper]. Presented at: ASME Turbo Expo 2013: Turbine Technical Conference and Exposition; San Antonio, TX, USA; 2013. doi:10.1115/GT2013-94405.
- Czarnecki M. Micro gas turbine evolution, a quarter-century review. Combustion Engines. 2025;64(2):83–90.
- Banihabib R, Skaug Fadnes F, Assadi M, Bensmann B. Optimizing micro gas turbine operation in a microgrid system with natural gas and hydrogen fuel: an artificial intelligence-based approach. Journal of Engineering for Gas Turbines and Power. 2024;146(2):021005. doi:10.1115/1.4063423.
- Hashmi MB, Mansouri M, Assadi M. Dynamic performance and control strategies of micro gas turbines: State-of-the-art review, methods, and technologies. Energy Conversion and Management: X. 2023;18:100376. doi:10.1016/j.ecmx.2023.100376.
- De Paepe W, et al. Operational optimization of a typical micro gas turbine. Energy Procedia. 2017;142:1653–1660.
- Aliehyaei MA. Optimization of micro gas turbine by economic, exergy and environment analysis using genetic, bee colony and searching algorithms. Journal of Thermal Engineering. 2020;6(1):117–140.
- Marcellin KN, Ouattara A, Joseph SK. Multiobjective optimization of micro-gas turbines environmental polluting emissions due to their internal and external thermal losses. American Journal of Environmental Protection. 2023;12(1):1–10.
- Hosseinimaab SM, Tousi AM. Optimizing the performance of a single-shaft micro gas turbine engine by modifying its centrifugal compressor design. Energy Conversion and Management. 2022;271:116245. doi:10.1016/j.enconman.2022.116245.
- Talebi SS, Tousi AM, Madadi A, Kiaee M. A methodology for identifying the most suitable measurements for engine level and component level gas path diagnostics of a micro gas turbine. Proceedings of the Institution of Mechanical Engineers, Part C: Journal of Mechanical Engineering Science. 2022;236(5):2646–2661.
- Koçer G. Aerothermodynamic modeling and simulation of gas turbines for transient operating conditions [master’s thesis]. Middle East Technical University; Turkey. https://open.metu.edu.tr/handle/11511/17817
- Energia A. AE-T100 Micro Turbine, Natural Gas, DATA SHEET. Ansaldo Energia; Genova, Italy; 2015.
- Kerrebrock JL. Aircraft engines and gas turbines. MIT Press; 1992.
- Omatete OO. Assessment of recuperator materials for microturbines. Oak Ridge National Laboratory; TN, USA; 2001.
- Rathakrishnan E. Gas dynamics. PHI Learning Pvt. Ltd.; 2020.
- Emmons HW. Fundamentals of gas dynamics. Princeton University Press; 2015.
- Babu V. Fundamentals of gas dynamics. John Wiley & Sons; 2015.
- Benson RS. Advanced engineering thermodynamics: thermodynamics and fluid mechanics series. Elsevier; 2013.
- Galanti L, Massardo AF. Micro gas turbine thermodynamic and economic analysis up to 500 kWe size. Applied Energy. 2011;88(12):4795–4802.
- Li Q, Zhang Q, Zhang L. (Off-) Design performance analysis and prediction of micro gas turbine using hybrid fuels (NG & H₂) based on dynamic model and neural network. Energy Conversion and Management. 2025;346:120473. doi:10.1016/j.enconman.2025.120473.
- Weerakoon AS, Assadi M. Trends and advances in micro gas turbine technology for sustainable energy solutions: A detailed review. Energy Conversion and Management: X. 2023;20:100483. doi:10.1016/j.ecmx.2023.100483.
- Pourhasanzadeh M, Bigham S. Optimization of a micro gas turbine using genetic algorithm [conference paper]. Presented at: ASME Turbo Expo 2011: Turbine Technical Conference and Exposition; Vancouver, British Columbia, Canada; 2011. doi:10.1115/GT2011-46400.
- Banihabib R, Obrist MJ, Assadi M, Jansohn P. Micro gas turbine modelling and adaptation for condition monitoring [conference paper]. Presented at: Global Power and Propulsion Society Chania 2022; Chania, Greece; 2022. Paper GPPS-TC-2022-138. doi:10.33737/gpps22-tc-138.