We introduce a high-throughput droplet digital polymerase chain reaction (ddPCR) assay to detect mitochondrial deoxyribonucleic acid (mtDNA) alleles and quantify mitochondrial base editing events in cells with a mixed mtDNA population.
Method Article
A Droplet Digital Polymerase Chain Reaction Assay for Detecting and Quantifying Pre-Existing Mutations and De Novo Editing Events in Mitochondrial DNA
In This Article
Summary
Abstract
Development of mitochondria-targeted base editors as a gene therapy strategy for mitochondrial deoxyribonucleic acid (mtDNA)-related diseases, such as MT-ATP6 Leigh syndrome (LS), requires using in vitro models for proof-of-concept evaluations. Here, we developed a droplet digital polymerase chain reaction (ddPCR)-based assay that uses detection probes specific to wild-type, mutant, or edited mtDNA alleles to determine the heteroplasmy level in cells carrying different mtDNA variants. We used a pathogenic human MT-ATP6 allele as an example to demonstrate the development and optimization pipeline of this assay. We optimized assay parameters and designed experiments to validate the precision of the assay in quantifying MT-ATP6 variants and their fraction among the total mtDNA copy number. In addition, our data indicated that this assay is highly sensitive. To allow high-throughput screening, we then developed an R-based analysis pipeline to streamline the analysis workflow for determining MT-ATP6 variant fractional abundance. Our data demonstrated that the assay achieved the high resolution required to differentiate various heteroplasmic MT-ATP6 alleles. Future studies can build upon the current protocol and develop similar ddPCR assays to perform high-throughput screening for the identification of cell lines or tissue samples with specified mtDNA alleles.
Introduction
Mitochondria are intracellular organelles that support many critical cellular functions1,2,3. Beyond energy production through oxidative phosphorylation (OXPHOS), mitochondria are also key regulators of other cellular processes, such as cell metabolism, immune responses, and nucleic acid synthesis1,2,3. The mitochondrial genome is composed of circular, intron-less, polycistronic double-stranded DNA that typically exists in multiple copies (~100–10,000) per cell and varies in copy number across cell types4,5. Mitochondrial deoxyribonucleic acid (mtDNA) encodes 13 critical subunits of the electron transport chain, as well as transfer RNA (tRNA) and ribosomal RNA (rRNA) essential for synthesizing these 13 proteins. Unlike nuclear DNA, mtDNA is more susceptible to DNA damage, mutation, and degradation due to a lack of advanced DNA repair mechanisms and the protection from histones and other DNA-binding proteins4. Thus, mutations in mtDNA can accumulate with age and be passed on to offspring, leading to severe disease symptoms due to mitochondrial dysfunction. A therapeutic approach to correct these mutations and improve mitochondrial function remains a critical unmet need.
Heteroplasmy in mtDNA refers to the coexistence of mutant and wild-type (WT) mtDNA in a cell. The percentage of mutant copies among the total mtDNA copies, or mutant load, correlates with the severity of mitochondrial dysfunction5. Symptoms often manifest when mutant mtDNA exceeds a threshold, ultimately resulting in impaired mitochondrial function4. For example, patients with point mutations in MT-ATP6 with 70–90% mutation load typically present with neuropathy, ataxia, and retinitis pigmentosa (NARP) and can survive into their third and fourth decades, whereas patients with a mutation load >90% present with maternally inherited Leigh syndrome (MILS), an early-onset fatal neurodegenerative disease6. Mitochondria-targeted base editing (mitoBE) is a promising technology to alter the mtDNA heteroplasmy level and directly correct mutant mtDNA to WT sequence to restore mitochondrial functions7,8,9. However, screening effective mitoBE and establishing a cell model to determine their in vitro efficacy are still challenging due to the high mtDNA copy number and drift of heteroplasmic mtDNA in cells during proliferation. In this study, we developed a droplet digital polymerase chain reaction (ddPCR) assay to detect mtDNA alleles and determine the editing efficiency of mitoBE.
‘ddPCR’ is a quantitative method for detecting nucleic acid species that relies on absolute quantitation of the droplets and fluorescent readouts10,11. While the principle of ddPCR is similar to that of real-time quantitative PCR (qPCR), the analysis of qPCR data relies on a standard curve generated from standards with known copy numbers, assuming equivalent amplification efficiencies for the standards12. DdPCR, on the other hand, utilizes absolute quantification based on Poisson statistics by randomly distributing and partitioning the DNA templates across tens of thousands of individual droplets. To ensure balanced distribution of the target copies per droplet within the droplet population, adequate DNA concentration is loaded and empty droplets are expected. Approximations of the target amplicon concentration are calculated from the total, negative, and positive droplets using an equation derived from the Poisson probability distribution12. This method allows accurate quantification of a specific allele among other variants, which is suitable for determining mtDNA heteroplasmy levels. The sensitivity of an assay is also critical for detection of the mtDNA alleles in both heteroplasmic and homoplasmic cells, especially for alleles existing at low frequencies. A well-designed ddPCR assay will also allow the detection of DNA copies of very low concentration, exceeding the detection limit of qPCR. Here, we developed a ddPCR assay that is highly specific and sensitive in detecting different mtDNA alleles among multiple variants, including pre-existing pathogenic variants and de novo mutations installed by the mitoBE (Figure 1A). We will use MT-ATP6 as an example to demonstrate how we developed and used this assay to determine heteroplasmy level of mutant MT-ATP6 and the editing efficiency of mitoBE.
Protocol
This study does not involve human subjects, human-derived primary material, or animals. Therefore, no Institutional Review Board (IRB) or Institutional Animal Care and Use Committee (IACUC) approval is required. All experiments are performed using A375 cells, an established, commercially available human melanoma cell line (see Table of Materials). The mutant cell line was obtained from Dr. Prashant Mishra’s laboratory at UT Southwestern Medical Center.
1. Primer and probe design and optimization
- Primer design
- Design primers and probes with a primer/probe design tool using the qPCR features within the design tool (see Supplementary Table 1).
NOTE: Avoid designing a guanine (G) at the 5’ terminus of the probe to prevent quenching of the fluorophore. - Choose 150 bp before and after the target site as the template sequence.
- Select the primer probe sets with the highest melting temperature differences between the primer and probe and GC content of 40%–60% for the ddPCR assay design. Ensure that the primers have the same melting temperatures.
- Choose identical primers for the detection of both the WT allele and the edited alleles. Select a different primer set for the mutant allele to achieve optimal detection of the single-base mismatch compared to WT13.
- Order forward and reverse primers with probes as a custom qPCR primer/probe assay (see Table of Materials), and choose 5’-Dye and 3’-Quencher during the customization step. The primer to probe ratio is 2:1 in a typical setup.
NOTE: For this ddPCR protocol, we selected a specific dye/quencher pair (see Table of Materials). - Upon receipt, resuspend the lyophilized primer and probe mixture to prepare a 20× stock solution according to the manufacturer’s instructions. Aliquot the prepared stock solution into 100 µL portions per tube.
- Design primers and probes with a primer/probe design tool using the qPCR features within the design tool (see Supplementary Table 1).
- Annealing temperature optimization for primer and probe sets
- Perform an annealing temperature gradient ranging from 55 °C to 65 °C on control plasmids with all primer and probe sets to determine the optimal annealing temperature for amplification and detection of the targets.
- Determine an annealing temperature with minimal non-specific amplification that is shared by all primers and probe sets to enable multiplexing.
2. Prepare DNA samples
- Quantifying genomic and plasmid DNA
- Culture A375 WT (m.8993T) and A375 homoplasmic mutant (m.8993G) cells in high-glucose DMEM supplemented with 10% fetal bovine serum, 1× GlutaMAX, 1× sodium pyruvate, 1× non-essential amino acids (NEAA), 1× penicillin-streptomycin (Pen-Strep), and 50 mg/L uridine.
NOTE: A375 WT (m.8993T) and A375 homoplasmic mutant (m.8993G) cells were obtained and established at Prashant Mishra’s laboratory at UT Southwestern Medical Center13. Briefly, single cell clones were generated by transfecting with doxycycline-inducible, mitochondria-targeted TALE-DdCBE (mitoBE) constructs using FuGENE 4K transfection reagent along with PiggyBac transposase construct for stable genomic integration. Following transfection, cells underwent antibiotic selections, doxycycline induction and were sorted into 96-well plates via fluorescence-activated cell sorting (FACS). Single cell clones were developed following a series of in vitro expansions. Genomic DNA was collected after 1 × 10⁶ cells were obtained from the clone. Seventeen biological replicates from mitoBE engineered mutant A375 single cell clones were utilized in the screen. One biological replicate from a heteroplasmic clone was used for assay optimization. - Isolate genomic DNA (gDNA) from cells using gDNA Extraction Kit following the manufacturer’s protocol. Genomic DNA samples are first quantified via microvolume spectrophotometer and normalized to 5 ng/µL based on the microvolume spectrophotometer results (see Table of Materials). Further quantify the gDNA using the high-sensitivity dsDNA quantification assay according to the manufacturer’s protocol.
- Reconstitute the control plasmids to 50 ng/µL with molecular grade water and quantify via microvolume spectrophotometer. Further dilute plasmids to 1 ng/µL in water. Quantify the diluted plasmid DNA via high-sensitivity dsDNA quantification assay following the manufacturer’s protocol on a plate reader.
NOTE: In our experiment, control plasmids were designed and synthesized bearing the MT-ATP6 mutant, WT or edited variants. Plasmid DNA was synthesized in a commercial plasmid backbone, and stored at -20 °C until assay. The assay was performed without linearizing the DNA. - Dilute DNA (genomic or plasmid) to 0.5 ng/µL working concentration in water based on Quant-it HS results.
- Culture A375 WT (m.8993T) and A375 homoplasmic mutant (m.8993G) cells in high-glucose DMEM supplemented with 10% fetal bovine serum, 1× GlutaMAX, 1× sodium pyruvate, 1× non-essential amino acids (NEAA), 1× penicillin-streptomycin (Pen-Strep), and 50 mg/L uridine.
- Prepare genomic and plasmid DNA samples at ultra-low concentrations
- Dilute each assayed gDNA sample from 0.5 ng/µL to 2.048 × 10⁻³ ng/µL through 6 serial dilutions of 2.5-fold for each dilution as shown in Figure 1B. Add 5 µL of diluted DNA to the ddPCR reaction.
- Dilute control plasmids starting with 0.5 ng/µL through 5 serial dilutions of 10-fold to 5 × 10⁻⁶ ng/µL (Figure 1C).
3. Performing ddPCR and data analysis
Figure 1A provides a general ddPCR workflow.
- Setting up the ddPCR plate
- Prepare positive control: Mix the control plasmids at fixed ratios to represent defined heteroplasmy level or editing efficiency of mtDNA, as shown in Figure 1C. For example, a sample of 10% mutant plasmid copies and 90% edited plasmid copies can be prepared by mixing 2 µL of diluted plasmid encoding the mutant allele with 18 µL of diluted plasmid encoding the edited variant.
- Prepare negative control: Prepare a no-template control (NTC) containing the ddPCR reaction master mix with an equivalent volume of water in place of the sample DNA template.
NOTE: This ensures the reagents are not contaminated with other genomic material that would interfere with results. - Before setting up the assay, thaw the ddPCR Supermix (2×) and aliquots of the Mutant-HEX and Edited-FAM primer/probe sets (20×) or Mut-FAM and WT-HEX primer/probe sets (20×), and keep them on ice or a cold block.
- Prepare the master mix by combining 1× ddPCR Supermix and 1× of both target primer/probe sets with UltraPure DNase/RNase-free water, excluding the 5 µL of diluted gDNA or 2 µL of diluted positive control plasmid added per sample. The master mix volume should be 17 µL per sample for gDNA samples or 20 µL per sample for positive controls. The total volume of each reaction is 22 µL.
- Place a ddPCR 96-well plate on a cold block. Briefly vortex the master mixes prepared above and gently spin them down on a tabletop centrifuge. Aliquot the master mix to each well according to the experimental layout.
- Add the diluted DNA templates to the corresponding sample and replicate wells. Dispense each sample directly into the master mix rather than onto the side of the well.
- For NTC reactions, add an equivalent volume of water (5 µL). If a column contains empty wells, add 22 µL of ddPCR buffer control for probes to each empty well.
NOTE: This is important so that the empty wells do not interfere with the droplet generation process.
- Droplet generation and PCR amplification
- Seal the plate with foil using the PCR plate sealer.
- Vigorously vortex the ddPCR plate to ensure even distribution of DNA molecules across all wells.
- Centrifuge the plate at 1,300 × g for 1 minute. If there are bubbles at the bottom of the reaction, place the plate on a cold block for a few minutes and continue to centrifuge the plate until the bubbles are no longer present at the bottom of the well.
- Carefully load the plate onto the automated droplet generator and load the consumables. Ensure sufficient droplet generator oil is present. Load a fresh ddPCR plate onto the cold block for the generated droplets to be transferred. Start the droplet generation.
- Once the droplet generation is finished, remove the plate containing generated droplets and inspect the wells to ensure consistent droplet formation across the assayed wells.
- Seal the plate containing generated droplets using the plate sealer and load the plate directly onto the PCR thermocycler and initiate the thermocycling program in Table 1.
- Read and quantify droplets
- In the droplet-analysis software, set up the plate information for the droplet reader and select Direct Quantification as the Experiment Type. Select the “ddPCR Supermix for Probes (No dUTP)” as the ddPCR Supermix. Select the “Single Target per Channel” under Assay Type. Indicate the target names for the HEX and FAM channels. Select “Unkn” under Target Type for both FAM and HEX channels. Lastly, enter the sample information so that replicate wells can be grouped during analysis.
- After PCR amplification, load the plate into the droplet reader and start the run. Confirm that all fluid levels are adequate, refill the droplet reader oil, and empty the waste container as needed.
- Save the data to an appropriate location on the computer.
- Analysis
- Load data into the droplet-analysis software (see Table of Materials) and perform a quality check. Expect ~20,000 droplets to be generated per reaction. If technical replicates are performed for each biological sample, the two replicates can be merged, yielding a total of ~40,000 droplet counts.
NOTE: Wells containing less than 10,000 events or more than 120,000 target copies should be excluded. - Export amplitude data from the droplet-analysis software and subsequently analyze them using the ddPCR analysis application (Supplementary File 1) to generate a scatter plot for an individual sample or merged data of the replicates of each biological sample, along with the target concentrations and target fractional abundance information.
- To analyze the data directly in the droplet-analysis software, first set amplitude thresholds for each of the two channels (FAM and HEX).
NOTE: These amplitude thresholds were determined from NTC reactions. Thresholds for each channel were set above the negative droplet and background droplet amplitudes. (For example, in an assay with Mut-HEX + Edit-FAM primer/probe combinations, HEX threshold = 2,500 and FAM threshold = 4,500). The threshold setting was applied throughout the assay for all analyzed samples to ensure consistent quantification. If intermediate droplets were detected, any intermediate droplets with amplitude above the threshold were included in the analysis. Conversely, any intermediate droplets with amplitudes below the threshold were excluded and were considered as background. - Calculate the fractional abundance of the edited allele (or other target alleles, depending on the assay) using the software's fractional abundance feature. Display the data as individual replicates or as merged replicate data, and export it in .csv format for further analysis.
- Load data into the droplet-analysis software (see Table of Materials) and perform a quality check. Expect ~20,000 droplets to be generated per reaction. If technical replicates are performed for each biological sample, the two replicates can be merged, yielding a total of ~40,000 droplet counts.
Results
Following this protocol, we established an assay to determine the editing efficiency of mitoBE in mutant A375 cells13. We first determined the optimal annealing temperature for each of the primer and probe sets. As shown in Figure 2A and Figure 2B, an annealing temperature of 61.2 °C was optimal for all sets based on the condition that gave the lowest non-specific amplification. We also evaluated two mutant probe variants and selected the Mut_2 probe throughout the assays because it showed less non-specific detection when multiplexed with the WT primer/probe set at the selected annealing temperature. In addition, in Figure 2B and Figure 2D, 61.2 °C was selected for the Edit probe to match the annealing temperature with that of the Mut_2 probe, as the combination of Mut and Edit primer/probe sets were used for screening on-target editing in homoplasmic mutant A375 clones that were engineered with mitoBE. Figure 2B and Figure 2C indicate that our primer/probe sets are highly specific. In addition to on-target detection of the edited allele by the Edit probe, whereas the WT primer/probe set does not detect the edited allele (Figure 2B). The WT and mutant probes also did not detect the edited allele (Figure 2C).
Next, we determined the optimal concentration of gDNA for detection. We used gDNA from a heteroplasmic A375 cell clone. We examined seven gDNA concentrations using serial dilutions, and all concentrations showed a similar level of heteroplasmy for this sample (mean = 38.7% of mutation load) (Figure 3A). We selected an input gDNA loading of 10.2 pg to detect 700-1000 target copies of mtDNA alleles in this ddPCR assay aiming at < 1 target copy per droplet (Figure 3B). We then determined the selectivity of our primer and probe sets using control plasmids. To mimic the heteroplasmy levels of mtDNA, we mixed the WT and mutant control plasmids at different ratios, as indicated in Figure 1C. Our results in Figure 3C suggested that the expected and detected heteroplasmy level in the experiment typically results in a difference of approximately 10% heteroplasmy or greater, which is tolerated in our rapid high-throughput screening assay.
Once all primer and probe sets were validated and ddPCR conditions were determined, we assessed the heteroplasmy level of mutant A375 cells using the Mut-HEX + Edit-FAM primer/probe set. We screened 17 cell clones edited with the mitoBE we developed in the laboratory. Figure 4A shows that clone_5 is one of the homoplasmic edited clones (Edit-2_FA = 1), and negative control is a clone with low-level heteroplasmic edit at 2.8% (Edit-2_FA = 0.028). We also included plasmid controls mixed with 90% edited and 10% mutant alleles. Similar to the data in Figure 3C, there is an approximately 10% tolerable difference between the expected and detected fractional abundance (Edit-2_FA = 0.795; Figure 4B); this threshold was established from assay optimization to be within the expected error.
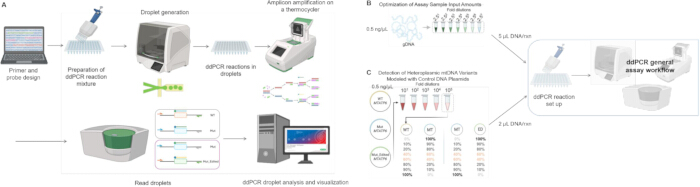
Figure 1: Schematic of the ddPCR assay workflow and sample preparations. (A) Primers and probes were designed in silico and synthesized. DdPCR assay reactions were prepared with the corresponding primers and probes based on assay type. Droplets were generated via an automated droplet generator, and genomic targets were amplified via optimized thermocycling conditions. Droplets were analyzed by the droplet reader. DdPCR output data were visualized and analyzed computationally. (B) Dilution series of gDNA amounts from 101 to 107 of diluted gDNA as assay inputs for assessing sensitivity of the assay and for establishing optimal range of gDNA sample loading amount for the assay. (C) Mixtures of different control plasmids at various proportions to determine if assay is capable of precisely detecting and identifying the expected proportion of the target alleles. Please click here to view a larger version of this figure.
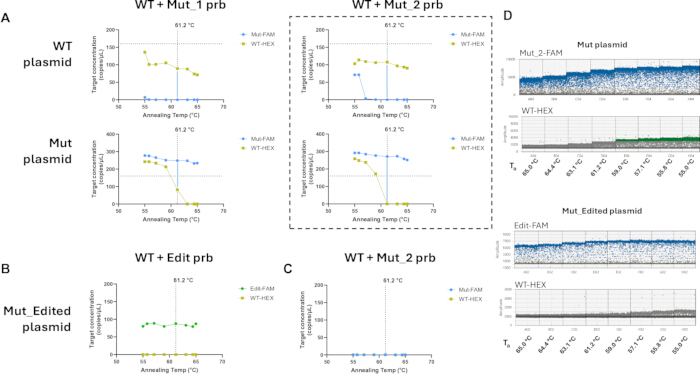
Figure 2: Optimization of the annealing temperature for assay reagents. (A) 61.2 °C was determined to be an optimal annealing temperature for WT and mutant (Mut) primer and probe sets using either WT plasmid or Mut plasmid as templates. Two mutant primer and probe sets were evaluated. (B) 61.2 °C was determined to be an optimal annealing temperature for edited primer and probe set using the edited plasmid as a template. (C) Mutant and WT primer and probe sets do not detect edited allele. Specific primers and probe combinations used in the assay are indicated in each plot. (D) Representative ddPCR droplet plots from Mut plasmid assayed with Mut_2-FAM + WT-HEX primer/probe sets or Mut_Edited plasmid assayed with Edit-FAM + WT-HEX primer/probe sets are shown across the annealing temperature gradient (Ta = annealing temperature). Please click here to view a larger version of this figure.
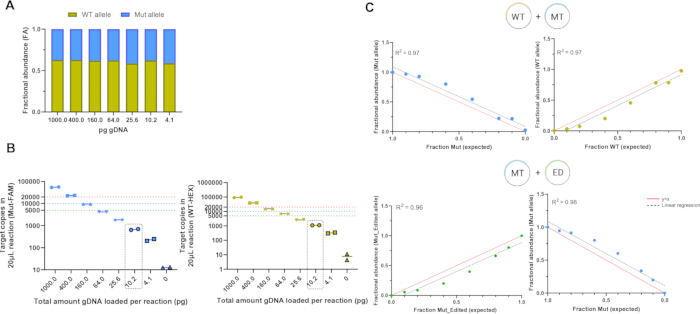
Figure 3: Minimum gDNA concentration determination and heteroplasmy level validation using control plasmids. (A) Measured fractions of WT and mutant alleles in MT-ATP6 using gDNA of cell line as input across a wide range of input amounts using WT-HEX + Mut-FAM primer/probe set. (B) Copy number of targeted mtDNA allele in the 20 µL reaction from (A) is calculated and plotted for all gDNA concentrations. Two technical replicates were processed for each gDNA sample input. (C) Results from mixing target control plasmids at various ratios. The WT-HEX + Mut-FAM primer/probe sets and Mut-HEX + Edit-FAM primer/probe sets were used in the experiment shown in the top and bottom panel, respectively. The measured fractional abundance of the targets is plotted on the y-axis and the expected fraction based on the preparation of the plasmid mixtures is plotted on the x-axis. The data are presented as a merged dataset from two technical replicates. WT = wildtype control plasmid, MT = Mut control plasmid, ED = Mut_Edited control plasmid. Please click here to view a larger version of this figure.
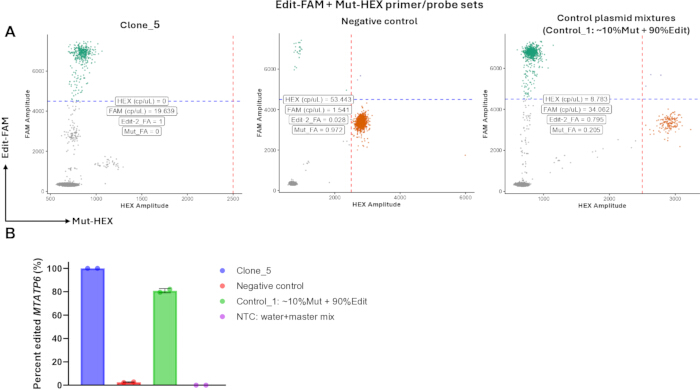
Figure 4: Screening single cell clones with homoplasmic edited mtDNA via ddPCR assay. (A) Representative samples showing the droplets as scatterplots. Calculated target concentrations and fractional abundance information are displayed. Plots were generated via the custom ddPCR analysis application. (B) Percentage of edited alleles in the selected single cell clones and controls. Two technical replicates were processed for each sample, and error bars represent standard deviation. Please click here to view a larger version of this figure.
| Step | Temperature | Ramp Rate | Time |
| 1 | 95 °C | 2 °C/s | 10:00 |
| 2 | 94 °C | 0:30 | |
| 3 | 61.2 °C | 1:00 | |
| 4 | Go to step 2 (40 X) | - | |
| 5 | 98 °C | 10:00 | |
| 6 | 4 °C | 3 °C/s | Hold |
Table 1: Thermocycling conditions used for the droplet digital PCR (ddPCR) assay. The table summarizes the PCR cycling program used to amplify mitochondrial DNA targets following droplet generation, including the temperature, incubation time, number of cycles, and ramp rate for each thermocycling step.
Supplementary File 1: Custom R-based ddPCR analysis application. The R script/application used to process exported ddPCR amplitude data, generate droplet scatter plots, calculate target concentrations, and determine fractional abundance for individual samples or merged technical replicates. Please click here to download this file.
Supplementary Table 1: Primer and probe sequences used in the ddPCR assays. The table lists the target allele, forward and reverse primer sequences, probe sequence, fluorophore, quencher, and expected amplicon size for each assay. Please click here to download this file.
Discussion
Studying the genetic effects of mtDNA variants requires isogenic single cell clones that stably carry a defined heteroplasmy level. Because mtDNA is present in many copies per cell and the heteroplasmy level can drift as cells divide, single cell clones with a stable mtDNA population are critical for studying the effects of a specific mtDNA genotype and its functional impacts. However, establishing such clones requires generating and screening a substantial number of individual clones to identify those carrying the desired mtDNA genotype. This screening is traditionally cumbersome, relying on time-consuming Sanger sequencing, next-generation sequencing and bioinformatic analyses to identify clones with optimal mtDNA editing level for cell line models. In addition to sequencing, mtDNA heteroplasmy and copy number can be determined using qPCR approaches. However, the qPCR approach often shows limited sensitivity and accuracy of the quantification due to the required high mtDNA template concentrations14. Digital PCR approaches have been applied to detect single-nucleotide variants in mtDNA for heteroplasmy quantifications14. The approach we describe here uses two independent probes to measure heteroplasmy of de novo mutations generated by mitoBE or of pre-existing mtDNA variants, thereby enabling detection of two variants in a single cell population with a single assay. This provides avenue for high-throughput model development efforts for mitochondrial diseases and therapeutic advancements.
The ddPCR assay we presented here is a high-throughput and straightforward method to obtain the frequency of the specific mtDNA allele to screen for clones with the desired heteroplasmy level, determine editing efficiency, and select a homoplasmic edited clone for future functional assessments. In addition, ddPCR remains highly sensitive because mtDNA copy numbers can be detected with a relatively low abundance of gDNA input (Figure 3B). While the reproducibility of the assay is not demonstrated in this paper, to ensure assay consistency, we performed each ddPCR with a duplicate well for each sample, and detection of target copies appeared highly consistent across the duplicates (Figure 3B and Figure 4B). Furthermore, detection of the multiple mtDNA variants is concordant and precise; allele abundance measured is correlated to the expected fraction of the specific alleles in the prepared control samples (Figure 3C and Figure 4A). Accuracy of the assay may be challenging to conclude from the mixing experiment using control DNA plasmids as such control samples were prepared with extensive dilution and pipetting steps which may introduce pipetting errors that can influence the result interpretation (Figure 1C and Figure 3C). Additionally, this can potentially be addressed by using linear DNA templates as controls to minimize supercoiling of template DNA prior to amplification, which may influence PCR amplification efficiencies15. Finally, the assay utilizes absolute quantification for analysis, in which the target concentrations were determined via Poisson distribution equations, hence fractional abundance of the alleles can be directly computed from target copy concentrations without needing to establish a standard curve. Taken together, our results demonstrated that a highly sensitive and specific ddPCR assay can be developed to quantify the mtDNA targets via absolute quantification.
The primer and probe design is critical for the assay to achieve proper detection of the target with the specificity and sensitivity needed for screening heteroplasmic and homoplasmic mtDNA alleles in single cell clones. It is crucial to evaluate the specificity of the probes at detecting the designed target variant using the appropriate control plasmids as inputs (Figure 2). In addition, the optimal DNA loading amount for the ddPCR reactions should be determined empirically to ensure sample overloading can be avoided and that the target copies do not exceed the total number of droplets generated (Figure 3A and Figure 3B). Lastly, the consistency of the ddPCR reaction droplets depends on how well the reagents are properly mixed in the ddPCR plates and precision of the pipetting. The master mix should be properly vortexed prior to adding into the ddPCR plate. Diluted samples should be vortexed and added to the ddPCR plate using multichannel pipettes to minimize sample-to-sample pipetting variabilities. DdPCR plates should be vortexed immediately prior to droplet generation.
The assay protocol could be further streamlined in future iterations, particularly by simplifying the sample quantification and preparation steps to improve throughput when screening large numbers of targets. In addition, 'rain'—the intermediate-amplitude droplets that fall between the clear positive and negative populations (Figure 2D and Figure 4A)—could be reduced by further optimizing the primer and probe designs, improving data accuracy and minimizing false-positive calls. In the current assay, however, rain is minimal and can be gated out by thresholding, as it appears at a lower amplitude than true positive signals. One improvement we suggest for future applications is to modify the control plasmid sequence from the targeted mtDNA sequence to include a restriction enzyme digestion step before ddPCR amplification to eliminate potential contamination from the control plasmids. The control plasmids should therefore include the restriction enzyme cut site within the amplification region but outside the primer/probe sequences.
To validate the accuracy of the ddPCR results, we further compared the on-target mtDNA editing level derived from ddPCR assay with the amplicon sequencing data at the MT-ATP6 locus. Despite the high-throughput nature of the assay, the ddPCR results are highly concordant with the sequencing results. We recommend researchers confirm their ddPCR results with orthogonal methods such as Sanger sequencing or next-generation sequencing approaches, especially during the assay development stage. Nevertheless, the assay has limitations. For example, the current design can only detect one specific edited allele at MT-ATP6 along with the wild-type and pathogenic mutant allele at the locus; however, it cannot detect other MT-ATP6 variants or variants at other mtDNA loci. Our results focused on detecting the most abundant base-editing outcome, including editing at the bystander position adjacent to the target nucleotide. Consequently, it cannot distinguish less frequent variants that carry on-target edits together with bystander edits at the extended nucleotide positions within the editing window. Detecting these additional bystander variants would require designing multiple variant-specific probes and evaluating them in multiplexed reactions on control plasmids to confirm detection specificity. Setting up these additional reactions for each editing variant would, however, reduce the assay's throughput in such applications. Future efforts to multiplex this assay while maintaining the high-throughput capability are needed. Currently, we are relying on sequencing approaches to identify these events.
In summary, this protocol provides strategies to develop an efficient, precise, sensitive, and high-throughput ddPCR assay for screening mtDNA alleles in single-cell clones. In addition to screening single-cell clones for cell line development, this assay can be used to screen mitoBEs to determine optimal designs and editing efficiencies across primary tissue samples in preclinical studies.
Disclosures
There are no conflicts of interest associated with this manuscript. No AI tools were used in the preparation of the manuscript or figures.
Acknowledgements
The ddPCR assay was performed at the UMass Chan Medical School AAV Large Scale Manufacture Facility. We thank Dr. Prashant Mishra’s laboratory at the UT Southwestern Medical Center for providing the A375 cell lines for testing this assay. This method was developed with support from the Eunice Kennedy Shriver National Institute of Child Health and Human Development (NICHD) K99/R00 Pathway to Independence Award (R00HD109359) to Q.L.
Materials
| Name | Company | Catalog Number | Comments |
|---|---|---|---|
| A375 human melanoma cell line | American Type Culture Collection (ATCC) | CRL-1619 | Established human melanoma cell line |
| Automated Droplet Generation Oil for Probes | Bio-Rad | 1864110 | |
| C1000 Touch Thermal Cycler with 96–Deep Well Reaction Module | Bio-Rad | 1851197 | |
| Centrifuge With 96-Well Plate Adapters | - | - | |
| ddPCR app v1.1 build (packages: shiny, dplyr, ggplot2, grid) | - | - | Custom R script for ddPCR analysis |
| ddPCR Buffer Control for Probes | Bio-Rad | 1863052 | |
| ddPCR Droplet Reader Oil | Bio-Rad | 1863004 | |
| ddPCR Plate | Bio-Rad | 12001925 | |
| ddPCR Supermix for Probes (No dUTP) | Bio-Rad | 186-3024 | |
| DG32 Automated Droplet Generator Cartridges | Bio-Rad | 1864108 | |
| FWD and REV ddPC_hMTATP6; ddPC_hMTATP6_2 PrimeTime Std qPCR Assay | Integrated DNA Technologies | Custom | Primers for WT, Mut_Edited and Mut allele amplification |
| Monarch Spin gDNA Extraction Kit | New England Biolabs | T3010L | |
| NanoDrop OneC Spectrophotometer | Thermo Scientific | - | |
| PCR Plate Heat Seal | Bio-Rad | 1814040 | |
| PCR Tubes | Celltreat Scientific Products | 230461 | |
| Pipet Tips for the AutoDG System | Bio-Rad | 1864120 | |
| Prb_Mut_Edited (FAM); Prb_Mut (FAM and HEX); Prb_WT (HEX) PrimeTime Std qPCR Assay | Integrated DNA Technologies | Custom | Probes |
| PX1 PCR Plate Sealer | Bio-Rad | 1814000 | |
| QuantaSoft 1.7.4 Software | Bio-Rad | - | Software for ddPCR acquisition |
| Quant-it dsDNA High Sensitivity (HS) Kit | Invitrogen | Q33120 | |
| QX Manager Software 2.4 Standard Edition | Bio-Rad | - | Software for ddPCR analysis |
| QX200 AutoDG Droplet Digital PCR System | Bio-Rad | 1864100 | |
| RStudio Ver. 2026.07.1+147 | Posit Software | - | |
| Tecan Infinite 200 Pro Plate Reader | Tecan | - | |
| UltraPure DNase/RNase-Free Distilled Water | Invitrogen | 10977015 | |
| Vortex Mixer | - | - | |
| WT Control; Mutant Control; Mut_Edited Control Plasmids | Twist Bioscience | Custom | Control DNA constructs |
References
- Milane L, Trivedi M, Singh A, Talekar M, Amiji M. Mitochondrial biology, targets, and drug delivery. Journal of Controlled Release. 2015;207:40–58.
- McBride HM, Neuspiel M, Wasiak S. Mitochondria: More Than Just a Powerhouse. Current Biology. 2006;16(14):R551–R560.
- Picard M, Wallace DC, Burelle Y. The rise of mitochondria in medicine. Mitochondrion. 2016;30:105–116.
- Hong Y, Song Y, Wang W, Shi J, Chen X. Mitochondrial DNA editing: Key to the treatment of neurodegenerative diseases. Genes & Diseases. 2025;12(4):101437.
- Schapira AHV. Mitochondrial disease. The Lancet. 2006;368(9529):70–82.
- Ganetzky RD, et al. MT-ATP6 mitochondrial disease variants: Phenotypic and biochemical features analysis in 218 published cases and cohort of 14 new cases. Human Mutation. 2019;40(5):499–515.
- Lim K. Mitochondrial genome editing: strategies, challenges, and applications. BMB Reports. 2024;57(1):19–29.
- Mok BY, et al. A bacterial cytidine deaminase toxin enables CRISPR-free mitochondrial base editing. Nature. 2020;583(7817):631–637.
- Barrera-Paez JD, et al. Correcting a pathogenic mitochondrial DNA mutation by base editing in mice. Science Translational Medicine. 2025;17(783):eadr0792.
- Hindson CM, et al. Absolute quantification by droplet digital PCR versus analog real-time PCR. Nature Methods. 2013;10(10):1003–1005.
- Hindson BJ, et al. High-Throughput Droplet Digital PCR System for Absolute Quantitation of DNA Copy Number. Analytical Chemistry. 2011;83(22):8604–8610.
- Quan P-L, Sauzade M, Brouzes E. dPCR: A Technology Review. Sensors. 2018;18(4):1271.
- Shelton SD, et al. Pathogenic mitochondrial DNA mutations inhibit melanoma metastasis. Science Advances. 2024;10(44):eadk8801.
- Shoop WK, Gorsuch CL, Bacman SR, Moraes CT. Precise and simultaneous quantification of mitochondrial DNA heteroplasmy and copy number by digital PCR. Journal of Biological Chemistry. 2022;298(11):102574.
- Chen J, Kadlubar FF, Chen JZ. DNA supercoiling suppresses real-time PCR: a new approach to the quantification of mitochondrial DNA damage and repair. Nucleic Acids Research. 2007;35(4):1377–1388.
Reprints and Permissions
This article has been published
Video Coming Soon