This protocol describes how to fabricate, program, and operate a 32-well light-emitting diode (LED)-embedded microplate for optogenetic studies (LEMOS 2.0) inside a microplate reader to enable high-throughput optogenetic stimulation and quantitative gene expression measurements in microbial cultures.
Method Article
Fabrication and Use of a 32-Well LED-Embedded Microplate for Optogenetic Dynamic Control
In This Article
Summary
Abstract
Optogenetic control enables light-actuated regulation of gene expression and provides a programmable interface between living cells and electronic systems. However, routine prototyping of optogenetic constructs remains limited by infrastructure. Existing closed-loop platforms often require chemostats, microfluidics, robotic handling, or custom optical sensors, which can increase cost, reduce accessibility, or constrain measurement performance.
Here, LEMOS 2.0 is presented, an updated light-emitting diode (LED)-embedded microplate for optogenetic studies, a low-cost device for optogenetic stimulation and gene-circuit characterization inside standard microplate readers. LEMOS 2.0 builds on the original LEMOS platform by increasing throughput from 16 to 32 microwells and reducing light leakage between adjacent microwells, enabling dark conditions as an additional illumination state. The device consists of a three-dimensional (3D)-printed frame, individually addressable LEDs positioned next to each microwell, a rechargeable battery, and an onboard microcontroller for Bluetooth-based wireless communication. Biocompatible polydimethylsiloxane (PDMS) microwells are cast directly into the device by replica molding, enabling the stimulation of bacterial cultures through the transparent mold. The device fits into standard plate readers, enabling optical density and fluorescence measurement.
This protocol describes the full LEMOS 2.0 workflow, including device fabrication, circuit assembly, Arduino programming, PDMS microwell casting, plate-reader setup, strain and culture preparation, automated experiment execution, device cleanup, and fluorescence/OD600 data analysis. As a demonstration, the protocol uses the CcaSR optogenetic system, in which sfGFP expression is activated by green light and repressed by red light. LEMOS 2.0 is intended to make optogenetic perturbation and gene-expression characterization more accessible to wet-lab users, enabling faster design-build-test-learn cycles without requiring specialized bioreactor or microfluidic infrastructure.
Introduction
Optogenetics provides a programmable interface between living cells and electronic control systems. By using light to regulate gene expression, cellular behavior can be actuated with temporal precision, reversibility, and minimal perturbation to the culture medium1. When paired with fluorescent or luminescent reporters, optogenetic systems allow biological states to be measured electronically and regulated through feedback1. This bidirectional optical interface has enabled cybergenetic control of cellular processes, including gene expression, cell growth, and population composition2,3,4. However, many successful closed-loop optogenetic systems require specialized chemostats5, microfluidic devices4,6,7, or robotic sampling2,3,8, which can limit accessibility and hinder routine design-build-test-learn cycles.
Microplate readers are among the most widely used instruments for measuring microbial growth and gene expression dynamics. They provide reliable optical density and fluorescence measurements across many samples, support environmental control, and are already integrated into standard synthetic biology workflows9. However, the illumination paths in standard commercial plate readers are designed for optical measurement, not for programmable, well-specific optogenetic actuation during culture growth. As a result, optogenetic experiments often require separate illumination devices10,11,12,13,14, robotic transfer between stimulation and measurement platforms8,15, or custom readout hardware5,16,17. These extra steps reduce temporal resolution, introduce handling variability, and complicate closed-loop control.
The LED-embedded microplate for optogenetic studies, or LEMOS, was previously developed to address this gap18. LEMOS is a microplate-reader-compatible device that contains individually addressable LEDs positioned around culture microwells. The device remains inside a commercial microplate reader throughout the experiment, allowing optical stimulation and fluorescence/optical density at 600 nm (OD600) measurement to occur in the same platform. In the original implementation, LEMOS supported 16 culture microwells and was used to demonstrate open-loop optogenetic stimulation and closed-loop feedback control of gene expression in batch culture18. The device was synchronized with an external computer so that LED illumination could be turned off during measurement windows, minimizing direct interference with fluorescence and optical density readings.
This protocol describes an updated version of the device, LEMOS 2.0, and its use for optogenetic experiments in microbial cultures. LEMOS 2.0 was redesigned to increase the number of independently addressable culture microwells from 16 to 32, improving experimental throughput and allowing more conditions, replicates, or controller designs to be tested in a single run. The device design was also modified to reduce light leakage between illuminated microwells and neighboring dark microwells, improving the reliability of dark controls and spatially patterned stimulation experiments. These modifications make the platform better suited for comparative optogenetic characterization, multi-condition controller testing, and routine protocol adoption by laboratories that already use microplate readers.
LEMOS 2.0 is designed for microbial batch-culture experiments that require repeated OD600 and fluorescence measurements with programmable red-, green-, blue-, or dark-state illumination. The plate reader must support kinetic OD600 and fluorescence measurements, temperature control, shaking, custom plate-layout definition for the 32 LEMOS microwells, and automated export of measurement files to a folder monitored by the Python control script. The current implementation was validated using a BioTek Synergy H1 microplate reader with BioTek Gen5 v3.14; implementation with other plate-reader software requires appropriate modifications to the export format, file parser, and screen-automation steps. Since the device uses LEDs with emission peaks at 620–630 nm, 515–525 nm, and 465–475 nm, users should select optogenetic actuators and fluorescent reporters whose actuation and readout spectra are compatible with these channels19,20. New host strains, reporters, optogenetic systems, media, growth temperatures, sampling intervals, or controller designs would likely require recalibration of LED intensity, duty-cycle range, blank correction, fluorescence normalization, and controller parameters.
The protocol covers the full LEMOS 2.0 workflow: device fabrication, circuit assembly, Arduino programming, polydimethylsiloxane (PDMS) microwell casting, plate-reader setup, strain and culture preparation, automated experiment execution, device cleanup, and fluorescence/OD600 data analysis. Although the example workflow focuses on bacterial optogenetic gene-expression control, the same framework can be adapted to other microbial strains, fluorescent reporters, optogenetic actuator systems, and control algorithms. By combining programmable illumination with standard plate-reader measurements, the updated LEMOS 2.0 platform provides an accessible route for high-throughput optogenetic perturbation and feedback-control experiments in batch cultures.
Protocol
All experimental procedures involving Escherichia coli strain MG1655 were performed in designated Biosafety Level 2 (BSL-2) laboratories at Texas A&M University. Bacterial cultures and manipulations were carried out in certified Class II Biosafety Cabinets in accordance with standard containment guidelines. Procedures were performed under designated containment conditions reviewed and approved by the Texas A&M Institutional Biosafety Committee (IBC) under permit number IBC2023-044.
1. Fabrication of the LEMOS 2.0 Frame and LED Array
NOTE: Begin fabricating LEMOS 2.0 by 3D-printing the LEMOS 2.0 frame and placing the LED strips into the device body. The goal is to generate a mechanically stable frame in which each LED is positioned next to the corresponding microwell. Correct LED placement at this stage is important because misalignment can reduce stimulation uniformity and increase optical crosstalk between microwells.
- 3D-print the LEMOS 2.0 inner frame and the casting mold for the PDMS microwells using the provided STL files in the GitHub repository (github.com/synbiosystems/LEMOS-2.0). Remove all support material after printing.
NOTE: It is recommended to use polylactic acid (PLA) filament and a fused deposition modelling (FDM) printer with the following printing parameters: 0.2 mm layer height, 20% infill for the LEMOS 2.0 frame, and 40% infill for the casting mold. - Cut the LED strips across the center of the soldering pads into 2 sets of 16 LEDs. Ensure each strip end has three soldering pads available for soldering, as discussed further in Section 2.
- Fold each LED strip in half, with the LEDs facing outward (Supplementary Figure 1A, Supplementary Video 1).
- Manually conform the LED strip to the device geometry and insert it between the microwells, with the +5 V soldering pads oriented downward, noting the arrow on the LED strip (Supplementary Figure 1A, Supplementary Video 1). Adjust the strip position iteratively until each LED is correctly seated in its slot before continuing.
2. Assembly and Validation of the Electrical Circuit
NOTE: Assemble the power, charging, microcontroller, switch, and LED connections required for wireless device operation. After assembly, the LEMOS 2.0 device should operate from the onboard battery, recharge through the charging module, and receive LED commands from the peripheral Arduino board. Verify each power connection before connecting the LED strips, as incorrect voltage routing can damage the microcontroller or LEDs.
CAUTION: The protocol requires prior proficiency in soldering, including appropriate safety practices (e.g., use of a smoke absorber, protective eyewear, and burn-prevention methods), soldering iron maintenance, and basic through-hole/wire-soldering techniques. Users without this experience should obtain training before attempting the steps in this section.
- Gather all electronic components listed in the Table of Materials and inspect for visible physical damage. Review the wiring diagram (Supplementary File 1).
- Configure the step-up voltage converter to output 5 V, instead of the default 12 V. Following the configuration key on the back of the board, disconnect pads A and B by applying heat from a soldering iron to remove the connection.
- Solder the Arduino Nano BLE Rev2 (referred to hereafter as BLE Nano) VIN pin to the step-up converter OUT+ pin and the BLE Nano GND pin to the step-up converter OUT- pin (Supplementary Figure 1B).
- Solder the step-up converter IN– pin to the battery charging module negative (-) pin.
- Separate the two wires of the 'JST PH 2-Pin Cable – Female Connector, 100 mm' by pulling the battery-connection ends from the white housing. Trim each to ~70 mm to better fit in the device by trimming from the non-battery-connection ends (Supplementary Figure 1C).
- Modify the switch. First, remove the mounting pins in each corner. Second, trim all pins to 30% of their length. Then, remove completely T1, T3, and B3 (Notation: T = top, B = bottom, numbered left to right from 1 to 4 when looking directly at the pins with the switch on top) (Supplementary Figure 1D).
- Solder the red JST cable to B2, leaving the battery-connection end exposed for connecting to the battery’s male connector later (Supplementary Figure 1D).
- Solder a connecting wire between B1 and B4.
- Solder the battery charging module B+ pin to B1, being careful to leave the connecting wire from the previous step also soldered to B1 (Supplementary Figure 1E).
- Solder the step-up converter IN+ pin to T4.
- Solder the battery charging module positive (+) pin to T2.
- Solder the black JST cable to the battery charging module B– pin. Leave the battery-connection end loose for later connection to the battery’s male connector.
- Verify connections under normal device operation mode. Connect the Li-ion battery to the circuit via battery connecting wires left loose in soldering steps, with the switch in the center/off position (Supplementary Figure 1E).
- Flip the switch to the left/on position (the side with only 2 occupied pins).
- Verify power to the BLE Nano via the onboard power LED (labeled ‘ON’, next to the USB port), which should turn green (Supplementary Figure 1E, Supplementary Video 1).
- Verify power to the step-up converter via its on-board LED, which should turn blue.
NOTE: If LED indicators do not illuminate, verify all connections with a multimeter before proceeding. - Remove the first LED strip (inserted in step 1.4) and solder wires to both sets of VIN, DIN, and GND pads. Reinsert the LED strip, feeding the wires through the port on the side of the frame (Supplementary Figure 1F, Supplementary Video 1).
- Repeat with the second LED strip, according to Supplementary Video 1.
- Solder the first LED strip to the BLE Nano GND pin, BLE Nano D13 pin, and BLE Nano VIN pin.
NOTE: Soldering to the VIN pin requires soldering two wires to the same Arduino pin. Solder one wire inside the pin hole, and the other to the outside of the pin hole, at the indentation in the Nano board. - Solder the two LED strips together.
- Verify connections with a multimeter in continuity mode by touching the VIN pin on the BLE Nano and the +5 V pad on the last unsoldered LED pad. Repeat for GND.
- Secure the LED strips in place using a hot glue gun (Supplementary Figure 1F, Supplementary Video 1). Move slowly, gluing only one or two LED pairs at a time, allowing the glue to cool between applications. Use tweezers as needed to hold the LEDs in place.
3. Programming the Central and Peripheral Arduino Boards
NOTE: Program the two Arduino boards used for wireless communication and LED control. The central Arduino (Arduino Nano IOT 33) is connected to the computer during an experiment, and it relays commands from the Python script. The peripheral Arduino (Arduino Nano 33 BLE Rev 2) is stationed in the LEMOS 2.0 device and controls the LED array. Both boards must be loaded with the appropriate sketches before starting an experiment. Visual indicators of successful connection to the other device are available by uncommenting the listed lines in the Arduino scripts: Central – Lines 34–37, Yellow LED flashes; Peripheral – Lines 99–106, Green LED flashes. Re-comment these lines after observing successful connections between devices. Otherwise, flashing LEDs may turn on while the device is inside the plate reader, potentially compromising the measurements.
- Download the Arduino files from the GitHub repository: LEMOS_Central.ino, LEMOS_Peripheral.ino. Download and install the latest version of the Arduino integrated development environment (IDE) from http://www.arduino.cc/en/software.
- Install the latest version of the board package from the Boards Manager (Tools > Board > Boards Manager) (Supplementary Figure 2A).
Central: Arduino SAMD Boards
Peripheral: Arduino Mbed OS Nano Boards - Install the following Arduino libraries in the Library Manager (Tools > Manage Libraries) (Supplementary Figure 2B): 'ArduinoBLE’ for Bluetooth Low Energy communication between both peripheral and central devices, and ‘Adafruit_NeoPixel’ for LED programming.
- Open the LEMOS_Central.ino Arduino file in the Arduino IDE.
- Connect the corresponding device to the computer via universal serial bus (USB) data cable.
- Select the correct COM port for the connected device (Tools > Port). If the COM port is unclear, observe which port appears and disappears when connecting and disconnecting the device.
- Select the Arduino Nano 33 IoT board from the board menu (Tools > Board).
- Upload the script to the device.
- Repeat for the LEMOS_Peripheral.ino file and peripheral device (Arduino Nano 33 BLE Rev 2).
4. Casting PDMS Microwells by Replica Molding
NOTE: Cast optically clear PDMS microwells directly inside the LEMOS 2.0 frame using replica molding21. The PDMS microwells hold the bacterial cultures during plate-reader experiments and must have clear, bubble-free bottoms for reliable OD600 and fluorescence measurements. Dust, bubbles, or incomplete curing can introduce well-to-well variation and should be avoided during casting. Ensure the fume hood surface is clean before casting, as any dust or debris in the PDMS will compromise its optical transparency and result in inconsistent OD600 readings across microwells.
CAUTION: Work in a fume hood when handling uncured PDMS. Avoid skin contact with the curing agent.
- Sanitize the interior of the LEMOS 2.0 frame where the microwells are cast by spraying 70% ethanol, avoiding direct contact with any electrical components other than the LEDs. Allow the LEMOS 2.0 frame to dry completely before casting PDMS microwells.
NOTE: Ethanol exposure to the LEDs is safe, but will damage all other electrical components. - Spray the casting mold for the PDMS microwells with a release agent, and wait 10 min for the spray to settle on the plastic surface. A second application after an additional 10 min can improve mold release, but it is optional.
NOTE: The release agent (e.g., Ease Release 200) will make the casting mold hydrophobic, allowing for easy removal of the casting mold from the cured PDMS microwells. - Weigh and mix the curing agent and base of 184 silicone elastomer to a 10:1 mass ratio of base to curing agent in a disposable plastic cup.
NOTE: It is recommended to use 2.5 g of curing agent + 25 g of base for a total of 27.5 g mixture for one LEMOS 2.0 device; scale up proportionally if casting multiple devices simultaneously. - Mix vigorously for at least 5 min using a disposable spatula or wooden stick, scraping the sides and bottom of the cup to ensure complete mixing.
NOTE: Thorough mixing is critical. Undermixed PDMS will not cure uniformly and will yield inconsistent baseline OD600 readings across microwells. - Place the cup containing the PDMS mixture in a vacuum desiccator. Apply vacuum (at least 65 cmHg /25 inHg) for 45–60 min, until all visible air bubbles have been removed from the mixture. The PDMS will expand as air bubbles rise to the surface and may overflow its cup. Use a container with at least 3× the volume of the mixture.
NOTE: Residual air bubbles in the cured PDMS will alter the optical transmission of the microwell bottoms, leading to inconsistent baseline OD600 measurements. - Secure the LEMOS 2.0 frame to the outer shell using binder clips of appropriate sizes on all four sides.
NOTE: The binder clips minimize the amount of PDMS that seeps into the gap between the outer shell and the LEMOS 2.0 frame. Excess PDMS in this gap can increase the overall device height and prevent the LEMOS 2.0 frame from sitting level within the outer shell. Placing Kapton tape along the bottom perimeter of the LEMOS 2.0 frame, adjacent to the microwells, can further reduce seepage. - Pour the degassed PDMS carefully into the LEMOS 2.0 frame. Use a syringe to add PDMS into each microwell in the frame to ensure they are filled with minimal bubbles.
NOTE: Formation of small bubbles is unavoidable; they will eventually rise to the surface and disappear. Pour the degassed PDMS immediately after degassing to minimize the reintroduction of bubbles during handling. - Insert the 3D-printed casting mold into the PDMS-filled frame. Press the mold gently and evenly, ensuring the circular protrusions in the casting mold sit in the holes of the LEMOS 2.0 frame. The mold defines square microwells aligned next to the LEDs. Wipe away excess PDMS that overflows from the edges with a clean lint-free wipe.
- Allow the PDMS to cure at room temperature (25 °C) on a level surface for a minimum of 30 h. If needed, accelerate curing by placing the device at 37 °C for 4 h, but only once all visible air bubbles have been removed from the PDMS.
CAUTION: Do not expose the LEMOS device to temperatures above 37 °C, as this may cause the onboard Li-ion battery to overheat and rupture. - Remove the casting mold after the PDMS microwells are cured by gripping it at the edges and pulling it up with a steady force. Ensure the PDMS microwells remain in the frame.
- Inspect each microwell to ensure that the walls are optically clear and the bottom is free of bubbles. The LEMOS 2.0 device with fresh PDMS microwells is now ready for use.
5. Configuring the Microplate Reader and Data Export Workflow
NOTE: Configure the microplate reader to obtain LEMOS 2.0-compatible kinetic measurements and automation of data export. The reader must recognize the custom LEMOS 2.0 microwell layout, acquire OD600 and fluorescence measurements at defined intervals, and export data files to the folder monitored by the Python control script. Perform a baseline measurement with sterile medium before biological experiments to confirm that the PDMS microwells and plate-reader settings produce consistent readings. This protocol uses a BioTek Synergy H1 microplate reader operated via BioTek Gen5 software v3.14.
- Launch Gen5.
- Go to Plate Types and import LEMOS 2.0.xml from GitHub, or alternatively set up the custom plate layout for LEMOS 2.0 in Gen5 by referring to Supplementary File 2 (Section 1) and Supplementary File 3.
- Perform a baseline measurement with the LEMOS 2.0 device (microwells filled with 200 µL of sterile M9CA media, covered with a medical-grade sealing film [e.g., Breathe-Easy film]). Record the OD600 and fluorescence baseline values for all 32 microwells and compare these values to those obtained from a standard 96-well microplate. If a large discrepancy is observed, re-cast the PDMS microwells, as bubbles or debris in the cured PDMS are the most likely cause.
NOTE: Breathe-Easy film is gas-permeable, maintaining aerobic conditions for cell growth, while remaining optically transparent to avoid interference with fluorescence and OD600 measurements. - Open the experiment protocol closed_loop_protocol.prt from the GitHub repository in Gen5.
NOTE: A pre-configured experiment file template.xpt is available in the GitHub repository for convenience. However, the settings are described in detail in Supplementary File 2 (Section 2) and Supplementary File 3 to provide a reference for troubleshooting for users with different versions of Gen5.
6. Preparation of Bacterial Cultures for LEMOS 2.0 Experiments
NOTE: Prepare bacterial cultures for a LEMOS 2.0 optogenetic time-course experiment. A cautious approach to culture preparation is important because starting density and pre-experiment light exposure can affect the measured gene-expression dynamics. The demonstration strain is Escherichia coli (E. coli) MG1655 carrying pSR58.6 and pNO286-322. pSR58.6 contains superfolder green fluorescent protein (sfgfp) under PcpcG2 and constitutive CcaR, chloramphenicol resistance, and a pColE1 origin. pNO286-3 contains constitutive CcaS, spectinomycin resistance, and a p15A origin. Together, these plasmids reconstitute a green-light-inducible, red-light-repressible gene expression system. pSR58.6 and pNO286-3 were transformed into chemically competent E. coli MG1655 using standard heat-shock transformation23. Plates were kept in a box to protect cells from ambient light to avoid premature activation of the optogenetic circuit.
- Inoculate a single colony of the CcaSR optogenetic strain and a fluorescence-negative control strain into separate 14 mL round-bottom culture tubes, each containing 2 mL of M9CA broth supplemented with 50 µg/mL spectinomycin and 25 µg/mL chloramphenicol. Use this media formulation for all subsequent culture steps throughout the experiment.
- Cover each tube with aluminum foil and incubate overnight (14–16 h) at 37 °C with shaking at 220 rpm.
NOTE: Foil wrapping maintains dark conditions and prevents unintended activation of the CcaSR system. Alternatively, cultures can be incubated under constant red light by housing the tubes in an LED enclosure wired with the same electrical setup described in section 2, which more closely mimics the repressed state of the system prior to the experiment. - Transfer 100 µL of each overnight culture into 2 mL of fresh media in a new foil-wrapped culture tube. Incubate for 4 h at 37 °C with shaking at 220 rpm.
- Measure the OD600 of each sub-culture after 4 h using the microplate reader.
NOTE: Cultures should have reached an OD600 of 0.4–0.6. - Dilute each culture to OD600 = 0.1 in fresh media, pipette 200 µL into each microwell of the LEMOS 2.0 device, taking care while pipetting to avoid the formation of air bubbles, and seal the device with a medical-grade sealing film.
7. Initiation of a LEMOS 2.0 Optogenetic Time-Course Experiment
NOTE: Start the automated LEMOS 2.0 experiment by coordinating the microplate reader, the central Arduino, and the Python control script. During the run, the computer coordinates plate-reader measurements, data export, Bluetooth communication, and LED actuation. It is critical that the Gen5 window remains visible, as the Python script uses screen-based automation to interact with the plate-reader software. A successful start is indicated by exported data files appearing in the expected folder, terminal output confirming Bluetooth communication, and LED commands updating at each control interval.
- Slide the switch to the left to power on the LEMOS 2.0 device. The first LED on the LED strip in LEMOS 2.0 will illuminate green.
- Connect the central Arduino to the computer via USB and select it in the Arduino IDE from the drop-down menu (Tools > Board).
- Open the Serial Monitor and connect the peripheral Arduino staged in LEMOS 2.0 to the central Arduino.
- Turn off the indicator LED on the LED strip by entering the letter 'o' into the serial monitor.
- Open the experiment file LEMOS-start-data.xpt in Gen5 and take a baseline reading of the cultures in the device, ensuring that the OD600 and fluorescence values are consistent with expectations. Close the experiment file.
- Open the protocol file saved in step 5.4 in Gen5 and save it as an experiment by referring to the Supplementary File 2 (Section 3) and Supplementary File 3.
- Ensure that Python 3.10 or newer is installed on the system, and install the required packages using the provided requirements.txt file.
- Open control_duty_cyle.py (for duty cycle experiments) or control_pid.py (for PID experiments) in any suitable IDE, such as Visual Studio Code or Spyder.
NOTE: Ensure the working directory is set to the folder containing all the Python scripts so they can be imported during script execution. The choice of IDE is not critical. - In the Main section of the python script, modify the file variable to match the filename chosen for the Gen5 experiment file in step 7.6.
- Set up the experiment file and Python script side by side (Figure 1).
- Click Run on the Gen5 experiment, then abort it once the kinetic step begins.
NOTE: The Python script looks for a Continue button after clicking Run. However, in a fresh experiment file, this button is not displayed until the second reading is taken or the kinetic run is aborted. - Run the Python script. Do not minimize or cover the Gen5 window during the run.
NOTE: The Python script uses screen-based automation and must be able to locate the Gen5 window approximately every 20 min to handle data export after each kinetic cycle. Obscuring or minimizing the window during this time may disrupt the experiment.
8. Device Cleaning, PDMS Removal, and Battery Recharging
NOTE: Clean and reset the LEMOS 2.0 device after the experiment. Remove the bacterial cultures and the used PDMS microwells, sanitize the reusable frame and shell, and recharge the battery for the next run. Avoid exposing the non-LED electronic components to ethanol or excessive mechanical force during cleaning.
- Gently peel the medical-grade sealing film from the top of the LEMOS 2.0 device and discard.
- Aspirate and discard all cell suspension fluid from each microwell using a pipette according to biological waste disposal procedures.
- Separate the outer shell from the LEMOS 2.0 frame by applying a steady, even force. Avoid excessive bending or twisting of the PLA frame, as this may cause cracking or permanent deformation.
- Peel away the bulk PDMS layer from the exterior of the frame and use tweezers to carefully remove PDMS microwells from the LEMOS 2.0 frame.
- Sanitize the LEMOS 2.0 frame and outer shell with 70% ethanol, avoiding direct contact with any electrical components other than the LEDs, as described in step 4.1.
- Recharge the Li-ion battery for the next experiment:
- Slide switch to the right/charging position.
- Connect USB to charging module.
- Confirm charging via the onboard LED, which will flash while charging (Supplementary Figure 1E).
9. Analyzing Fluorescence and Growth Dynamics
NOTE: Process the fluorescence and OD600 data generated during the LEMOS 2.0 experiment. The analysis notebook imports the exported plate-reader data, applies blank and negative-control corrections, calculates normalized fluorescence, and generates time-course plots. Before running the notebook, confirm that the microwell assignments and condition labels match the experimental layout.
- Open either FL_OD_Data_Analysis_Duty_Cycle.ipynb or FL_OD_Data_Analysis_PID.ipynb.
NOTE: This uses fluorescence (FL) and optical density (OD) data, which are stored in these files, generated during the run: Datafile/fl.csv and Datafile/od.csv. The PID analysis sheet also uses the errors of expression from the set point that are stored in Datafile/errors.csv. - Set the conditions variable with condition names and wells.
- Set neg_wells equal to a bracketed list of negative control microwell names.
- Set od_blank and fl_blank to averages across blank wells, or to known values if no blank was run.
- Set colors_4_figures to desired colors (full list of named colors available at https://matplotlib.org/stable/gallery/color/named_colors.html).
- Set figsize to the desired width and height of resultant figures in inches.
- Confirm filenames listed under Constants.
- Run the notebook, figures will be generated as .png files.
10. Troubleshooting
- During LED wiring, if the LED soldering pads break off, consider the following:
- Bend the corner of the LED strip to more easily fit the wires through the wiring port.
- If a stiffer (solid) wire was used, switch to a more flexible (stranded) wire.
- If the switch is turned on and the BLE Nano's power LED does not illuminate, consider the following:
- First, confirm whether the battery is charged. Set the switch to charging mode and connect the charging module to power. If charged, the indicator LED should stop flashing and turn solid green after a few minutes. If the battery was drained, allow it to charge fully before retrying.
- If the battery is charged and the LED still does not illuminate, use a multimeter to measure the voltage across the BLE Nano's VIN and GND pins.
- 0 V: A wiring connection is broken. Inspect each solder joint along the battery > switch > step-up converter > Nano path and re-flow any joint that looks cold or incomplete.
- 5 V: Power is reaching the Nano correctly, so the board itself may be damaged. Attempt to power the Nano via cable to confirm this. If the power LED still does not illuminate, solder a new Nano to replace the faulty Nano.
- Greater than 5 V: The step-up converter has not been configured to output 5 V. Confirm pads A and B have been disconnected on the step-up converter, as described in the device assembly section.
- If the Python script fails to run, consider the following:
- Confirm whether the Python script is opened from within its full project folder rather than as a standalone file; both control_duty_cycle.py and control_pid.py depend on other local modules and will fail if opened independently.
- Confirm that Arduino IDE is closed, since the Arduino can only have one active connection at a time. The operating system grants access to whichever program opens the port first.
- Confirm that the Gen5 protocol is set up correctly, especially if using different software. Refer to Supplementary File 2 (Section 2).
- Ensure the required packages are installed. Create a virtual environment and install the packages as listed in the requirements.txt file.
- If the experiment stops unexpectedly, consider the following:
- Stops after the first cycle: The Gen5 data export path is likely misconfigured. Confirm the export destination matches the folder the Python script expects to read from the file variable.
- Stops after several cycles: PyAutoGUI occasionally fails to recognize on-screen elements, often after a change in screen resolution, display scaling, or window size. Re-capture the reference screenshots used by the script and keep the Gen5 window active and in the foreground throughout the run; the Python IDE window can be minimized.
- In the event that Gen5 reports that the chamber temperature is outside the target range, allow the reader to equilibrate before continuing. Do not override the temperature warning, because doing so can trigger an audit report window that must be closed manually and may interrupt automation.
- If unusually high or inconsistent OD600/fluorescence baseline values across microwells are observed, consider the following:
- Inspect the PDMS microwells for trapped dust or debris, which scatters light and inflates readings.
- Avoid leaving PDMS uncovered and exposed to ambient air for extended periods before casting or use.
- If cells show no detectable response to light despite running the experiment, consider the following:
- Confirm LED "on" commands are being issued by checking both the IDE terminal output and the BLE communication log.
- If commands are being sent but no light is visible, check the LED soldering connections with a multimeter.
Results
LEMOS 2.0 is a 32-well, microplate-reader-compatible platform24 for programmable optogenetic stimulation and quantitative gene-expression measurement (Figure 2A,B). Each microwell is paired with an individually addressable WS2812B light-emitting diode (LED), controlled by an Arduino Nano 33 BLE Sense Rev2 through the Adafruit_NeoPixel library. The device communicates with an external computer through Bluetooth, allowing illumination commands to be updated during the experiment. Fresh PDMS microwells are cast into the device before use by replica molding (Figure 2C,D). E. coli cultures grown in LEMOS 2.0 at 30 °C under constant LED illumination showed reproducible growth across microwells, indicating that the device supports bacterial culture and plate-reader measurement over the experimental time course18 (Figure 2E). Furthermore, growth curves were similar across illumination conditions, indicating that LED exposure did not measurably affect cell growth under these settings.
To demonstrate optogenetic gene-expression control, the CcaSR v3.0 system was adopted22, a green-light-activated and red-light-repressed two-component system that controls sfGFP expression (Figure 3A). Under green light, CcaS autophosphorylates and transfers the phosphate to the response regulator CcaR, which dimerizes to activate the PcpcG2 promoter dependent sfGFP expression. Under red light, CcaS dephosphorylates, thereby reducing PcpcG2 activity and repressing sfGFP expression. The CcaSR plasmids were transformed into E. coli MG1655 and used for the experiments described in this protocol (Figure 3B). During the experiment, the microplate reader measured OD600 and fluorescence every 10 min. To prevent LED illumination from interfering with optical measurements, the LEDs were programmed to turn off during measurement windows at the beginning and end of each 10-min interval (Figure 3C).
The inter-well crosstalk was first evaluated by placing dark-condition microwells vertically or horizontally adjacent to microwells under constant green-light illumination (Figure 3D). Dark microwells adjacent to constant green-light microwells showed no significant increase in expression relative to dark microwells without illuminated neighboring microwells, indicating minimal light leakage between microwells. Based on these results, a pulse width modulation (PWM) value of 1 out of 255 was used for subsequent experiments to provide sufficient optical stimulation while minimizing inter-well crosstalk.
Open-loop stimulation was then used to define the actuating parameter for LEMOS-based optogenetic control. The actuating parameter was the green-light duty cycle, defined as the fraction of each active illumination window assigned to green light, with the remaining illumination time assigned to red light. Each control interval lasted 10 min, with LEDs active for 8 min and off for the remaining 2 min to avoid interference with plate-reader measurements. Green-light duty cycles from 5% to 80% produced graded sfGFP expression, showing that duty cycle can be used as a tunable input for optogenetic regulation (Figure 3E). The expression rate increased as the duty cycle rose from 5% to 40%, with no significant additional increase at higher duty cycles (Figure 3F), suggesting that the system approaches saturation under longer green-light stimulation.
Finally, closed-loop feedback control was implemented to test whether LEMOS 2.0 could dynamically regulate gene expression toward a defined set point25 (Figure 4A). The control system components were assigned as follows: actuator — LEDs, controller — external computer running the PID script, and measured output — sfGFP fluorescence normalized by OD600. The controller compared the measured FL/OD600 value with the assigned set point and updated the green-light duty cycle for the next 10-min interval. Proportional-integral-derivative (PID) control was implemented, where the duration of green light exposure in each cycle, tgreen, was computed as:

Here, e(t) is the error between the measured FL/OD600 signal and the set point at time t. K is the proportional gain, τI is the integral time constant, and τD is the derivative time constant. The closed-loop control parameters were selected using the gene expression across growth stages (GEAGS) model, which was previously reported26. Using these parameters, the measured signal approached and tracked the target FL/OD600 set point (Figure 4B).
The corresponding duty-cycle commands are shown in Figure 4C. Bar height represents the fraction of green light delivered during each 8-min illumination window. The duty-cycle command changed in discrete steps because the controller updated the input once every 10 min. As sfGFP expression approached the set point, green-light exposure decreased and red-light exposure increased. After the measured signal reached the set point, a low level of green-light input was still observed. This residual control input likely reflects the derivative term responding to the sharp change in expression rate near the set point. These results show that LEMOS 2.0 can implement model-guided PID feedback control of optogenetic gene expression in batch culture.
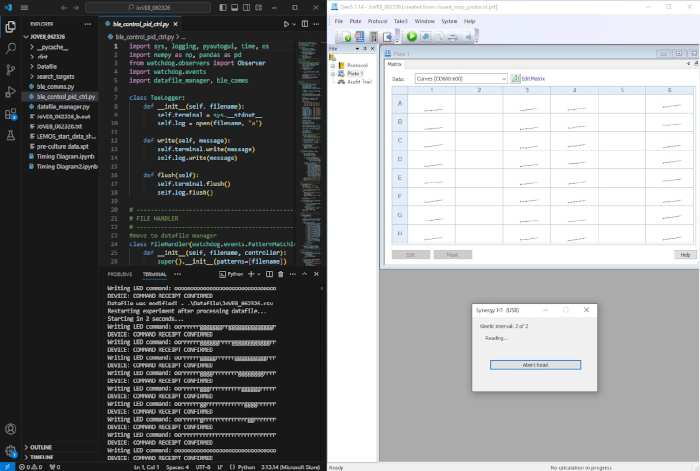
Figure 1: LEMOS 2.0 software setup during an experiment. Sample screenshot showing the Python control script running in VS Code (left), with LED commands populating in the terminal as they are sent to the Arduino microcontroller. The project directory containing the main script and associated function modules is visible in the file explorer panel. On the right, the plate reader software shows a kinetic measurement cycle in progress; at the end of each cycle, the Python script automatically triggers the next run via the Gen5 interface and updates the LED duty cycle commands accordingly. Please click here to view a larger version of this figure.
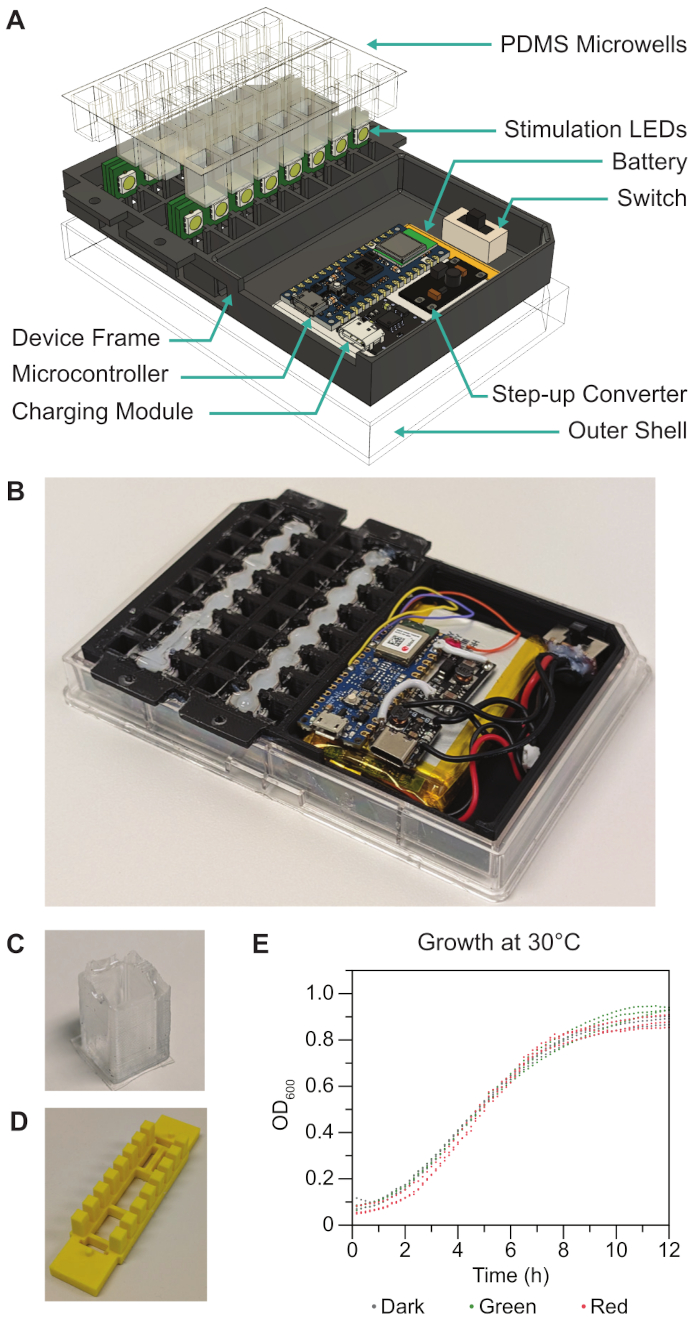
Figure 2: LEMOS device construction and cell growth characterization. (A) Exploded schematic of the LEMOS device showing PDMS microwells, stimulation LEDs, battery, switch, microcontroller, charging module, device frame, and outer shell. (B) Assembled device with PDMS microwells filled with deionized water. (C) PDMS microwell cast in the LEMOS device. Reproduced from Namboothiri et al. (2026)18, licensed under CC BY 4.0. (D) 3D-printed mold for casting microwells (E) Growth curves of E. coli in LEMOS at 30 °C (N = 3 technical replicates each for wells continuously illuminated with either green or red light, as well as maintained in the dark). Please click here to view a larger version of this figure.
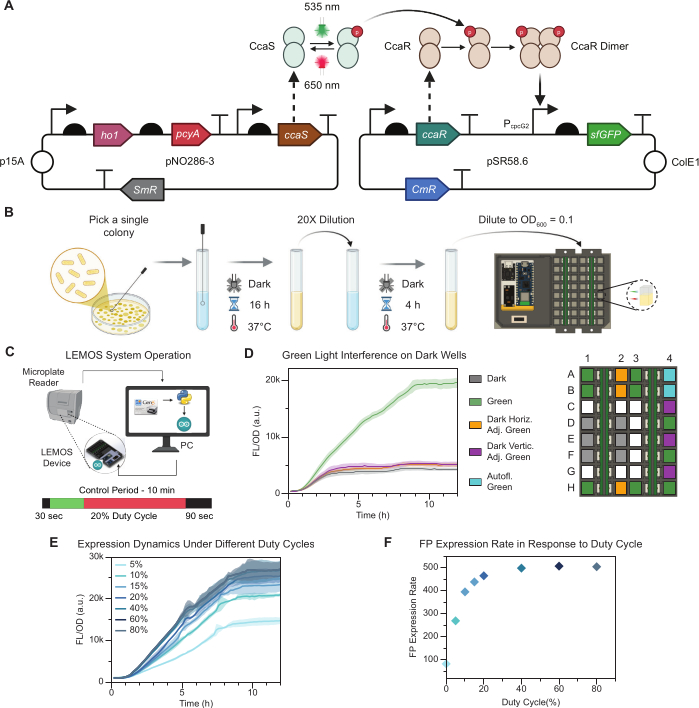
Figure 3: Optogenetic system characterization in LEMOS and open-loop control dynamics. (A) Plasmid map of the CcaSR two-component optogenetic system: green light (522 nm) activates CcaS/CcaR to upregulate sfGFP expression, and red light (620 nm) downregulates the expression. (B) Protocol for carrying out optogenetic experiments with CcaSR Optogenetic system. (C) LEMOS operation schematic. During the 12-h time course, the device remains in the microplate reader. The reader measures sfGFP fluorescence and OD600, then streams data to a computer, which handles timekeeping and operates Arduino sketches. The Arduino sketches that command the onboard microcontroller to temporarily disable LED illumination during each measurement. Adapted from Namboothiri et al. (2026)18, licensed under CC BY 4.0. (D) Effect of green-light interference on unstimulated cells in the dark condition. In the plate layout, green boxes indicate green-light microwells (N = 9), grey boxes indicate microwells in the dark condition with no light interfering in the surrounding microwells (N = 6), purple boxes indicate dark microwells (N = 3) vertically adjacent to green-light microwells, yellow boxes indicate dark microwells (N = 3) horizontally adjacent to green-light microwells, and blue boxes indicate green-light microwells (N = 2) with a control strain to measure autofluorescence. (E) Open-loop responses in LEMOS to varying green-light duty cycles (5–80%, N = 3) as the actuating parameter. Solid lines indicate means; shaded bands indicate standard deviations. (F) Average rate of expression during the exponential phase of growth with varying duty cycle. N denotes the number of technical replicates. Please click here to view a larger version of this figure.
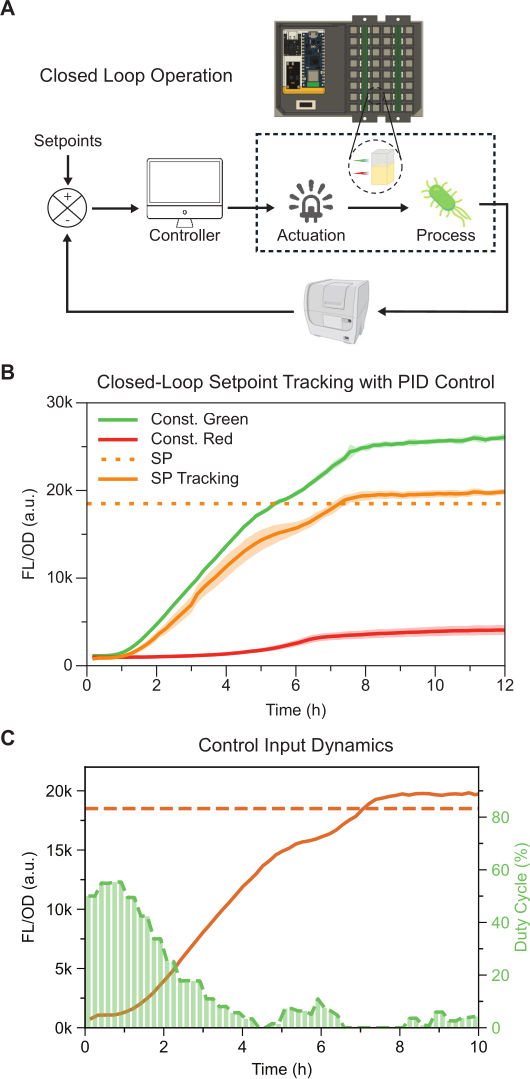
Figure 4: Closed-loop feedback control in LEMOS 2.0. (A) Schematic of closed-loop operation: the microplate reader functions as the sensor that measures FL/OD600, the computer functions as the controller, and the LEMOS 2.0 device actuates LEDs to regulate gene expression. The process is gene expression in living bacterial cells. Adapted from Namboothiri et al. (2026)18, licensed under CC BY 4.0. (B) Proportional integral derivative (PID) control tracking of FL/OD600 set point (SP = 18.5 × 10⁵ a.u.). Constant-light references are green and red (N = 3). The set point tracking runs are described by orange lines (N = 3). Solid lines indicate the mean FL/OD600; shaded bands indicate standard deviations. The dotted line marks the set point. (C) Representative duty-cycle commands generated by the PID controller during closed-loop setpoint tracking. Bar height indicates the fraction of green light delivered during each illumination interval. N denotes the number of technical replicates. Please click here to view a larger version of this figure.
| Platform | Culture format | Readout | Feedback control demonstrated | Growth format | Constraint addressed by LEMOS 2.0 | |
| LEMOS 2.0 | 32 PDMS microwells in plate reader | Commercial plate reader | Model-guided PID set-point tracking | Shaken batch culture | This study | This study |
| LEMOS 1.0 | 16 PDMS microwells in plate reader | Commercial plate reader | Model-guided PI and PID set-point tracking | Shaken batch culture | Lower throughput; limited dark-condition compatibility | 18 |
| Automated turbidostat + robotic sampling | Turbidostat | Flow cytometry + OD sensor | PI, PID, MPC set-point tracking | Continuous culture | Requires robotic sampling; measurement-actuation delay | 2, 3 |
| Mother-machine microscopy | Single-cell microfluidics | Live-cell microscopy | Single-cell feedback / MPC | Continuous perfusion | Requires specialized microfluidics and microscopy | 4, 6, 7 |
| Chi.Bio | Miniaturized turbidostat | Built-in OD/FL sensors | PI set-point tracking | Continuous culture | Built-in sensor dynamic range constrains fluorescence-feedback performance | 5 |
| Light Tube Array | Culture tubes | External OD/flow cytometry | Open-loop only | Shaken batch culture | Manual sampling; limited online growth readout | 10 |
| LAVA / LITOS / RainbowCap / Diya | Multiwell illumination devices | Commercial plate reader | Open-loop only | Batch culture | Separate stimulation/readout; limited automation | 12, 13, 14, 15 |
| Lustro | 96-well plate illumination | Commercial plate reader | Open-loop only | Batch culture | Requires robotic transfer between stimulation and readout | 8 |
| RT-OGENE | Multiwell/microfluidic-compatible stage | Camera-based OD/FL | Closed-loop attempted; limited by readout | Static batch culture | Camera-based readout and static culture constrain control performance | 16 |
| optoPlateReader | Custom 96-well reader/stimulator | Built-in photodiodes | Bang-bang set-point tracking | Shaken batch culture | Reporter/filter dependence and lower fluorescence sensitivity constrain readout flexibility | 11,17 |
Table 1: Comparison of LEMOS 2.0 with existing optogenetic platforms2,3,4,5,6,7,8,10,11,12,13,14,15,16,17,18.
Supplementary Figure 1: Assembly images. (A) Bent LED strip and molded strip inside the device. (B) Nano BLE Sense Rev 2 soldered to step-up converter, which is soldered to the battery charging module. (C) Original and modified versions of the ‘JST PH 2-Pin Cable – Female Connector 100mm’. (D) Original switch, modified switch, soldered red JST PH cable, and short jumper soldered between two pins on either side of the bottom row. (E) Incorporation of the switch into the circuit assembly and powering the circuit. (F) Side view of LEDs and LED strips positioned with hot glue. Please click here to download this file.
Supplementary Figure 2: Arduino IDE setup screenshots. (A) Boards Manager screenshot, showing a search for one of the required boards. (B) Library Manager screenshot, showing two of the required libraries. Please click here to download this file.
Supplementary File 1. LEMOS Wiring Diagram. Please click here to download this file.
Supplementary File 2: Protocol for setting a custom plate layout for LEMOS 2.0 in Gen5. Please click here to download this file.
Supplementary File 3: Screenshots of the software steps described in Supplementary File 2. Please click here to download this file.
Supplementary Video 1: Assembly video with the following steps. LED strip manipulation into the frame, securing the LED strip with hot glue, wire arrangement both to and between LED strips, and final assembly with electronic circuitry. Please click here to download this file.
Discussion
This protocol describes the fabrication and operation of LEMOS 2.0, a 32-well LED-embedded microplate for optogenetic stimulation and feedback-control experiments inside a standard microplate reader. Representative experiments demonstrate that LEMOS 2.0 supports microbial growth (Figure 2E) with no significant phototoxicity observed under illumination. Additionally, LEMOS 2.0 reduces light leakage into adjacent dark-condition microwells (Figure 3D), thereby improving the reliability of dark controls and spatially patterned stimulation experiments. Furthermore, LEMOS 2.0 enables duty-cycle-based optogenetic actuation (Figure 3E) and implements closed-loop PID control of gene expression in batch cultures (Figure 4B).
Photobleaching is an important consideration in optogenetic experiments because the same optical workflow is used for both actuation and fluorescence readout27. LEMOS 2.0 uses commercial RGB LEDs containing three diodes with emission peaks at 620–630 nm (red), 515–525 nm (green), and 465–475 nm (blue)19. Therefore, reporter selection and LED operating intensity should be chosen to minimize spectral overlap between the actuation wavelengths and the excitation spectrum of the fluorescent reporter, while maintaining sufficient light input for optogenetic regulation. In this protocol, the CcaSR system was used, whose green- and red-light responses fall within the broad activation and deactivation bands reported for this system22, and measured sfGFP fluorescence using 485 nm excitation. Since the green and red actuation wavelengths used for CcaSR control are separated from the sfGFP excitation wavelength, and because LED output was minimized to a PWM intensity of 1 out of 255 while still producing robust optogenetic regulation, photobleaching from LED actuation is expected to be limited. Some photobleaching may still occur during long time-course experiments; however, under the conditions used here, it was not large enough to obscure the measured optogenetic induction, duty-cycle response, or closed-loop tracking dynamics20.
Several steps are critical for reliable performance. During fabrication, each LED must be aligned with the corresponding microwell to maintain stimulation uniformity and reduce optical crosstalk. During circuit assembly, the step-up converter must be configured to 5 V before connecting the microcontroller and LED strips. PDMS casting also requires special care, because bubbles, dust, debris, or incomplete curing can alter optical transmission through the microwell bottoms and produce inconsistent OD600 or fluorescence baselines28. A baseline measurement with sterile medium should therefore be performed before biological experiments. If large discrepancies in OD600 readings are observed across wells relative to the rest of the plate, the affected wells should be inspected for fabrication issues mentioned earlier. Depending on the severity, those microwells should either be excluded from the analysis or the microwells should be recast altogether.
Software configuration is another common source of failed experiments. The current workflow depends on the coordinated operation of the plate-reader method, Gen5 data export, the Python control script, and Bluetooth communication between the central and peripheral Arduino boards. The export path and file format must match the structure expected by the Python script, and the Gen5 window must remain visible during the run because the automation uses screen-based interactions. Prior to starting an experiment, the LEMOS device should be connected to the central Arduino, and a test routine should be run to verify that all LEDs illuminate correctly; any non-responsive LEDs should be identified and addressed before loading bacterial cultures, as undetected failures would result in uncontrolled illumination conditions during the experiment. Users adapting the workflow to another plate-reader model or software package should preserve the same timing, measurement, export, and parsing logic while modifying the automation layer as needed.
LEMOS closes the loop by enabling automated actuation synced with measurement intervals18. Here, the initial LEMOS device is updated by doubling the amount of wells to increase throughput. Additionally, revised microwell geometry minimizes inter-well light leakage, enabling optogenetic circuits to be tested under dark conditions alongside illuminated conditions in the same experiment. LEMOS 2.0 currently supports batch-culture experiments. Since growth rate, resource availability, and gene-expression dynamics change during batch culture, parameters such as LED intensity, duty-cycle range, sampling interval, and controller parameters may need to be recalibrated for other strains, reporters, optogenetic systems, or growth conditions20. A detailed comparison of LEMOS 2.0 with previously developed platforms for carrying out optogenetic studies is provided in Table 1. Future versions could incorporate in-plate channels or reservoirs for controlled medium exchange and dilution, allowing longer experiments while maintaining more consistent growth conditions. Additional designs could also support alternative LED wavelengths or reduce dependence on screen-based software automation.
Disclosures
The authors have no conflicts of interest to disclose.
Acknowledgements
The authors B.J., T.S.B., and H.R.N. were supported by the Texas A&M Engineering Experiment Station.
Materials
| Name | Company | Catalog Number | Comments |
|---|---|---|---|
| 22 AWG stranded hookup wire | Amazon | ASIN: B089CQ2N69 | Inexpensive wire to connect the electrical circuit. Solid or stranded wire is acceptable. |
| 8 Pin 3 Position 2P3T DP3T Slide Switch Side Knob | Amazon | ASIN: B007Q9Y8YC | Switch and pins should be on adjacent sides, not opposite, as is more commmon. |
| Arduino Nano 33 BLE Rev 2 | Arduino | ABX00071 | Microcontroller – Flat profile and BLE capability suits the peripheral device needs. |
| Arduino Nano 33 IoT | Arduino | ABX00027 | Microcontroller – Used as the central device. |
| BioTek Synergy H1 microplate reader | Agilent (BioTek) | — | Or compatible plate reader with kinetic mode |
| Breathe-Easy sealing film | USA Scientific | 9123-6100 | Medical-grade sealing film; Gas-permeable microplate seal |
| Chloramphenicol (25 mg/mL stock in ethanol) | Various | — | Working conc. 25 µg/mL |
| E. coli MG1655 | |||
| Ease Release 200 | Mann Release Technologies | Release agent | |
| Kapton Tape | Amazon | ASIN: B07F8TZZ4N | |
| LB agar plates and appropriate antibiotics | In-house | — | It is assumed that these are already present. |
| Li-ion 3.7 V battery, 3000 mAh (11.1 Wh), size 104060 | Ufine | UFX0391-03 | Should come with JST PH 2-Pin Cable Male. Manufactured by Liter Energy, sold by various retailers. |
| Li-ion battery charge and discharge module with Type-C USB (5V 1A) | Amazon | ASIN: B0CTMJMRKZ | Search "Replaces TP4056" on Amazon. Scroll past the standard TP4056 modules. Stop at any listing showing the smaller, black modules that read "Replaces TP4056" in the title. |
| Li-ion JST PH 2-Pin Cable – Female Connector 100 mm | Various | ASIN: B07NWNPB77 | Must be compatible with the battery’s JST connector. |
| Mini Boost Module 3.7 V to 5 V/8 V/9 V/12 V Step Up Board with LED indicator | Amazon (Teyleten Robot) | ASIN: B0B4TB9QNY | [https://a.co/d/03ASKZPq](https://a.co/d/03ASKZPq) |
| Nunc OmniTray Single-Well Plate | Thermo Scientific | 242811 | Outer Shell |
| pNO286-3 | Addgene | Plasmid #107746 | Encodes constitutive CcaS expression |
| pSR58.6 | Addgene | Plasmid #63176 | Encodes constitutive CcaR expression and sfGFP under the PcpcG2 promoter |
| Soldering iron and solder | Various | — | Recommendations: Fine tip, flux or rosin core solder. |
| Spectinomycin (50 mg/mL stock) | Various | — | Working conc. 50 µg/mL |
| Sterile culture tubes (14 mL round-bottom) | Various | — | |
| SYLGARD 184 silicone elastomer (base + curing agent) | SYLGARD 184 | 1:10 curing\:base by mass | |
| USB-A to Micro USB cable | Various | — | For connecting Arduino Boards to the PC. Must be a data-transfer wire, not simply a charging wire. |
| USB-A to USB-C Charging Cable | Various | — | Connects to the battery charging module |
| Vacuum desiccator and pump | Various | — | For degassing PDMS |
| WS2812B IC SPI RGB Pixel LED Strip, 100LED/m, DC5V, IP30, Black | Amazon (BTF-LIGHTING) | ASIN: B088B8G8LD ; BTF-LIGHTING Part No.: WS2812B1M100LB30 | Individually Accessible LED Strip. 100 LED/m. Voltage: 5 V. IP30 refers to water resistance. Black is preferred over white to reflect less light. |
References
- Kumar S, Khammash M. Platforms for optogenetic stimulation and feedback control. Front Bioeng Biotechnol. 2022;10:918917.
- Milias-Argeitis A, et al. Automated optogenetic feedback control for precise and robust regulation of gene expression and cell growth. Nat Commun. 2016;7:12546.
- Gutierrez Mena J, Kumar S, Khammash M. Dynamic cybergenetic control of bacterial co-culture composition via optogenetic feedback. Nat Commun. 2022;13(1):4808.
- Lugagne JB, Blassick CM, Dunlop MJ. Deep model predictive control of gene expression in thousands of single cells. Nat Commun. 2024;15(1):2148.
- Steel H, Habgood R, Kelly CL, Papachristodoulou A. In situ characterisation and manipulation of biological systems with Chi.Bio. PLoS Biol. 2020;18(7):e3000794.
- Lugagne JB, et al. Balancing a genetic toggle switch by real-time feedback control and periodic forcing. Nat Commun. 2017;8(1):1671.
- Chait R, et al. Shaping bacterial population behavior through computer-interfaced control of individual cells. Nat Commun. 2017;8(1):1535.
- Harmer ZP, McClean MN. Lustro: High-throughput optogenetic experiments enabled by automation and a yeast optogenetic toolkit (vol 12, pg 1943, 2023). ACS Synth Biol. 2023;12(11):3505.
- Abkar L, et al. Enhanced reproducibility and precision of high-throughput quantification of bacterial growth data using a microplate reader. J Vis Exp. 2022;185:63849.
- Olson EJ, et al. Characterizing bacterial gene circuit dynamics with optically programmed gene expression signals. Nat Methods. 2014;11(4):449-456.
- Bugaj LJ, Lim WA. High-throughput multicolor optogenetics in microwell plates. Nat Protoc. 2019;14(7):2205-2228.
- Repina NA, et al. Engineered illumination devices for optogenetic control of cellular signaling dynamics. Cell Rep. 2020;31(10):107737.
- Höhener TC, et al. LITOS: A versatile LED illumination tool for optogenetic stimulation. Sci Rep. 2022;12(1):13139.
- Vogt A, et al. Simultaneous spectral illumination of microplates for high-throughput optogenetics and photobiology. Biol Chem. 2024;405(11-12):751-763.
- Kumar S, et al. Diya: A universal light illumination platform for multiwell plate cultures. iScience. 2023;26(10):107862.
- Soffer G, Perry JM, Shih SCC. Real-time optogenetics system for controlling gene expression using a model-based design. Anal Chem. 2021;93(6):3181-3188.
- Benman W, et al. High-throughput feedback-enabled optogenetic stimulation and spectroscopy in microwell plates. Commun Biol. 2023;6(1):1192.
- Namboothiri HR, et al. Closed-loop optogenetic control in a microplate reader. ACS Synth Biol. 2026;15(6):2356-2365.
- Worldsemi. WS2812B intelligent control LED integrated light source. 2026: https://cdn-shop.adafruit.com/datasheets/WS2812B.pdf
- Lambert TJ. FPbase: A community-editable fluorescent protein database. Nat Methods. 2019;16(4):277-278.
- Xia YN, et al. Replica molding using polymeric materials: A practical step toward nanomanufacturing. Adv Mater. 1997;9(2):147-149.
- Ong NT, Tabor JJ. A miniaturized Escherichia coli green light sensor with high dynamic range. ChemBioChem. 2018;19(12):1255-1258.
- Hanahan D, Jessee J, Bloom FR. Plasmid transformation of Escherichia coli and other bacteria. Methods Enzymol. 1991;204:63-113.
- ANSI SLAS 1-2004 (R2012). Footprint dimensions. At https://www.slas.org/SLAS/assets/File/public/standards/ANSI_SLAS_1-2004_FootprintDimensions.pdf.
- Åström KJ, Murray RM. Feedback systems: An introduction for scientists and engineers. Princeton University Press; Princeton, NJ; 2008.
- Namboothiri HR, Pandey A, Hu CY. Resolving emergent transient oscillations in gene circuits with a growth-coupled model. Sci Adv. 2026;12(6):eadz2310.
- Song LL, Hennink EJ, Young IT, Tanke HJ. Photobleaching kinetics of fluorescein in quantitative fluorescence microscopy. Biophys J. 1995;68(6):2588-2600.
- Campbell DJ, et al. Replication and compression of bulk and surface structures with polydimethylsiloxane elastomer. J Chem Educ. 1999;76(4):537-541.
Reprints and Permissions
This article has been published
Video Coming Soon