This protocol integrates multimodal behavioral records to assess observable correlates of cognitive effort and the functional effectiveness of revision in English-Chinese written translation and sight interpreting. It combines keystroke logging, screen capture, audio analysis, transcript-based coding, and standardized quality assessment.
Method Article
A Behavioral Protocol for Assessing Cognitive Effort and Strategic Revision in English-Chinese Translation and Sight Interpreting Tasks
In This Article
Summary
Abstract
This article presents a multimodal behavioral protocol for examining observable correlates of cognitive effort and strategic revision during English-Chinese written translation and sight interpreting. Keystroke logs and screen recordings are synchronized for written translation, whereas audio recordings and verbatim transcripts are used for sight interpreting. Revision and self-repair episodes are coded by type and by functional outcome (effective, neutral, or detrimental) independently of holistic output-quality ratings. In a demonstration with 62 participants assigned to novice and trained groups, both groups completed the two task conditions in counterbalanced order. Trained participants had higher mean output-quality scores in written translation (20.1 ± 2.1 vs. 16.8 ± 2.3) and sight interpreting (18.9 ± 2.4 vs. 15.4 ± 2.6), and a larger proportion of effective revisions or self-repairs. Because pauses, deletions, onset latency, and revision density are indirect and task-sensitive, they are interpreted as behavioral correlates that require triangulation rather than as direct measures of a unitary construct. The protocol is intended for controlled expository texts and can be adapted to other language pairs after recalibrating input-method handling, pause thresholds, text comparability, and scoring procedures.
Introduction
English-Chinese written translation and sight interpreting require source-text comprehension, cross-linguistic transfer, and target-language formulation, but they impose different task conditions. Written translation permits recursive reading and delayed editing, whereas sight interpreting requires oral production under tighter temporal constraints. Cognitive load, processing difficulty, and cognitive effort are related but non-interchangeable constructs: load concerns task demands, while effort concerns the resources a participant invests under those demands. Cognitive effort is latent and multidimensional; therefore, latency, pauses, deletions, and revision density are treated here as behavioral correlates that may reflect planning, monitoring, motor processes, or difficulty and must be interpreted jointly rather than as direct measurements of effort1,2,3,4,5,6,7,8.
Process-oriented research combines product scores with time-aligned behavioral records to identify when and how translation decisions occur. Keystroke logging is informative for production and revision sequences, but Chinese input-method composition can separate physical key events from committed characters; synchronized screen recording is therefore needed to reconstruct the visible text state9,10,11. Pause thresholds are analytical choices rather than universal cognitive boundaries, and shorter thresholds can materially change pause-based conclusions8,12. The protocol consequently requires explicit synchronization checks, threshold sensitivity analyses, and separation of task-specific from shared measures.
Revision frequency alone does not indicate whether monitoring improves an output. Written revisions and oral self-repairs can target lexical choice, syntax, meaning, or style, but their functional outcome must be judged against the source meaning and the immediately preceding target segment. Sight-interpreting research on English-Chinese and Chinese-English processing shows that training, directionality, eye-voice coordination, and language-specific problem triggers can alter performance patterns13,14,15,16. For this reason, episode type, episode outcome, final product quality, and delivery-related behavior are coded as separate variables.
The protocol is designed for adult learners or trained translators/interpreters working with short, non-specialist expository texts in controlled computer-based sessions. It is most suitable when keystroke and screen records can be captured for written production, and high-quality audio can be recorded for oral production. The framework can be adapted to other language pairs, but text matching, segmentation into information units, keyboard or input-method behavior, pause thresholds, and rating anchors must be revalidated for each language pair and writing system17. The demonstration compares task conditions rather than attributing all differences to modality alone, because text length, time limits, output mode, and revision opportunities also differ.
Protocol
All methods that involve the use of human subjects were performed in compliance with institutional guidelines and received explicit approval from the Human Research Ethics Committee of Guilin Institute of Information Technology (Approval No. UYHAJ2025899). Written informed consent was obtained from all participants prior to their participation. Please refer to the Table of Materials for a comprehensive list of the equipment and software used in this study.
1. Participant recruitment and group assignment
- Recruit 62 participants, comprising English or translation majors and professional interpreter trainees. Verify that all participants are native Chinese speakers possessing normal or corrected-to-normal vision and hearing.
- Assign participants with less than 12 months of structured translation training to the novice group, and assign those with at least 12 months to the trained group. Report prior written translation and sight-interpreting practice separately for all participants.
- Screen participants before task assignment to exclude those with prior exposure to the source texts, uncorrected sensory impairment, or an inability to use the standardized Chinese input method.
- Exclude tasks post-recording only for prespecified reasons, such as prohibited external-tool use, incomplete execution, corrupted files, or unusable audio.
- Maintain a task exclusion log without personally identifying information. Report the final analyzed sample consistently in the text and Figure 1A–D.
2. Material selection and pilot evaluation
- Select short English expository texts from general academic, educational, social, or public-communication domains. Use written-translation texts of approximately 180–220 words and sight-interpreting texts of approximately 120–160 words.
- Match or statistically adjust text length, lexical difficulty, syntactic complexity, information density, and topic familiarity across task conditions.
- Instruct three bilingual experts to independently rate lexical difficulty, syntactic complexity, information density, topic familiarity, and transfer suitability on a 1-to-5 point scale (1 = very low, 5 = very high).
- Calculate a two-way random-effects intraclass correlation coefficient (ICC) with a 95% confidence interval for the averaged ratings. Revise items demonstrating poor agreement (ICC < 0.75).
- Retain text pairs only when the standardized matching variables fall within a ±10% tolerance margin.
- Define an information unit as the smallest source-text proposition that expresses one independently scoreable idea, relation, or event. Resolve boundary disagreements before task administration.
- Pilot the instructions, input method, synchronization, sound quality, and time limits with participants who are not included in the main analysis. Record completion-time distributions and the proportion reaching each time limit.
- Revise a text or time limit when pilot participants show ceiling/floor performance, persistent ambiguity, or recording instability. Document every change prior to launching the main study.
3. Task administration and recording setup
- Test participants individually in a quiet, sound-attenuated room using standardized hardware and software configurations.
- Read a standardized instruction script and allow one non-experimental practice item. Prohibit dictionaries, search engines, generative artificial intelligence, machine translation, and external corpora.
- Counterbalance the two task orders (written translation first vs. sight interpreting first) within each training group and maintain a 5-minute rest interval.
- Prepare the allocation list before recruitment completion and conceal the assignment until eligibility is confirmed. If multiple source texts are used, counterbalance text identity independently of task order and retain a text-ID variable for analysis.
- Present the English source text continuously and instruct the participant to produce an accurate, natural Chinese translation in the designated input field. Permit unrestricted editing but strictly prohibit pasted external text.
- Apply the 20-minute ceiling established in the pilot without displaying a countdown clock, and record whether the ceiling is reached.
- Capture the entirety of the written translation process continuously, utilizing keystroke logging software synchronized with continuous screen recording. Retain the final translation outputs alongside the time-stamped log files for subsequent behavioral extraction.
- Present the sight-interpreting source text on screen and instruct the participant to begin an oral Chinese rendition without written notes.
- Apply the 6-minute ceiling consistently and record whether this ceiling is reached. Distinguish a time-limited observation from an ordinarily completed observation.
- Record the oral output using digital audio capture software. Generate rigorous verbatim transcripts from these recordings to facilitate subsequent coding.
4. Extraction of behavioral process indicators
- Extract written-task behavioral correlates from the log files, defining initial latency as the interval from stimulus onset to the first committed Chinese character.
- Extract total task time, pause count and duration, deletion rate, revision density, and production rate. Retain the raw timestamps and the exact denominator used for each normalized measure.
- Use 2 s as the operational written-pause threshold. Report whether pauses during cursor navigation, text selection, or input-method candidate selection are included.
- Extract oral-task behavioral correlates from the waveform and verified transcript, defining onset latency as the interval from stimulus presentation to the first meaningful target-language utterance.
- Exclude inhalation, throat clearing, and abandoned nonlexical sounds from onset latency. Extract total interpreting time, silent pauses, filled pauses, repetitions, false starts, self-repairs, and speech rate.
- Define an oral silent pause as a within-utterance silence of at least 1.0 s. Inspect pause boundaries against the waveform and verified transcript, and exclude leading and trailing silence from within-utterance pause counts.
- Complete a quality-control record for every administered task. Document whether the applicable process file is readable and complete, whether the transcript has been verified, and whether coding has been completed or adjudicated. Preserve the original record and track any corrections in the audit trail.
5. Coding of strategic revision and oral self-repair
- Reconstruct each written revision by aligning the keystroke log, screen video, and final text.
- Treat an episode as a continuous sequence of editing actions directed at the same target segment, and close the episode when production resumes elsewhere for at least 2 s or a different segment is edited.
NOTE: For Chinese input, distinguish pre-commitment composition changes from post-commitment target-text deletions and code only the latter as textual revisions. - Assign one primary revision type based on semantic, syntactic, lexical, or stylistic changes. Allow a secondary tag for overlapping cases, but use the primary tag for mutually exclusive counts. Apply the worked examples provided in Supplementary File 1.
- Produce a timestamped verbatim transcript before coding oral self-repair. Instruct the first transcriber to mark lexical content, filled pauses, repetitions, false starts, cut-offs, and unintelligible spans.
- Have a second trained reviewer check the transcript against the audio and resolve discrepancies while preserving the original audio timestamps.
- Define an oral self-repair as an overt reformulation that replaces, completes, or corrects an immediately preceding target-language segment. Do not infer covert monitoring from silence alone. Apply the same lexical, syntactic, semantic, and stylistic decision rules to oral self-repair.
- Code an exact repetition without corrective change as disfluency, an abandoned start followed by a new construction as a false start plus repair, and an omission or mistranslation without overt reformulation as an output error.
- When the audio is unclear or when two categories remain equally plausible, mark the episode as ambiguous. Retain provisional tags for ambiguous episodes and adjudicate them before reliability analysis.
- Judge functional outcome by comparing the pre-episode and post-episode target segments against the source information unit and local target context. Make this judgment before revealing the final holistic score. Do not use a change in the holistic score as the definition of effectiveness.
- Double-code at least 20% of outputs selected across both groups and task orders, and calculate reliability on the independent codes before adjudication.
- Retrain and recode when inter-rater agreement falls below a Cohen’s kappa of 0.80. Document this exact threshold and any corrective actions taken.
6. Quality evaluation and statistical modeling
- Score each final written translation and sight-interpreting rendition with the 25-point analytic rubric in Supplementary File 1.
- Rate accuracy, completeness, lexical appropriateness, coherence, and target-language naturalness from 0 to 5 using the stated anchors. Do not interpolate scoring criteria after inspecting group membership.
- Instruct raters to use both the audio and the verified transcript for sight interpreting dimensions. Analyze pause and disfluency measures separately from the rubric scores.
- Train two independent raters using the codebook and at least 10 practice outputs, blinding raters to participant group and task order.
- After independent scoring and episode coding, calculate reliability before discussion. Resolve disagreements by consensus and consult a third rater only when consensus cannot be reached.
- Report a two-way random-effects, absolute-agreement intraclass correlation coefficient for averaged continuous quality scores. Report Cohen's kappa for the primary categorical revision code and a separate kappa for the effective/neutral/detrimental outcome code. State the exact number and percentage of double-coded episodes.
- Verify that each process file is readable and complete prior to analysis, align written-task logs with corresponding screen records, and verify transcripts against the audio.
- Record alignment failures, intelligibility issues, and corrective actions in a quality-control log. Normalize frequency measures using 100 source-text information units for pause frequency and 100 produced Chinese characters for written revision density.
- Code functional outcome independently of the final holistic quality score. Code an episode as effective when the post-revision segment improves the text without introducing new problems, as neutral when it produces no material change, and as detrimental when it introduces an error.
- Calculate the effective rate as effective episodes divided by all classifiable episodes, excluding ambiguous episodes from the denominator.
- Analyze the demonstration as an exploratory repeated-measures dataset. Specify the fixed-effects model to predict total quality score using task condition, training group, pause metrics, revision density, effective rate, disfluency burden, and speech rate.
- Include a participant random intercept, and include source-text random effects only if the design contains enough independently sampled texts.
- Center continuous predictors, inspect residuals, and check collinearity. Report the estimation method, software version, β, SE, 95% CI, exact p values, variance components, AIC, BIC, and marginal/conditional R2. Describe the analysis as exploratory and avoid confirmatory causal claims.
- Export a reproducible analysis package containing de-identified data, dictionary, codebook, rubric, software details, scripts, and output. Confirm that every figure and table value can be traced to a named variable and analysis step before release.
Results
Participant baseline characteristics and data availability
The questionnaire contained 62 participants (31 novice and 31 trained), and the task sheet contained 124 records, indicating two completed task records per participant (Table 1). The novice group had less than 12 months of structured translation training (observed maximum, 8.6 months), whereas the trained group had at least 12 months (observed minimum, 13.3 months). Age, sex, English-learning duration, proficiency, and task-order distributions were similar between groups. Figure 1 reports the final analyzed sample and correctly distinguishes task-specific data: keystroke logs and screen recordings apply to written translation, audio and verbatim transcripts apply to sight interpreting, and quality ratings apply to both.
Behavioral profiles across task conditions
Behavioral profiles differed between the two task conditions and between training groups (Table 2; Figure 2A–E). Written translation had longer completion times and longer mean pauses, whereas sight interpreting had more pauses per 100 information units under the reported threshold. Within each task condition, the trained group completed tasks faster and had higher mean output scores. These contrasts should not be interpreted as pure modality effects because text length, time limit, output mode, and revision opportunity also differed. Pauses are not uniformly disruptive: a pause may reflect unresolved difficulty, successful planning, monitoring, or input-method activity, so pause measures are interpreted together with revision, delivery, and quality measures.
Strategic revision, self-repair, and predictive modeling
The coding framework separated episode type from functional outcome (Table 3; Figure 3A–D). Trained participants produced more written-revision episodes than novices (12.4 ± 3.7 vs. 8.9 ± 3.0 per task), whereas total oral self-repair did not differ significantly between groups (4.9 ± 1.6 vs. 4.4 ± 1.5 per task). The trained group nevertheless had a larger proportion of effective episodes in both tasks. The reported mixed-effects summary in Table 4 presents associations rather than causal paths; Figure 3E therefore displays the reported fixed-effect estimates and confidence intervals instead of a causal diagram.
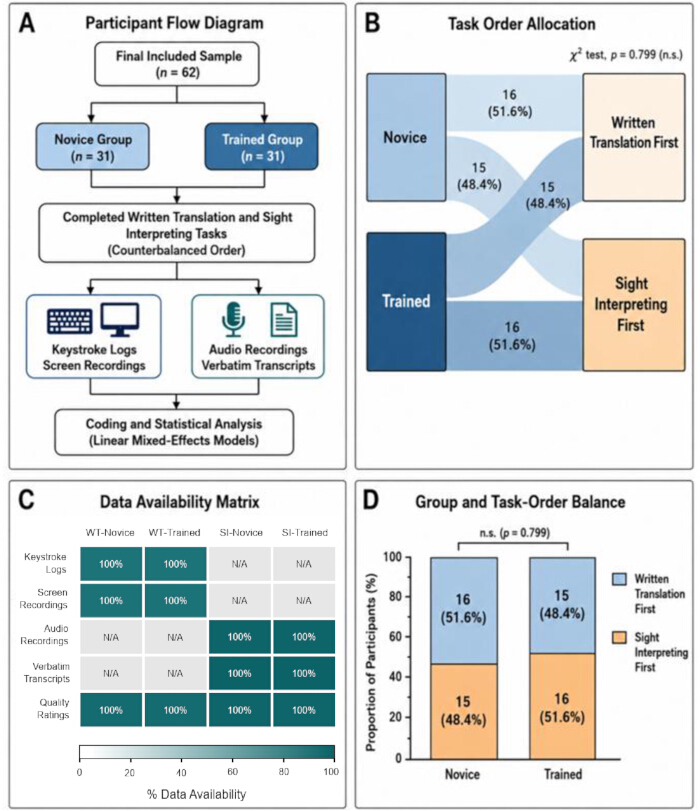
Figure 1: Participant flow, task-order allocation, and task-specific data availability. (A) Final analyzed sample of 62 participants and 124 task records. (B) Counterbalanced task-order allocation within novice and trained groups. (C) Availability matrix in which keystroke logs and screen recordings are applicable only to written translation, audio recordings, and verbatim transcripts only to sight interpreting, and quality ratings to both tasks. (D) Group-by-order balance (chi-square test, p = 0.799). n = 62 participants (31 per group). Please click here to view a larger version of this figure.
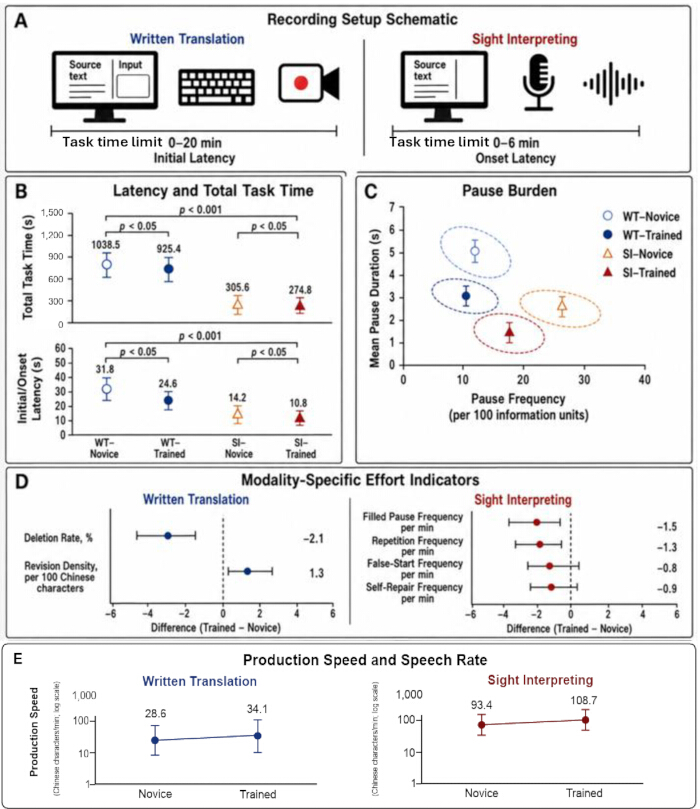
Figure 2: Behavioral profiles across written-translation and sight-interpreting task conditions. (A) Task-specific recording setup. (B) Initial/onset latency and total task time. (C) Joint distribution of pause frequency and mean pause duration. (D) Task-specific deletion, revision, and oral-disfluency indicators. (E) Written production rate and oral speech rate. In panels B, C, and E, points and error bars show group means ± SD; in panel D, points show trained-minus-novice mean differences and error bars show 95% confidence intervals. n = 31 participants per group. In panel E, the y-axis is displayed on a logarithmic scale. Please click here to view a larger version of this figure.
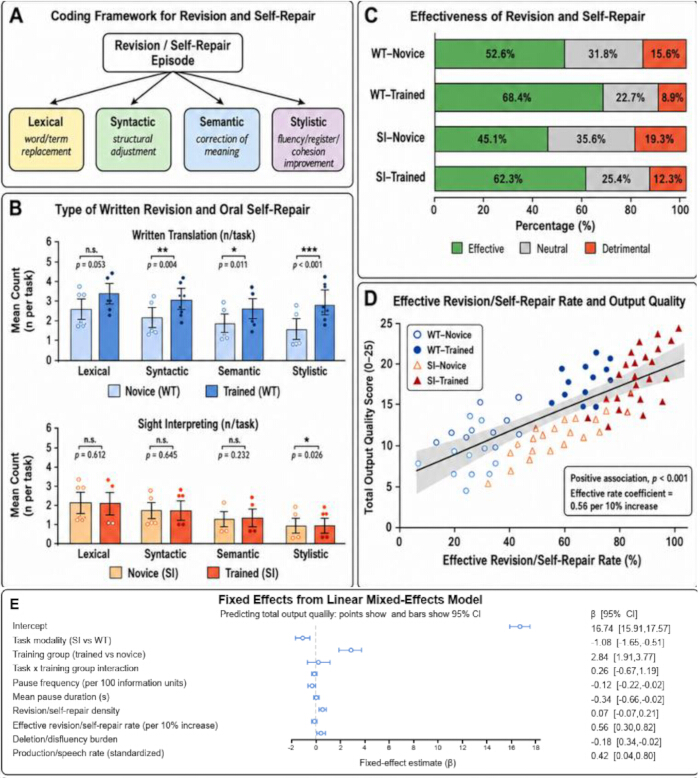
Figure 3: Revision/self-repair coding, functional outcome, and output-quality associations. (A) Decision framework for independently assigning episode type and functional outcome. (B) Mean counts of lexical, syntactic, semantic, and stylistic episodes in each task condition. (C) Mean proportions of effective, neutral, and detrimental episodes. (D) Descriptive association between effective-episode rate and total output-quality score. (E) forest plot displaying fixed effects from a linear mixed-effects model with 95% confidence intervals (detailed in Table 4); the plot is associative and does not represent a causal path model. Please click here to view a larger version of this figure.
| Variables | Novice group (n = 31) | Trained group (n = 31) | p value |
| Age, years | 21.9 ± 1.7 | 22.4 ± 1.9 | 0.279 |
| Female, n (%) | 22 (71.0) | 21 (67.7) | 0.779 |
| English learning duration, years | 12.4 ± 2.1 | 12.9 ± 2.2 | 0.36 |
| English proficiency score | 548.6 ± 41.3 | 562.4 ± 45.8 | 0.216 |
| Translation training duration, months | 5.6 ± 3.0 | 18.7 ± 5.4 | <0.001 |
| Interpreting training duration, months | 2.3 ± 2.1 | 13.9 ± 5.7 | <0.001 |
| Prior written translation practice ≥5 tasks, n (%) | 9 (29.0) | 24 (77.4) | <0.001 |
| Prior sight interpreting practice ≥5 tasks, n (%) | 5 (16.1) | 20 (64.5) | <0.001 |
| Written translation first, n (%) | 16 (51.6) | 15 (48.4) | 0.799 |
| Sight interpreting first, n (%) | 15 (48.4) | 16 (51.6) | 0.799 |
Table 1: Participant characteristics and baseline language-training profiles by group. Variables are presented as mean ± standard deviation for continuous data and as counts (percentages) for categorical data. The reported p-values reflect between-group comparisons to verify baseline demographic balance and confirm the intended differences in training duration.
| Variables | Written translation Novice (n = 31) | Written translation Trained (n = 31) | Sight interpreting Novice (n = 31) | Sight interpreting Trained (n = 31) | Task effect p | Group effect p |
| Initial/onset latency, s | 31.8 ± 12.4 | 24.6 ± 9.7 | 14.2 ± 5.6 | 10.8 ± 4.2 | <0.001 | 0.003 |
| Total task time, s | 1038.5 ± 168.2 | 925.4 ± 151.6 | 305.6 ± 59.3 | 274.8 ± 50.7 | <0.001 | 0.004 |
| Pause frequency, per 100 information units | 18.6 ± 6.1 | 14.2 ± 5.0 | 24.8 ± 7.4 | 19.6 ± 6.3 | <0.001 | 0.001 |
| Mean pause duration, s | 4.1 ± 1.2 | 3.3 ± 1.0 | 2.7 ± 0.8 | 2.3 ± 0.7 | 0.012 | 0.002 |
| Production/speech rate, Chinese characters/min | 28.6 ± 6.7 | 34.1 ± 7.5 | 93.4 ± 18.9 | 108.7 ± 20.4 | 0.001 | |
| Deletion rate, % | 8.9 ± 3.4 | 6.8 ± 2.7 | 0.009 | |||
| Revision density, per 100 Chinese characters | 7.6 ± 2.8 | 8.9 ± 3.1 | 0.087 | |||
| Filled pause frequency, per min | 5.7 ± 1.9 | 4.2 ± 1.6 | 0.002 | |||
| Repetition frequency, per min | 4.9 ± 1.8 | 3.6 ± 1.4 | 0.004 | |||
| False-start frequency, per min | 2.8 ± 1.1 | 2.0 ± 0.9 | 0.006 | |||
| Self-repair frequency, per min | 4.8 ± 1.7 | 3.9 ± 1.4 | 0.031 | |||
| Total quality score, 0–25 | 16.8 ± 2.3 | 20.1 ± 2.1 | 15.4 ± 2.6 | 18.9 ± 2.4 | 0.002 | <0.001 |
| Accuracy, 0–5 | 3.4 ± 0.7 | 4.1 ± 0.6 | 3.1 ± 0.8 | 3.8 ± 0.7 | 0.004 | <0.001 |
| Completeness, 0–5 | 3.3 ± 0.8 | 4.0 ± 0.6 | 3.0 ± 0.8 | 3.7 ± 0.7 | 0.006 | <0.001 |
| Lexical appropriateness, 0–5 | 3.2 ± 0.7 | 4.0 ± 0.6 | 3.1 ± 0.7 | 3.8 ± 0.6 | 0.041 | <0.001 |
| Coherence, 0–5 | 3.5 ± 0.6 | 4.0 ± 0.6 | 3.1 ± 0.7 | 3.8 ± 0.6 | 0.003 | <0.001 |
| Target-language naturalness, 0–5 | 3.4 ± 0.7 | 4.0 ± 0.6 | 3.1 ± 0.7 | 3.8 ± 0.7 | 0.007 | <0.001 |
Table 2: Behavioral process indicators and output quality across task conditions and groups. Values are expressed as mean ± standard deviation. The reported p-values indicate the main effects of task modality (written translation vs. sight interpreting) and training background (novice vs. trained) on each process and quality variable.
| Variables | Written translation Novice | Written translation Trained | p value | Sight interpreting Novice | Sight interpreting Trained | p value |
| Lexical revision/self-repair, n/task | 3.4 ± 1.5 | 4.2 ± 1.7 | 0.053 | 1.8 ± 0.8 | 1.7 ± 0.7 | 0.612 |
| Syntactic revision/self-repair, n/task | 2.1 ± 1.1 | 3.0 ± 1.2 | 0.004 | 1.1 ± 0.7 | 1.2 ± 0.8 | 0.645 |
| Semantic revision/self-repair, n/task | 1.8 ± 1.0 | 2.5 ± 1.1 | 0.011 | 0.9 ± 0.6 | 1.1 ± 0.7 | 0.232 |
| Stylistic revision/self-repair, n/task | 1.6 ± 0.9 | 2.7 ± 1.2 | <0.001 | 0.6 ± 0.4 | 0.9 ± 0.6 | 0.026 |
| Total revision/self-repair episodes, n/task | 8.9 ± 3.0 | 12.4 ± 3.7 | <0.001 | 4.4 ± 1.5 | 4.9 ± 1.6 | 0.209 |
| Effective episodes, % | 52.6 ± 13.5 | 68.4 ± 12.1 | <0.001 | 45.1 ± 14.2 | 62.3 ± 13.0 | <0.001 |
| Neutral episodes, % | 31.8 ± 10.4 | 22.7 ± 8.8 | 0.001 | 35.6 ± 11.7 | 25.4 ± 9.6 | 0.001 |
| Detrimental episodes, % | 15.6 ± 7.1 | 8.9 ± 5.6 | <0.001 | 19.3 ± 8.6 | 12.3 ± 6.8 | 0.001 |
Table 3: Type and effectiveness of written revisions and oral self-repairs across task conditions. Episode types are reported as mean counts per task (± standard deviation), and functional outcomes are reported as mean percentages (± standard deviation). The p-values indicate the significance of between-group differences within each task modality.
| Fixed effects | β | SE | 95% CI | p value |
| Intercept | 16.74 | 0.42 | 15.91 to 17.57 | <0.001 |
| Task modality: sight interpreting vs written translation | -1.08 | 0.29 | -1.65 to -0.51 | <0.001 |
| Training group: trained vs novice | 2.84 | 0.47 | 1.91 to 3.77 | <0.001 |
| Task modality × training group | 0.26 | 0.47 | -0.67 to 1.19 | 0.581 |
| Pause frequency, per 100 information units | -0.12 | 0.05 | -0.22 to -0.02 | 0.018 |
| Mean pause duration, s | -0.34 | 0.16 | -0.66 to -0.02 | 0.041 |
| Revision/self-repair density | 0.07 | 0.07 | -0.07 to 0.21 | 0.334 |
| Effective revision/self-repair rate, per 10% increase | 0.56 | 0.13 | 0.30 to 0.82 | <0.001 |
| Deletion/disfluency burden | -0.18 | 0.08 | -0.34 to -0.02 | 0.027 |
| Production/speech rate, standardized | 0.42 | 0.19 | 0.04 to 0.80 | 0.032 |
Table 4: Reported fixed effects from the linear mixed-effects model predicting total output quality. The summary details the unstandardized coefficients (β), standard errors (SE), 95% confidence intervals (CI), and exact p-values for all specified task and behavioral predictors.
Discussion
This study demonstrates a multimodal protocol for measuring observable process indicators and coding strategic revision in English-Chinese written translation and sight interpreting. The protocol does not directly measure a unitary cognitive-effort variable. Instead, latency, pauses, deletions, and revision patterns are interpreted as task-sensitive behavioral correlates whose meaning depends on triangulation with synchronized records and output-quality evidence1,2,3,4,5,6,7,8. The two tasks also differ in materials, timing, output mode, and revision opportunity; the representative contrasts therefore describe task-condition differences rather than isolated modality effects. The main analytical contribution is the separation of revision frequency from functional outcome. In the reported summaries, trained participants made more written revisions, not fewer, whereas total oral self-repair counts did not differ significantly between groups. Their higher effective-episode proportions suggest that monitoring quality may be more informative than raw frequency, but this interpretation depends on transparent decision rules, independent outcome coding, and reported reliability. The codebook and worked examples in Supplementary File 1 are intended to make this distinction reproducible rather than promotional.
Critical steps are cross-record alignment, audio quality, transcript verification, and coding consistency. Available timestamps and task-boundary cues should be checked when aligning logs and recordings. Audio must be inspected for clipping and intelligibility before transcription, and proposed pause boundaries must be verified against the waveform and transcript. For Chinese input, composition keystrokes should not be equated with committed-character revisions. These checks and corrective actions should be retained in a quality-control log.
Several limitations bound interpretation. The demonstration uses student and trainee cohorts, short general expository texts, different task lengths and time limits, and an availability-based sample. The task conditions also differ in output mode and revision opportunities, and the dataset does not contain independently sampled source-text identifiers to estimate text-level variation. In addition, pause thresholds are operational choices, and longer pauses may reflect both productive planning and unresolved difficulty. Generalization to professionals, specialized domains, other language pairs, or other writing systems requires revalidation of materials, input-method handling, thresholds, and scoring anchors.
Future work can combine the behavioral records with eye tracking, pupillometry, or subjective workload measures to test which pauses and revisions correspond to attention, experienced effort, or successful planning5,6,13,14,15,16. Shreve et al. used eye tracking in sight translation and should not be cited as a pupillometry study18; pupillometry is discussed directly by Seeber5. Such multimodal extensions should retain the separation among task demand, invested effort, observed behavior, and performance. The present protocol is therefore best used as a transparent process-assessment framework whose indicators support, but do not by themselves establish, claims about latent cognitive effort.
Disclosures
The authors report no commercial or financial conflicts of interest. Regarding the use of artificial intelligence, the authors disclose that OpenAI Codex was utilized during the revision process strictly to assist with language editing, consistency checks, the preparation of tracked revisions, and the regeneration of figure layouts based on author-supplied data. The authors meticulously reviewed all AI-assisted outputs and take full responsibility for the accuracy, integrity, and originality of the final manuscript. The structured workbook underlying the reported summaries is publicly available at Zenodo (https://doi.org/10.5281/zenodo.21189434). Supplementary File 1 contains the coding manual and anchored quality rubric.
Acknowledgements
The author thanks the Guilin Institute of Information Technology for laboratory support, the bilingual experts who evaluated the source texts, the independent raters, and the participants. This research received no specific grant from any funding agency in the public, commercial, or not-for-profit sectors.
Materials
| Name | Company | Catalog Number | Comments |
|---|---|---|---|
| Acoustic analysis software (Praat) | Paul Boersma and David Weenink | https://www.fon.hum.uva.nl/praat/ | |
| Desktop computer | Dell | OptiPlex | |
| Digital audio recording software (Audacity) | Audacity Team | https://www.audacityteam.org/ | |
| Keystroke logging software (Inputlog) | University of Antwerp | https://www.inputlog.net/ | |
| Screen recording software (OBS Studio) | OBS Project | https://democreator.wondershare.com/ | |
| Statistical analysis software (SPSS) | IBM | Version 27 |
References
- Gieshoff AC, Heeb AH. Cognitive load and cognitive effort: probing the psychological reality of a conceptual difference. Transl Cogn Behav. 2023;6(1):3–28.
- Sweller J, van Merriënboer JJG, Paas F. Cognitive architecture and instructional design. Educ Psychol Rev. 1998;10(3):251–96.
- Paas F, Tuovinen JE, Tabbers H, Van Gerven PWM. Cognitive load measurement as a means to advance cognitive load theory. Educ Psychol. 2003;38(1):63–71.
- Gile D. Basic Concepts and Models for Interpreter and Translator Training. Amsterdam: John Benjamins; 2009.
- Seeber KG. Cognitive load in simultaneous interpreting: measures and methods. Target. 2013;25(1):18–32.
- Ferreira A, Schwieter JW, Gottardo A, Jones JA. Cognitive effort in direct and inverse translation performance: insight from eye-tracking technology. Cad Trad. 2016;36(3):60–80.
- Zou D, Zhang J. Measuring the invisible: clarifying the concept of cognitive effort in translation and interpreting processes. Curr Trends Transl Teach Learn E. 2023;10:217–58.
- Lacruz I, Shreve GM, Angelone E. Average pause ratio as an indicator of cognitive effort in post-editing: a case study. Workshop on Post-Editing Technology and Practice. San Diego: Association for Machine Translation in the Americas; 2012. p. 21–30.
- Qassem M, Al Thowaini BM. Cognitive processes and translation quality: Evidence from keystroke-logging software. J Psycholinguist Res. 2023;52(5):1589–604.
- Ma X, Li D. Effect of word order asymmetry on the cognitive load of English–Chinese sight translation: Evidence from eye movement data. Transl Interpret Stud. 2024;19(1):105–31.
- Leijten M, Van Waes L. Keystroke logging in writing research: using Inputlog to analyze and visualize writing processes. Written Commun. 2013;30(3):358–92.
- Heilmann A, Neumann S, editors. Dynamic pause assessment of keystroke logged data for the detection of complexity in translation and monolingual text production. Proceedings of the Workshop on Computational Linguistics for Linguistic Complexity; 2016; Osaka: COLING.
- Su W, Li D. Identifying translation problems in English-Chinese sight translation: an eye-tracking experiment. Transl Interpret Stud. 2019;14(1):110–34.
- Su W, Li D. Exploring processing patterns of Chinese-English sight translation: an eye-tracking study. Babel. 2020;66(6):999–1024.
- Su W, Li D. Exploring the effect of interpreting training: eye-tracking English-Chinese sight interpreting. Lingua. 2021;256:103094.
- Su W. Eye-voice span in sight interpreting: an eye-tracking investigation. Perspectives. 2023;31(5):969–85.
- Rojo López AM, Muñoz Martín R. Research Methods in Cognitive Translation and Interpreting Studies. Amsterdam: John Benjamins; 2025.
- Shreve GM, Lacruz I, Angelone E. Cognitive effort, syntactic disruption, and visual interference in a sight translation task. Transl Interpret Stud. 2010;5(1):63–84.
Reprints and Permissions
This article has been published
Video Coming Soon