This article presents a rapid, reproducible workflow to model sleep deprivation-induced recognition memory deficits in mice by combining gentle-handling sleep deprivation, novel object recognition testing, and hippocampal biomarker analysis within the same animals across a 10-day pipeline, with structured intervention logging and predefined quality-control criteria.
Method Article
A Rapid Workflow For Modeling Sleep Deprivation–Induced Recognition Memory Deficits In Mice Using Novel Object Recognition and Hippocampal Biomarkers
* These authors contributed equally
In This Article
Summary
Abstract
Inadequate sleep contributes to cognitive decline and may accelerate neurodegenerative processes. This article presents a rapid and reproducible workflow for modeling sleep deprivation–induced recognition memory deficits in mice while linking behavioral outcomes to hippocampal molecular alterations. The protocol uses a 5-h gentle-handling sleep deprivation paradigm administered immediately after a standardized 10-min novel object recognition (NOR) familiarization session. Recognition memory is evaluated using a 5-min NOR test after a precisely defined 5-h retention interval, followed by immediate hippocampal collection from the same animals for quantification of pro-inflammatory cytokines, including interleukin-1 beta (IL-1β), interleukin-6 (IL-6), and tumor necrosis factor-alpha (TNF-α), and oxidative-stress markers, including superoxide dismutase (SOD), glutathione peroxidase (GPx), and malondialdehyde (MDA). The principal methodological advance is not the individual behavioral or biochemical techniques, which are well established, but their operational standardization as one linked workflow. The protocol requires a structured, quantifiable log of gentle-handling interventions, anchors training and deprivation to a fixed circadian time point, preserves animal-level links between NOR recordings and tissue samples, and prespecifies quality-control and analytical criteria. The procedure is designed to minimize physical restraint and forced exercise, can be completed within a short experimental window, and is proposed as a candidate reference workflow that individual laboratories may use to benchmark their own implementation of gentle-handling sleep deprivation, pending independent replication.
Introduction
Sleep is a fundamental physiological process essential for brain function, learning, and memory consolidation1. Insufficient sleep is associated with cognitive dysfunction, mood disorders, and the progression of neurodegenerative diseases2. Experimental sleep deprivation (SD) in rodents is widely used to investigate the neurobiological consequences of acute sleep loss. The hippocampus, a brain region central to declarative and spatial memory, is particularly vulnerable to sleep deprivation3.
Several procedures are available for inducing sleep loss in rodents. The modified multiple platform method can effectively reduce rapid eye movement sleep but may introduce considerable stress and physical exhaustion4. In contrast, gentle handling (GH) maintains wakefulness through mild sensory stimulation, such as cage tapping, bedding disturbance, or presentation of novel nesting material when sleep signs appear. A brief GH period applied immediately after learning can interfere with hippocampus-dependent memory consolidation while avoiding many of the confounds associated with prolonged deprivation paradigms5. Because interventions in this protocol are triggered by posture and behavioral wakefulness cues rather than EEG-confirmed REM detection, GH as implemented here constitutes an established total sleep-deprivation method rather than a REM-specific technique and has been used in this form for several decades6.
The novel object recognition (NOR) test is a widely used assay for recognition memory. It relies on the natural tendency of rodents to explore a novel object more than a familiar object, without requiring reward, punishment, or extensive training7,8. Acute SD has been shown to impair novel-object discrimination, thereby providing an efficient behavioral readout of disrupted memory consolidation9. At the molecular level, sleep loss can elicit hippocampal neuroinflammation and oxidative stress, including increased levels of pro-inflammatory cytokines and lipid-peroxidation products, together with reduced antioxidant capacity10,11.
The challenge in applying this model is not the availability of its individual elements, but the lack of operational consistency across studies. Gentle handling is often reported without a structured record of intervention intensity; behavioral and molecular endpoints are frequently collected in separate cohorts; and quality-control criteria for exploration behavior and sample-size planning are not always explicit. The overall goal of the present article is to provide a standardized workflow for modeling sleep deprivation-induced recognition memory deficits while linking behavioral outcomes with hippocampal molecular measures in the same animals. The method addresses these reproducibility gaps by combining a 5-h post-training GH window, an intervention-intensity log, same-cohort behavioral and tissue collection, and predefined analytical criteria in a single 10-day pipeline (Figure 1). The lack of standardization in GH implementation has been noted previously in the sleep-research methodology literature6.

Figure 1. Schematic representation of the experimental workflow. The protocol spans 10 days, including handling and habituation, followed by a critical testing day integrating a 10 min NOR familiarization phase, 5 h of GH sleep deprivation, a 5 min NOR test, and immediate hippocampal tissue collection from the same animals for biomarker analysis. Please click here to view a larger version of this figure.
Protocol
All animal procedures were reviewed and approved by the Laboratory Animal Welfare and Ethics Committee of AILIMO (Zhejiang AILIMO Biotechnology Co., Ltd.) under application from Nanjing Drum Tower Hospital (Principal Investigator: Yuan Liu), Approval No. AP CODE: ALM202605070, approved May 7, 2026 (valid for 4 years), in accordance with applicable institutional and national regulations. Use adult male C57BL/6J mice (8–12 weeks old) for the protocol described below.
1. Preparation and Animal Habituation
- House mice under standard laboratory conditions at 22°C ± 1°C and 50%–60% humidity with a 12 h light/12 h dark cycle (lights on at 07:00, defined as ZT0). Provide ad libitum access to standard rodent chow and water.
- Handle each mouse for 3–5 min daily for at least 7 consecutive days before testing.
NOTE: This procedure minimizes handling-induced stress that could confound exploratory behavior. - Prepare a square, opaque NOR arena measuring 40 cm × 40 cm × 40 cm with non-reflective walls. Use an arena color that contrasts with the coat color of the animals.
- Select NOR objects that are heavy enough to prevent displacement and are made of non-porous material. Use objects that are distinguishable in shape and texture while remaining comparable in overall size.
NOTE: Figure 2 shows the training and test configuration. - On Days 8 and 9, transfer mice to the testing room 1 h before habituation. Place each mouse in the empty arena for 10 min, and then return it to its home cage.
- Wipe the arena and objects with 70% ethanol between animals. Allow the ethanol to air-dry for approximately 3–5 min under normal laboratory ventilation before introducing the next animal.
CAUTION: Ethanol is highly flammable. Ensure adequate ventilation and keep it away from ignition sources.
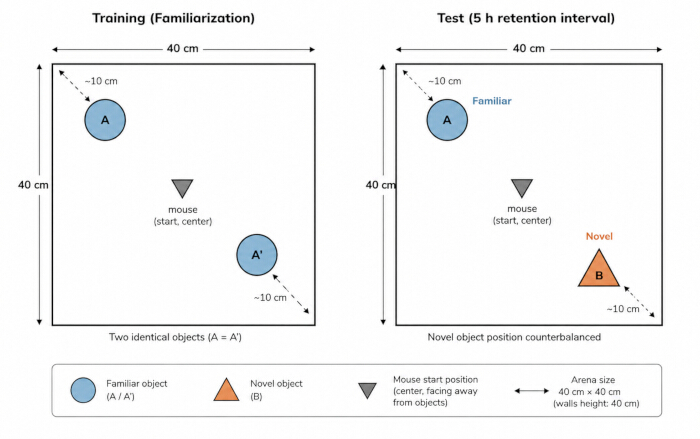
Figure 2. Schematic of the novel object recognition apparatus and experimental design. During familiarization, place two identical objects (A and A′) in opposite corners of the arena. During the test phase after the 5 h retention interval, replace one familiar object with a novel object (B). Counterbalance the novel-object position between the left and right positions across animals, with approximately half of the animals in each group receiving the novel object in each position, to minimize spatial bias. Please click here to view a larger version of this figure.
2. NOR Training (Familiarization)
- On Day 10, begin NOR training at ZT1 (08:00 under the stated light schedule). Maintain this start time across cohorts to minimize circadian variation.
- Transfer mice to the testing room 1 h before the start of the training session. Place two identical objects (A and A′) in opposite corners of the arena, approximately 10 cm from the walls.
- Secure the objects to the floor when necessary.
- Place the mouse in the center of the arena facing away from the objects. Allow the mouse to explore freely for 10 min.
- Record behavior using an overhead video-tracking system. Define active exploration as directing the nose toward an object at a distance of ≤2 cm, sniffing the object, or touching it with the nose.
NOTE: Do not count sitting on or climbing an object without active sniffing as object exploration. - Record and score NOR behavior using EthoVision XT version 17.5 with a Basler acA1300-60gm overhead camera. Configure the tracking software with a nose-point detection zone of ≤2 cm from each object to score active exploration, consistent with the criteria defined in step 2.5.
- At the end of the 10 min familiarization session, remove the mouse immediately from the arena.
- Clean the arena and objects thoroughly with 70% ethanol before introducing the next animal.
3. Sleep Deprivation by Gentle Handling
- Before the Day 10 training session, assign each animal a unique identification code. Maintain the identification code throughout behavior recording and tissue collection.
- Assign animals to the SD and NSD groups at a 1:1 ratio using computer-generated random numbers generated with the Excel RAND function.
- Immediately after NOR training, return NSD mice to their home cages and leave them undisturbed for 5 h. Maintain SD and NSD animals under matched environmental conditions and within the same circadian time window.
- Immediately after NOR training, initiate GH sleep deprivation for SD mice. Maintain wakefulness for 5 consecutive hours in the home cage.
- Monitor animals continuously. Intervene when a mouse adopts sleep-related postures, including curling up, eye closure, or sustained motionlessness.
- Apply stimulation progressively, beginning with gentle tapping on the cage. If necessary, lightly disturb the bedding, introduce a clean novel object such as a paper tube, or gently touch the animal with a soft brush.
- Avoid physical restraint, forced locomotion, and aversive or painful stimulation.
- Complete the intervention log in Table 1 for each cage throughout the 5 h GH period. Record the approximate number of interventions per hour, the dominant intervention type, and any protocol deviations or welfare concerns.
- Use the same intervention-log template across cohorts.
CAUTION: Do not use physical restraint, forced exercise, or painful stimuli, because these can independently influence memory, stress, and inflammatory outcomes.
| Cage/Cohort ID | H1 | H2 | H3 | H4 | H5 | Dominant intervention type(s) | Deviation or welfare observation |
| Record ID | Record H1 count | Record H2 count | Record H3 count | Record H4 count | Record H5 count | Tap / bedding / novel object / soft brush | Record if present |
Table 1: Gentle-handling intervention log template. Record the cage or cohort ID, number of gentle-handling interventions during each hour of the 5 h sleep-deprivation period (H1–H5), dominant intervention type(s), and any protocol deviations or welfare observations.
4. NOR Test Phase
- Exactly 5 h after completion of NOR training, begin the NOR test phase to maintain a fixed 5 h retention interval.
- Place one familiar object (A) and one novel object (B) in the arena.
- Counterbalance the novel-object position across animals by alternating placement between the left and right positions so that approximately half of the animals in each group receive the novel object on the left and half receive it on the right.
- Place the mouse in the center of the arena. Allow the mouse to explore freely for 5 min.
- Record the session using the same overhead video-tracking system used for familiarization. Apply the exploration definition specified in step 2.5.
- Clean the arena and objects with 70% ethanol between animals.
5. Same-Cohort Tissue Collection and Hippocampal Dissection
- Immediately after the NOR test, identify the same behaviorally tested animal for tissue collection.
- Euthanize the animal by decapitation without anesthesia, in accordance with the approved animal protocol, to avoid potential confounding effects of anesthetic agents on inflammatory and phosphorylation-dependent biomarkers. Collect the brain tissue immediately after euthanasia.
- Retain the animal’s unique behavior-recording ID on all sample tubes and records to ensure that each molecular sample remains directly linked to that animal's NOR outcome.
- Rapidly extract the brain and place it on a sterile, ice-cold dissection surface.
- Separate the hemispheres with a mid-sagittal cut. Dissect the hippocampus from each hemisphere using chilled micro-spatulas.
- Snap-freeze the dissected hippocampi in liquid nitrogen. Store the samples at −80°C until analysis.
CAUTION: Liquid nitrogen can cause severe cold injury. Wear appropriate cryogenic personal protective equipment.
6. Quantification of Hippocampal Biomarkers
- Supplement ice-cold RIPA lysis buffer with a combined protease and phosphatase inhibitor cocktail at a 1× working concentration (10 µL per mL of lysis buffer from a 100× stock).
- Homogenize hippocampal tissue at a 1:10 tissue-to-buffer ratio (w/v) in the supplemented ice-cold RIPA lysis buffer (10 µL lysis buffer per mg tissue). For a typical hippocampal tissue mass of approximately 25–30 mg per hemisphere, use approximately 250–300 µL of lysis buffer per hemisphere, or approximately 500–600 µL for approximately 50–60 mg of bilateral hippocampal tissue.
- Centrifuge the RIPA homogenate at 14,000 × g for 15 min at 4°C and collect the supernatant. Use the supernatant for total protein quantification and the three cytokine ELISAs.
NOTE: Use the kit-specific homogenization buffers for the SOD, GPx, and MDA assays in accordance with the manufacturers' recommendations for preserving enzymatic activity. - Prepare a separate 10% (w/v) hippocampal homogenate for SOD, GPx, and MDA measurements at a 1:9 tissue-to-buffer ratio using the corresponding kit-specific homogenization buffer rather than RIPA lysis buffer.
- Determine the total protein concentration using a BCA protein assay.
- Quantify IL-1β, IL-6, TNF-α, SOD, GPx, and MDA using the target-specific ELISA or biochemical assay kits listed in the Table of Materials. Follow the manufacturer's instructions for each assay.
- Prepare the standards in the corresponding assay buffer. Dilute samples so that the optical-density values fall within the linear portion of the standard curve.
- Dilute hippocampal samples for the cytokine ELISAs approximately 1:5 with the corresponding assay diluent. Adjust the dilution within a 1:2–1:10 range as needed to obtain optical-density values within the linear portion of the standard curve.
- Use the supernatants of the 10% (w/v) hippocampal homogenates described in step 6.4 directly for the SOD, GPx, and MDA assays. Do not apply the cytokine ELISA dilution scheme described in step 6.8 to these three assays.
- For the IL-1β, IL-6, and TNF-α ELISAs, add 100 µL of standard or appropriately diluted hippocampal sample per well in duplicate and incubate at 37°C for 90 min. Add 100 µL of biotinylated detection antibody and incubate at 37°C for 60 min.
- Add 100 µL of HRP conjugate to each cytokine ELISA well and incubate at 37°C for 30 min. Develop with TMB substrate at 37°C in the dark for approximately 15 min.
- For the SOD assay, mix 20 µL of hippocampal homogenate supernatant with 20 µL of enzyme working solution and 200 µL of substrate solution. Incubate at 37°C for 20 min and measure the absorbance at 450 nm.
- For the GPx assay, combine 200 µL of hippocampal homogenate supernatant with the GSH-containing reaction mixture and incubate at 37°C for 5 min. Terminate the reaction and centrifuge the mixture at 3500 × g for 10 min at 4°C. Subject the supernatant to color development for approximately 15 min and measure the absorbance at 412 nm using 200 µL of the reaction supernatant.
- For the MDA assay, mix 100 µL of hippocampal homogenate supernatant with 1.0 mL of MDA working reagent and incubate in a 95°C water bath for 40 min. Cool and centrifuge the mixture. Transfer approximately 250 µL of the supernatant to a microplate and measure the absorbance at 532 nm.
- For the cytokine ELISAs, read the absorbance at the kit-specified wavelength, typically 450 nm, using reference-wavelength correction when available.
- Generate a standard curve using an appropriate model, such as four-parameter logistic regression. Normalize each biomarker measurement to the total protein content.
- Report cytokine concentrations as pg/mg protein, antioxidant-enzyme activities as U/mg protein, and MDA as nmol/mg protein, where compatible with the selected kit.
7. Data Analysis and Quality Control
- Extract the exploration time directed toward the familiar object (Tfamiliar) and the novel object (Tnovel) during the NOR test phase.
- Calculate the discrimination index (DI) as follows:
 .
.
NOTE: A DI above 0.5 indicates a preference for the novel object. - Exclude an animal from NOR analysis when the total object exploration time (Tnovel + Tfamiliar) is less than 10 s. Apply this criterion before group-level analysis and report all exclusions.
- Assess normality for each group using the Shapiro–Wilk test and homogeneity of variance using Levene’s test. For each group, evaluate the DI against the 0.5 chance level using a two-tailed one-sample t-test; if the normality assumption is not met, use a one-sample Wilcoxon signed-rank test against 0.5 instead.
- Set alpha at 0.05 for all statistical tests unless otherwise specified.
- Compare the DI between independent NSD and SD groups using a two-tailed unpaired t-test when the normality and variance-homogeneity assumptions are met. Use a Mann–Whitney U test otherwise.
- Analyze familiar versus novel exploration time using a two-way repeated-measures analysis of variance with Group and Object Type as factors. Perform Sidak-corrected pairwise post hoc comparisons and report 95% confidence intervals alongside all group-comparison estimates.
- Compare each hippocampal biomarker between independent NSD and SD groups using a two-tailed unpaired t-test when the normality and variance–homogeneity assumptions are met. Use a Mann–Whitney U test otherwise.
- When evaluating multiple biomarkers from the same cohort, control the false discovery rate across the biomarker panel using the Benjamini–Hochberg procedure. Report both nominal and FDR-adjusted p-values.
- Conduct the a priori power analysis using G*Power version 3.1 for a two-sided independent-samples comparison, with the NOR discrimination index as the primary outcome. Base the expected effect on previously published studies demonstrating a robust impairment of novel-object preference following post-learning sleep deprivation.
- Conduct the a priori power analysis using a standardized effect size of Cohen’s d = 1.35, a two-sided alpha of 0.05, 80% power, and a 1:1 allocation ratio. These parameters yield a calculated minimum sample size of 10 animals per group.
NOTE: The effect size was estimated from previously published object-recognition data9. Palchykova et al. reported a significant group effect on novel-object exploration duration during the test phase (F(1,16) = 8.26, p < 0.007) for mice sleep-deprived immediately after training versus time-matched controls (n = 9 per group), corresponding to Cohen’s d ≈ 1.36. A standardized effect size of d = 1.35 was therefore adopted for the a priori power analysis. - Increase the planned sample size by 20% to 12 animals per group (24 animals total) to allow for prespecified behavioral or technical exclusions. Prespecify total object exploration <10 s during the NOR test, welfare-related exclusions, unusable video recordings, and technical failure of tissue/sample assays as exclusion criteria.
- Do not exclude animals on the basis of the direction or magnitude of the observed treatment effect.
- Perform the statistical analyses using Python version 3.12, SciPy version 1.17 for hypothesis testing and effect-size calculations, and statsmodels version 0.14 for Benjamini–Hochberg false discovery rate correction.
- When using this protocol to generate a formal dataset, report effect sizes (e.g., Cohen's d for group comparisons) alongside p-values for all statistical tests specified in steps 7.4–7.9.
Results
A successful implementation of this protocol should yield a coherent behavioral-molecular outcome pattern without requiring interpretation of any single readout in isolation. The complete experimental sequence is illustrated in Figure 1, and the NOR apparatus and experimental design are shown in Figure 2. In the NSD group, mice should display a clear preference for the novel object, reflected by a DI above the 0.5 chance level. Mice exposed to the 5 h post-training GH protocol should show attenuated novel-object preference and a lower DI than NSD controls. Total object exploration should remain comparable across groups; a global reduction in exploration would suggest motor, anxiety, or procedural confounds rather than a selective recognition-memory deficit. In the present cohort (NSD, n = 12; SD, n = 12, of which one animal was excluded according to the prespecified total-exploration threshold in Step 7.3, leaving n = 11 for NOR analysis; this exclusion was applied consistently to both the discrimination-index and total-exploration-time analyses reported below), NSD mice showed a mean DI of 0.70 ± 0.05 (mean ± SD), significantly above the 0.5 chance level (one-sample t-test, t(11) = 15.21, p < 0.0001), while SD mice showed a mean DI of 0.51 ± 0.05, not significantly different from chance (t(10) = 0.49, p = 0.638). DI differed significantly between groups (unpaired t-test, t(21) = 9.28, p < 0.0001; Cohen's d = 3.87; mean difference = 0.19, 95% CI [0.15, 0.23]) (Figure 3A). Total exploration time did not differ significantly between groups (NSD: 33.5 ± 8.7 s; SD: 29.9 ± 6.2 s; t(21) = 1.13, p = 0.272) (Figure 3B), consistent with a selective effect on recognition memory rather than a generalized reduction in exploratory behavior.
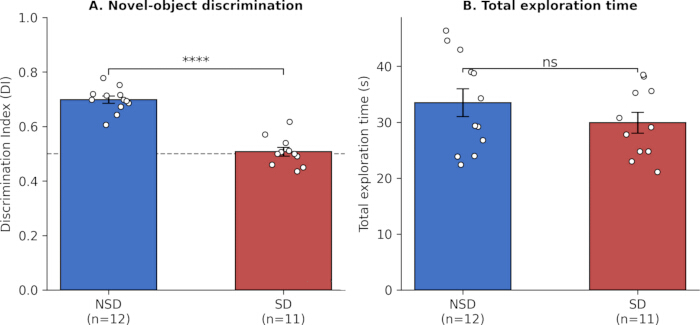
Figure 3. Novel object recognition performance. (A) Discrimination index (DI) for NSD (n = 12) and SD (n = 11; one animal was excluded according to the prespecified total-exploration-time threshold) groups. The dashed line indicates the 0.5 chance level. (B) Total object exploration time during the test phase for NSD (n = 12) and SD (n = 11; the same exclusion as in panel A) groups. Bars show mean ± SEM; open circles show individual animals. ****p < 0.0001; ns, not significant (two-tailed unpaired t-test). Please click here to view a larger version of this figure.
The intervention log (Table 1) should show that GH was maintained with mild, escalating sensory interventions rather than restraint or forced locomotion. Large differences in hourly intervention counts between cohorts should prompt review of cage conditions, observer consistency, and handling practice before interpretation of behavioral differences. Across the 12 cohorts recorded in this study, hourly intervention counts during the 5 h GH window ranged from 1 to 6 per hour, predominantly consisting of cage tapping and bedding disturbance, with soft-brush and novel-object interventions used less frequently; no cage required physical restraint or forced locomotion, and no welfare deviations were observed.
Biochemical measures collected from the same animals should provide molecular context for the behavioral phenotype. A successful SD model is expected to show a coordinated pattern of higher hippocampal pro-inflammatory cytokine burden, reduced antioxidant-enzyme activity, and increased lipid-peroxidation markers relative to matched NSD controls. Linking each tissue sample to the corresponding NOR record enables animal-level assessment of behavioral and molecular concordance while avoiding the batch variation introduced by separate behavioral and biochemical cohorts. In the present cohort (NSD, n = 12; SD, n = 12), all six hippocampal biomarkers differed significantly between groups in the expected direction, and all remained significant after Benjamini–Hochberg FDR correction across the six-marker panel: IL-1β (NSD 43.4 ± 7.5 vs. SD 58.6 ± 5.3 pg/mg protein; t(22) = −5.73, nominal p < 0.0001, FDR-adjusted p < 0.0001, d = −2.34), IL-6 (57.8 ± 8.1 vs. 71.8 ± 7.4 pg/mg; t(22) = −4.42, nominal p = 0.0002, FDR-adjusted p = 0.0002, d = −1.81), TNF-α (40.5 ± 7.8 vs. 55.1 ± 7.8 pg/mg; t(22) = −4.60, nominal p = 0.0001, FDR-adjusted p = 0.0002, d = −1.88), SOD (18.0 ± 2.0 vs. 14.0 ± 1.8 U/mg; t(22) = 5.16, nominal p < 0.0001, FDR-adjusted p < 0.0001, d = 2.11), GPx (13.2 ± 0.9 vs. 10.8 ± 1.4 U/mg; t(22) = 4.92, nominal p < 0.0001, FDR-adjusted p < 0.0001, d = 2.01), and MDA (3.5 ± 0.3 vs. 4.9 ± 0.8 nmol/mg; t(22) = −5.59, nominal p < 0.0001, FDR-adjusted p < 0.0001, d = −2.28). These data are shown in Figure 4. The individual data points shown in Figure 3 and Figure 4 are the actual experimental measurements obtained in this cohort, and all reported means, effect sizes, p-values, and confidence intervals were calculated directly from these same underlying data.
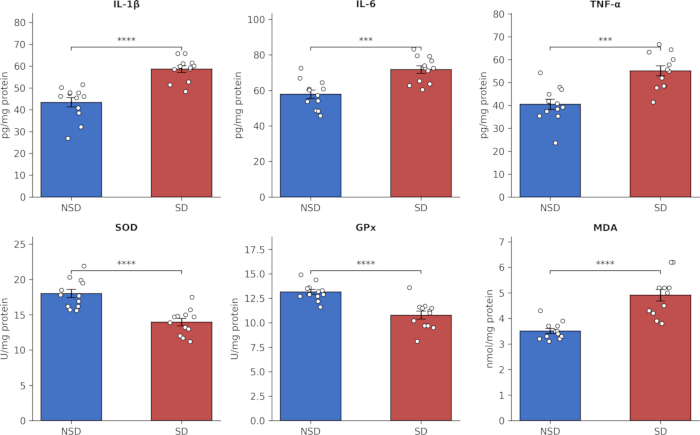
Figure 4. Hippocampal biomarkers in NSD versus SD mice. Hippocampal levels of IL-1β, IL-6, and TNF-α (pro-inflammatory cytokines), SOD and GPx (antioxidant enzymes), and MDA (lipid-peroxidation marker) in NSD (n = 12) and SD (n = 12) mice. Bars show mean ± SEM; open circles show individual animals. Significance markers reflect Benjamini–Hochberg FDR-adjusted p-values across the six-marker panel. ***p < 0.001 and ****p < 0.0001 after FDR adjustment (two-tailed unpaired t-tests). Please click here to view a larger version of this figure.
If NSD mice do not display a novel-object preference, if total exploration falls below the predefined threshold, or if biomarker variance is unexpectedly large, troubleshoot habituation, object selection, intervention consistency, sample identification, and tissue-processing timing before repeating the cohort, as summarized in Table 2. These outcomes represent suboptimal experimental results that require troubleshooting before interpretation. In the present cohort, one SD animal (M19) was excluded from NOR analysis according to the prespecified total-exploration threshold (8.7 s; Step 7.3), illustrating the type of suboptimal outcome addressed by this criterion; no NSD animal failed to show a novel-object preference, and no cohort showed unexpectedly large biomarker variance requiring cohort repetition in this dataset.
| Problem | Possible Cause | Solution |
| Low overall exploration in NOR | Insufficient habituation, high anxiety, or excessive environmental disturbance | Extend daily handling; confirm that the testing room is quiet and dimly lit; verify arena habituation before training. |
| No novel-object preference in NSD controls | Objects differ in innate preference or are insufficiently distinct | Pre-screen objects in naive animals; use objects with clearly different textures/shapes but matched size and accessibility. |
| Large variation in GH intervention counts | Inconsistent observer thresholds or cage conditions | Train observers using the same wakefulness criteria; use the same intervention log; standardize bedding, cage enrichment, and environmental conditions. |
| High variability in biomarker measurements | Delayed dissection, inconsistent sample identity, or sample degradation | Maintain behavior-to-sample IDs; standardize dissection timing; snap-freeze promptly; keep samples on ice during homogenization. |
| SD mice show marked distress | Overly intense handling | Use only mild sensory interventions; stop and follow approved welfare procedures if distress is observed. |
Table 2: Troubleshooting. Common problems encountered during the NOR, gentle-handling sleep-deprivation, and hippocampal biomarker workflow, together with possible causes and recommended corrective actions.
Discussion
This article provides a rapid, reproducible framework for studying acute sleep deprivation-induced recognition memory deficits and hippocampal molecular changes. By applying 5 h of gentle handling immediately after a standardized 10 min learning phase, the procedure targets a defined post-learning consolidation window and is designed to reduce the physical burden associated with extended deprivation models or procedures based on forced movement4,5. However, this submission does not include direct stress-hormone measurements to confirm a lower physiological stress response, as discussed below under the limitations of the method.
The most critical technical factors are habituation, consistent object selection, fixed timing of the 5 h retention interval, and continuous but non-aversive monitoring during GH. Because NOR relies on spontaneous exploration, residual anxiety or poor arena habituation can suppress object exploration and obscure memory-related effects8. The prespecified exploration-time exclusion criterion and the intervention log provide practical quality controls that help distinguish a failed behavioral assay from a genuine memory phenotype. When overall exploration is low, novel-object preference is absent in NSD controls, GH intervention counts vary substantially, biomarker measurements show high variability, or SD mice show marked distress, investigators should review the corresponding troubleshooting procedures in Table 2 before repeating or interpreting the experiment.
Rather than representing a simple concatenation of previously established techniques, the incremental contribution of this protocol lies in four specific operational elements intended to address reproducibility rather than technique availability. First, the mandatory intervention log (Protocol Step 3 and Table 1) introduces a quantifiable, comparable record for standardizing GH intensity across cohorts and studies. The technique itself has an established history, whereas the present protocol emphasizes operational standardization of its implementation. This is consistent with the established history of GH as a total sleep-deprivation technique and the previously noted lack of standardization in its implementation across studies6. Second, the protocol enforces a same-cohort design in which behavioral and molecular endpoints are collected from identical, individually tracked animals within a single 10-day pipeline; this design is intended to reduce variation associated with collecting behavioral and biochemical endpoints in separate cohorts. Third, the protocol fixes the training and deprivation window to a defined circadian anchor (ZT1, Protocol Step 2) and requires that NSD and SD cohorts be maintained under matched light-phase conditions (Protocol Step 3), thereby controlling circadian timing within the workflow. Fourth, the protocol specifies a priori quality-control and analytical criteria, including a minimum exploration-time threshold (Protocol Step 7), transparent exclusion reporting, prospective power planning, tests of the DI against the 0.5 chance level, assumption testing, correction for multiple biomarker comparisons, and effect-size reporting. Together, these elements convert individually established methods into an explicit, transferable workflow that is proposed as a candidate reference framework against which individual laboratories may benchmark their own implementation, pending independent adoption and replication, rather than as a report of a specific biological finding.
The workflow has several limitations. GH is labor-intensive and requires continuous experimenter attention, which limits throughput. In addition, GH maintains wakefulness but does not by itself quantify sleep architecture. Future applications may incorporate pilot EEG/EMG validation to document vigilance states and verify the extent of sleep loss produced by the GH procedure before applying the workflow to a full experimental cohort. Future applications may also incorporate corticosterone measurements to evaluate stress-related effects of the intervention. These measurements are not part of the present protocol and therefore should not be interpreted as validation performed in this study. NOR is sensitive to recognition memory but does not comprehensively assess spatial navigation or working memory; complementary assays such as the Y-maze, Barnes maze, or other one-trial tasks can be added where a broader cognitive profile is required. The modified multiple platform method represents an alternative approach for experimentally inducing sleep loss and has been used to quantify sleep loss and recovery4; in contrast, the present GH workflow emphasizes mild sensory intervention without forced locomotion. However, because physiological stress markers were not measured directly in this protocol, no conclusion can be made here that GH produces a lower physiological stress response.
The method is therefore best viewed as a standardized entry platform rather than a complete model of all cognitive consequences of sleep loss. Its value lies in the explicit link between a controlled post-learning GH intervention, a behavioral readout designed to minimize physical handling relative to forced-locomotion paradigms, same-animal hippocampal collection, and transparent quality controls. NOR provides a well-established one-trial approach to assessing recognition memory7,8, and sleep deprivation has previously been associated with impaired object recognition9, hippocampal neuroinflammatory alterations10, and hippocampal oxidative stress and memory deficits11. Accordingly, this framework can facilitate comparisons across cohorts and provide a practical foundation for mechanistic studies and screening of interventions intended to mitigate sleep deprivation-associated cognitive impairment; previous work has also investigated interventions targeting sleep deprivation-associated cognitive impairment and neuroinflammation12. Consistent with this scope, the present submission focuses on establishing and standardizing the reproducible workflow while providing representative data demonstrating protocol performance; a more comprehensive dataset and broader biological interpretation may be reported separately in future work.
Disclosures
The authors declare no conflicts of interest.
Acknowledgements
This work was supported by the Nanjing Drum Tower Hospital Youth Cultivation Fund, the National Natural Science Foundation of China (Grant No. 82502706), and the Basic Research Program of Jiangsu (Grant No. BK20250258). AI-assisted tools were used during the preparation and revision of the manuscript, including for drafting and refining text and generating and refining schematic figures.
Materials
| Name | Company | Catalog Number | Comments |
|---|---|---|---|
| 70% ethanol | Any supplier | N/A | Cleaning of NOR arena and objects |
| Adult male C57BL/6J mice (8–12 weeks) | Zhejiang AILIMO Biotechnology Co., Ltd. | N/A | Experimental animals |
| BCA Protein Assay Kit | Thermo Fisher Scientific (Pierce) | 23225 | Total protein determination and normalization |
| Behavior-analysis software | Noldus Information Technology B.V. | EthoVision XT version 17.5 | NOR exploration scoring and analysis |
| Centrifuge capable of 14,000 × g at 4 °C | Eppendorf | Centrifuge 5424 R; Cat. 5404000610 | Clarification of hippocampal homogenates |
| Clean paper tubes | Any supplier | N/A | Gentle-handling intervention |
| Cryogenic personal protective equipment | Any supplier | N/A | Safe handling of liquid nitrogen |
| Glutathione Peroxidase Assay Kit | Abcam | ab102530 | GPx quantification |
| Hippocampal tissue homogenizer | IKA-Werke GmbH & Co. KG | T 10 basic ULTRA-TURRAX; Cat. 0003737000 | Homogenization of hippocampal tissue in lysis buffer |
| Liquid nitrogen | Any supplier | N/A | Snap-freezing of dissected hippocampi |
| MDA Assay Kit | Sigma-Aldrich | MAK085 | MDA quantification |
| Microplate reader | Agilent Technologies / BioTek | BioTek Epoch 2 Microplate Spectrophotometer | Absorbance measurement at kit-specified wavelengths |
| Micro-spatulas | Any supplier | N/A | Hippocampal dissection; used chilled |
| Mouse IL-1β ELISA Kit | R&D Systems | MLB00C | IL-1β quantification |
| Mouse IL-6 ELISA Kit | R&D Systems | M6000B | IL-6 quantification |
| Mouse TNF-α ELISA Kit | R&D Systems | MTA00B | TNF-α quantification |
| Object sets A/A′ and B | Any supplier | N/A | NOR familiarization and test phases |
| Opaque NOR arena (40 cm × 40 cm × 40 cm) | Any supplier | N/A | Behavioral testing |
| Overhead video-recording system | Basler AG | acA1300-60gm | Video recording of NOR familiarization and test sessions |
| Protease/Phosphatase Inhibitor Cocktail | Thermo Fisher Scientific (Thermo Scientific) | 78440 | Added to lysis buffer at 1× working concentration (10 µL/mL from a 100× stock) |
| RIPA Lysis Buffer | Thermo Fisher Scientific | 89900 | Hippocampal tissue homogenization |
| Sample tubes suitable for cryogenic storage | Thermo Fisher Scientific (Nunc) | Nunc CryoTube, 1.8 mL; Cat. 375418 | Maintenance of animal-specific sample IDs and storage of dissected hippocampal tissue |
| Soft brush | Any supplier | N/A | Gentle-handling intervention |
| SOD Assay Kit | Sigma-Aldrich | 19160 | SOD quantification |
| Statistical and power-analysis software | G*Power; Python Software Foundation | G*Power version 3.1; Python version 3.12 (SciPy 1.17; statsmodels 0.14) | A priori power analysis and statistical analyses described in Protocol Section 7 |
| Standard rodent chow | Jiangsu Xietong Pharmaceutical Bio-engineering Co., Ltd. | Irradiated Rat/Mouse Maintenance Diet; XTI01WC-010 | Ad libitum animal feeding |
| −80 °C freezer | Haier Biomedical | DW-86L626 | Long-term storage of snap-frozen hippocampal tissue |
References
- Walker MP, Stickgold R. Sleep, memory, and plasticity. Annual Review of Psychology. 2006;57:139-166.
- Musiek ES, Holtzman DM. Mechanisms linking circadian clocks, sleep, and neurodegeneration. Science. 2016;354(6315):1004-1008.
- Havekes R, Abel T. The tired hippocampus: the molecular impact of sleep deprivation on learning and memory. Current Opinion in Neurobiology. 2017;44:33-39.
- Machado RB, Hipólide DC, Benedito-Silva AA, Tufik S. Sleep deprivation induced by the modified multiple platform technique: quantification of sleep loss and recovery. Brain Research. 2004;1004(1-2):45-51.
- Hagewoud R, et al. Sleep deprivation impairs spatial working memory and reduces clearance of hippocampal β-amyloid in rats. Neurobiology of Aging. 2013;34(1):22-30.
- Fenzl T, et al. Fully automated sleep deprivation in mice as a tool in sleep research. J Neurosci Methods. 2007;166(2):229-35.
- Ennaceur A, Delacour J. A new one-trial test for neurobiological studies of memory in rats. 1: Behavioral data. Behavioural Brain Research. 1988;31(1):47-59.
- Leger M, et al. Object recognition test in mice. Nature Protocols. 2013;8(12):2531-2537.
- Palchykova S, et al. Sleep deprivation impairs object recognition in mice. Neurobiology of Learning and Memory. 2006;85(3):263-271.
- Wadhwa M, et al. Sleep deprivation induces spatial memory impairment by altered hippocampus neuroinflammation and microglia activation in rats. Journal of Neuroimmunology. 2011;238(1-2):14-23.
- Silva RH, et al. Role of hippocampal oxidative stress in memory deficits induced by sleep deprivation in mice. Neuropharmacology. 2016;104:1-8.
- Wang Y, et al. Ellagic acid ameliorates sleep deprivation-induced cognitive impairment and neuroinflammation in mice. Aging. 2020;12(10):10327-10340.