This protocol presents a method for generating vascular organoids using human induced pluripotent stem cells.
Method Article
An Optimized Protocol for the Generation of Vascular Organoids from Human Induced Pluripotent Stem Cells
In This Article
Summary
Abstract
Vascular organoids derived from human pluripotent stem cells (hPSCs) have emerged as powerful three-dimensional models for studying vascular development, disease mechanisms, and drug responses. Current vascular organoid protocols enable the generation of self-organizing endothelial–pericyte networks; however, batch-to-batch variability, inconsistent organoid formation, and inadequate pericyte coverage can compromise reproducibility and scalability. This study presents an optimized protocol for generating vascular organoids from human induced pluripotent stem cells (hiPSCs) with improved reproducibility and structural consistency. Key modifications include refined embryoid body formation conditions, optimized growth factor concentrations and timing during mesoderm induction and vascular specification, and improved three-dimensional culture conditions that promote robust pericyte recruitment and endothelial–pericyte interactions. The optimized organoids exhibit highly branched CD31-positive endothelial networks consistently ensheathed by PDGFR-β-positive pericytes, with significantly reduced batch-to-batch variability compared with the original protocol. Detailed, step-by-step procedures are provided for organoid generation, whole-mount immunofluorescence characterization, and quality control assessment. This optimized method enables the scalable production of high-quality vascular organoids suitable for studying vascular cell interactions, modeling disease, and screening compounds, thereby lowering the technical barrier for laboratories seeking to adopt this model system.
Introduction
Three-dimensional (3D) organoids have emerged as powerful tools for modeling human organ development and disease in vitro, offering superior structural biomimicry and pathophysiological relevance compared with conventional two-dimensional cell culture models1,2. In recent years, human pluripotent stem cell (hPSC)-derived organoids have been successfully established for multiple tissue types, including the intestine3, brain4,5, kidney6, liver7,8, and retina9. However, a major challenge in organoid-based studies is insufficient vascularization during long-term culture, which can lead to hypoxia and necrosis, thereby impeding organoid expansion and differentiation10,11. To address this limitation, various co-culture strategies have been introduced, including incorporating endothelial cells or mesenchymal stem cells to promote vascular network formation12,13. However, conventional two-dimensional cultures and animal models do not fully recapitulate human vascular biology, whereas co-culture approaches introduce additional experimental complexity14. Vascular organoids capable of autonomous vascularization, therefore, offer a promising human-relevant alternative15.
Vascular network formation involves both vasculogenesis and angiogenesis, which are orchestrated through interactions between endothelial cells and mural cells, such as pericytes and vascular smooth muscle cells, and are tightly regulated by multiple signaling molecules, including VEGF (vascular endothelial growth factor), TGF-β (transforming growth factor-β), PDGF (platelet-derived growth factor), and angiopoietins16. In 2019, Wimmer and colleagues established a method for generating self-assembling 3D blood vessel organoids directly from hPSCs17,18. This system simultaneously generates endothelial cells and pericytes, resulting in microvascular networks with lumen formation and basement membrane coverage. Building on this platform, vascular organoids have been used to model diabetic vasculopathy under high-glucose and pro-inflammatory cytokine stimulation (TNF-α and IL-6); these organoids recapitulate basement membrane thickening, a hallmark of diabetic microvascular pathology17. In addition, this model has been used to study hereditary vascular diseases and to serve as a platform for vascular toxicity screening19. More recently, several method-oriented studies have sought to optimize vascular organoid generation. For example, advances in single-cell RNA sequencing have identified key regulatory factors, such as MECOM and LEF1, thereby providing a molecular framework for characterizing and optimizing human vascular organoid formation. In addition, Xu et al. introduced microwells to facilitate homogeneous embryoid body formation and incorporated the CEPT cocktail to improve cell viability, thereby effectively reducing batch-to-batch variability20.
To improve the homogeneity, reproducibility, and throughput of vascular organoid generation, the original protocol described by Wimmer et al.17,18 was systematically optimized to address several key limitations. First, the original protocol employs natural aggregation in low-attachment plates for embryoid body formation, which can result in substantial batch-to-batch variability in aggregate size and, consequently, heterogeneous differentiation efficiency. In the optimized protocol, polyvinyl alcohol (PVA) is combined with orbital shaking during aggregate formation to promote uniform cell aggregation and improve consistency in embryoid body size. Second, the original protocol uses complete medium replacement during the vascular network formation stage, which may cause substantial fluctuations in growth factor concentrations and compromise sustained vascular sprouting and pericyte recruitment. In contrast, the optimized protocol retains one-third of the conditioned medium during each medium change to maintain endogenous pro-angiogenic factors and stabilize the culture environment. Third, the original protocol requires multiple plate transfers during organoid isolation and maturation, increasing handling requirements and the risk of organoid loss. The optimized protocol bypasses these steps by transferring isolated organoids individually into wells of 96-well low-attachment plates, thereby simplifying the procedure and increasing throughput. Collectively, this optimized protocol provides detailed step-by-step procedures and critical quality-control checkpoints to lower the technical barrier to adopting this model system and facilitate the broader application of vascular organoids in studies of vascular development, disease mechanisms, and high-throughput drug screening.
Protocol
The use of hPSCs in this study was approved by the Biomedical Ethics Committee of Anhui University (BECAHU_2026-010).
1. Maintenance of human induced pluripotent stem cells
NOTE: Maintain human induced pluripotent stem cells (hiPSCs) under feeder-free conditions. Perform all procedures in a Class II biological safety cabinet using aseptic technique.
- Preparation of basement membrane matrix-coated culture plates
- Remove a vial of basement membrane matrix from −20 °C and thaw it at 4 °C overnight for approximately 12–16 h. Avoid repeated freeze–thaw cycles.
- Mix the thawed basement membrane matrix thoroughly under sterile conditions and divide it into single-use aliquots (e.g., 1 mL per tube). Store the aliquots at −20 °C for up to 2 years.
NOTE: Keep basement membrane matrix, pipettes, tips, and tubes cold during handling to prevent premature solidification. Avoid introducing air bubbles. - Thaw the required basement membrane matrix aliquot on ice. Dilute the basement membrane matrix 1:200 in prechilled DMEM (5 µL of basement membrane matrix per 1 mL of DMEM; final concentration, approximately 5 µg/mL).
- Mix the solution gently by pipetting until no visible particulates remain.
- Add 0.5 mL of diluted basement membrane matrix to each well of a 12-well plate. Gently tilt and rotate the plate to coat the entire bottom surface.
- Incubate the coated plate at 37 °C in a 5% CO₂ incubator for at least 2 h or at 4 °C overnight.
NOTE: Store sealed coated plates at 4 °C for 1–2 weeks. Equilibrate the plate to room temperature and aspirate the coating solution immediately before use.
- Thawing of hiPSCs
- Remove a cryovial of frozen hiPSCs from liquid nitrogen and immediately place it in a 37 °C water bath. Gently agitate the vial and remove it within 1 min, when only a few small ice crystals remain.
NOTE: Avoid prolonged exposure to dimethyl sulfoxide (DMSO) at 37 °C and incomplete thawing, as both can reduce cell viability. - Disinfect the outside of the cryovial with 70% ethanol and open it inside the biological safety cabinet.
- Slowly transfer the cell suspension dropwise into a 15 mL conical tube containing 3 mL of prewarmed chemically defined hPSC maintenance medium, or an equivalent chemically defined maintenance medium. Mix gently during transfer to dilute the DMSO gradually and minimize osmotic stress.
- Centrifuge the cells at 300 × g for 3 min at room temperature (22–24 °C) using a swinging-bucket rotor.
- Carefully aspirate the supernatant without disturbing the cell pellet. Gently resuspend the pellet in 1 mL of prewarmed chemically defined hPSC maintenance medium.
NOTE: Use a P1000 pipette and pipette gently 2–3 times to minimize mechanical shear and bubble formation.
- Remove a cryovial of frozen hiPSCs from liquid nitrogen and immediately place it in a 37 °C water bath. Gently agitate the vial and remove it within 1 min, when only a few small ice crystals remain.
- Plating and culture of hiPSCs
- Remove the precoated 12-well plate from the incubator and aspirate the coating solution. Do not wash the wells.
- Seed approximately 1 × 10⁵–2 × 10⁵ viable cells per well for routine recovery after thawing. Adjust the density according to the hiPSC line and experimental requirements.
- Dispense the cell suspension slowly along the wall of each well without touching the coated surface with the pipette tip.
- Add Y-27632 to a final concentration of 5 µM to promote cell survival and attachment after thawing.
NOTE: Use Y-27632 only in the initial plating medium. Replace it with Y-27632-free chemically defined hPSC maintenance medium the following day. - Incubate the cells at 37 °C with 5% CO₂ and saturated humidity.
- Examine cell attachment and morphology after approximately 16–24 h. Aspirate the medium and replace it with fresh, prewarmed chemically defined hPSC maintenance medium without Y-27632.
- Replace the medium daily or every other day until the cells reach approximately 70%–80% confluency for passaging or differentiation.
NOTE: Examine the cultures daily. Use colonies with compact, well-defined borders, a high nuclear-to-cytoplasmic ratio, and minimal spontaneous differentiation.
2. Generation and differentiation of hiPSC aggregates
NOTE: Maintain hiPSCs under feeder-free conditions in chemically defined hPSC maintenance medium on basement membrane matrix-coated plates. Passage the cells every 4–5 days using 0.02% EDTA. Use cultures with appropriate seeding density and colony size and minimal spontaneous differentiation to maximize vascular differentiation efficiency.
- Preparation of a single-cell suspension
- Aspirate the chemically defined hPSC maintenance medium and wash the hiPSCs with 0.5 mL of DMEM per well of a 6-well plate.
- Aspirate the DMEM and add 0.5 mL of 0.02% EDTA per well. Incubate at room temperature for 2–4 min and monitor the cells until they begin to round up.
- Detach the cells using a P1000 pipette. Pipette gently 2–3 times to dissociate the aggregates into a single-cell suspension.
- Resuspend the cells in 5 mL of chemically defined hPSC maintenance medium and transfer the suspension to a 15 mL conical tube.
- Mix 10 µL of the cell suspension with 10 µL of 0.1% Trypan blue solution. Load 10 µL of the mixture onto a counting chamber and determine the number of viable cells.
- Calculate the volume of cell suspension required to obtain 5 × 10⁵ viable cells per well.
- Centrifuge the cells at 300 × g for 5 min at room temperature (22–23 °C). Aspirate the supernatant.
- Resuspend the cells in fresh chemically defined hPSC maintenance medium containing 50 µM Y-27632 at a volume of 3 mL per well.
- Aggregate formation
- Add 3 mL of the cell suspension to each well of a low-attachment 6-well plate. Add PVA to a final concentration of 0.25%.
- Place the plate on an orbital shaker at 50 rpm and incubate at 37 °C for 1 day.
- Confirm the formation of aggregates with smooth borders and a diameter of approximately 50–100 µm or greater before proceeding.
- NOTE: Optimize the aggregation period for individual hiPSC lines. Extend incubation to 2–3 days when necessary to obtain aggregates of the desired size.
- Mesoderm induction
- On Day 0, transfer the aggregates to a 15 mL conical tube using a sterile 10 mL disposable pipette. Retain the original low-attachment plate for replating.
- Allow the aggregates to settle by gravity for approximately 15–20 min.
- NOTE: Handle aggregates gently and use gravity sedimentation rather than centrifugation to minimize mechanical damage.
- Carefully aspirate the supernatant after the aggregates have settled.
- Resuspend the aggregates in 3 mL per well of N2B27 medium supplemented with 12 µM CHIR99021 and 30 ng/mL BMP-4.
- Transfer the aggregates back to the low-attachment plate and incubate at 37 °C.
- Pipette the aggregates gently once daily with a P1000 pipette to minimize excessive aggregate fusion. Continue mesoderm induction for 3 days.
- Vascular lineage induction
- On Day 3, transfer the aggregates to a 15 mL conical tube and allow them to settle by gravity. Retain the original 6-well plate.
- Carefully aspirate the supernatant after the aggregates have settled.
- Resuspend the aggregates in 3 mL per well of N2B27 medium supplemented with 100 ng/mL VEGF-A and 2 µM forskolin.
- Transfer the aggregates back to the low-attachment 6-well plate and incubate for an additional 2 days.
3. Generation of vascular networks and organoids
- Preparation of the collagen I–basement membrane matrix
- Collect the aggregates generated in one 6-well plate for embedding into one 12-well plate. Use approximately 40–60 aggregates per well.
- Prepare sufficient collagen I–basement membrane matrix mixture to add two 0.5 mL layers to each well of the 12-well plate.
- Prepare 12 mL of matrix for one 12-well plate. Keep all components on ice, prepare the mixture immediately before use, and avoid introducing air bubbles.
- Add 0.5 mL of matrix to each well of the 12-well plate. Gently swirl the plate to distribute the matrix evenly.
- Incubate the plate at 37 °C for 2 h to allow the first matrix layer to solidify.
- Embedding of aggregates
- Transfer the aggregates to a 15 mL conical tube using a sterile 10 mL disposable pipette and allow them to settle by gravity.
- Aspirate the supernatant and wash the aggregates twice with 1 mL of N2B27 medium. Remove as much residual medium as possible after the final wash.
- Prepare a fresh collagen I–basement membrane matrix mixture and keep it on ice.
- Resuspend the washed aggregates gently in the freshly prepared matrix.
- Remove the 12-well plate containing the solidified first layer from the incubator.
- Add 0.5 mL of the aggregate-containing matrix to each well.
- Rock the plate gently for no longer than 1 min to distribute the aggregates evenly.
- Immediately incubate the plate at 37 °C for 2 h to allow the second layer to solidify.
- Induction of vascular sprouting
- Prewarm N2B27 medium supplemented with 15% FBS, 100 ng/mL VEGF-A, and 100 ng/mL FGF-2 to 37 °C.
- Add the prewarmed supplemented medium to each well to induce vascular differentiation.
- Monitor the cultures for vascular sprouting over the next 1–3 days.
- NOTE: Prewarm the medium to 37 °C before adding it to the cultures to minimize gel matrix destabilization.
- Medium exchange and culture maintenance
- Perform the first medium change 3 days after embedding.
- Replace the medium every other day thereafter using fresh N2B27 medium containing 15% FBS, 100 ng/mL VEGF-A, and 100 ng/mL FGF-2.
- Retain one-third of the conditioned medium during each medium change and replace the remaining two-thirds with fresh supplemented medium.
- Proceed with vascular organoid isolation on Day 10.
4. Establishment of vascular organoids and preparation for staining
- Isolation of individual vascular networks
- Insert the rounded end of a sterile spatula along the edge of the well and gently detach the gel matrix from the bottom.
- Continue moving the spatula from the well edge toward the center until the entire gel matrix floats freely.
- Use two sterile needles to excise individual vascular networks from the gel. Remove as much excess matrix as possible without damaging the vascular network.
- Culture of isolated organoids
- Transfer each isolated organoid directly into an individual well of a low-attachment 96-well plate using a sterile disposable pipette.
- Add 100 µL of N2B27 medium supplemented with 15% FBS, 100 ng/mL VEGF-A, and 100 ng/mL FGF-2 to each well.
- Incubate the organoids for an additional 5 days and replace the supplemented medium daily.
- Confirm that the organoids exhibit a rounded and fully encapsulated morphology by Day 5 of maturation.
- Fixation of vascular organoids
- Transfer morphologically mature organoids to 2 mL microcentrifuge tubes. Process no more than approximately 60 organoids per tube.
- Carefully aspirate the medium and add 4% paraformaldehyde (PFA) in PBS.
- Fix the organoids at room temperature for 1 h.
CAUTION: PFA is toxic and a suspected carcinogen. Handle PFA in a chemical fume hood while wearing appropriate personal protective equipment. - Aspirate the PFA and replace it with PBS.
PAUSE POINT: Store fixed vascular organoids in PBS at 4 °C for up to 1 month.
5. Staining and confocal imaging of vascular organoids
- Blocking and permeabilization
- Add 2 mL of blocking buffer to each tube containing fixed vascular organoids.
- Position the tubes vertically on an orbital shaker and incubate with agitation at room temperature for 2 h to block and permeabilize the organoids.
- Primary antibody incubation
- Aspirate the blocking buffer and add 50–100 µL of primary antibody diluted 1:100 in blocking buffer.
- Position the tubes upright on a shaker and incubate with agitation at 4 °C overnight.
- Washing and secondary antibody incubation
- Wash the samples three times with PBST for 10–15 min per wash. Agitate the vertically positioned tubes during each wash.
- Add fluorescent secondary antibody diluted 1:300 in blocking buffer.
- Incubate the samples at room temperature for 2 h.
- Nuclear counterstaining and final washing
- Wash the samples twice with PBST for 10–15 min per wash.
- Add Hoechst solution diluted 1:5,000 in PBS and incubate at room temperature for 10–15 min.
- Wash the samples with PBS for 10–15 min.
- Confocal imaging
- Transfer the stained organoids to confocal imaging dishes.
- Acquire confocal images using consistent imaging parameters across experimental groups.
- Quantitative image analysis of vascular organoids
NOTE: Perform quantitative image analysis using Fiji/ImageJ and AngioTool. Maintain identical microscope acquisition settings across all experimental groups.- Aggregate diameter measurement
- Acquire bright-field images of Day 0 hiPSC aggregates using an inverted microscope with a calibrated scale. Image well-separated aggregates and include a scale bar.
- Import each image into Fiji/ImageJ. Draw a line along the scale bar using the Straight Line tool and select Analyze > Set Scale.
- Enter the known distance and unit (e.g., 100 µm) and select Global to apply the calibration to all images in the session.
- Draw a line across the widest diameter of each aggregate using the Straight Line tool. Select Analyze > Measure or press Ctrl+M and record the diameter in µm.
- Measure at least 30 aggregates per batch.
- For nonspherical aggregates, outline each aggregate using the Oval or Polygon Selection tool. Select Analyze > Set Measurements > Feret's diameter and record the measurement.
- Export the measurements from the Results table and compile the data in a spreadsheet.
- Calculate the mean, standard deviation (SD), and coefficient of variation (CV) as CV = SD/mean × 100% for each batch.
- Organoid diameter measurement
- Acquire bright-field images of mature vascular organoids on Day 15 using an inverted microscope with a calibrated scale. Include a scale bar in each image.
- Import each image into Fiji/ImageJ and calibrate the scale as described in step
- Draw a line across the widest diameter of each organoid using the Straight Line tool. Select Analyze > Measure or press Ctrl+M and record the diameter in µm.
- Measure at least 30 organoids per batch.
- For irregularly shaped organoids, measure the longest and shortest diameters and calculate their average, or determine Feret's diameter as described in step 5.6.1.6.
- Export the measurements and calculate the mean, SD, and CV for each batch.
- Quantification of CD31-positive vascular area
- Acquire confocal z-stack images of Day 15 whole-mount organoids stained for CD31. Use identical laser power, gain, offset, and pinhole settings for all samples.
- Generate maximum-intensity projections (MIPs) from the z-stacks using the microscope software or Fiji/ImageJ.
- Apply an intensity threshold to segment the CD31-positive vascular network while excluding background signal.
- Select Process > Noise > Remove Outliers and use a radius of 2–5 pixels to remove small artifacts. Select Process > Binary > Fill Holes to fill small gaps within the vascular network.
- Select Analyze > Set Measurements and enable Area and Area fraction. Select Analyze > Measure to determine the vascular area.
- Calculate the CD31-positive vascular area as a percentage of the total organoid area.
- Analyze at least three organoids per batch from three independent batches. Export the measurements for statistical analysis.
- Quantification of PDGFR-β-positive pericyte coverage
- Acquire confocal z-stack images of Day 15 whole-mount organoids stained for CD31 and PDGFR-β. Generate MIPs from the z-stacks.
- Import the CD31 and PDGFR-β MIPs into Fiji/ImageJ and verify image alignment.
- Threshold the CD31 channel to generate a binary mask defining the vascular network.
- Threshold the PDGFR-β channel using the same segmentation approach to generate a binary mask of the pericyte signal.
- Select Process > Image Calculator and apply the AND operation to the CD31 and PDGFR-β masks to identify overlapping pixels.
- Measure the area of the overlapping signal.
- Calculate pericyte coverage as (PDGFR-β-positive area within CD31-positive vessels/total CD31-positive vascular area) × 100%.
- Analyze at least three organoids per batch from three independent batches. Export the measurements for statistical analysis.
- Branching index analysis using AngioTool
- Acquire confocal z-stack images of Day 15 whole-mount organoids stained for CD31. Generate MIPs from the z-stacks.
- Launch AngioTool and load the MIP image.
- Set the vessel diameter according to the typical vessel diameter observed in the images.
- Adjust the intensity threshold to segment the vascular network while excluding the background signal. Set the minimum vessel size to exclude small artifacts.
- Run the analysis and record vessel area, vessel density, total vessel length, number of junctions, and branching index.
- Verify the output image by confirming that the vasculature is outlined in yellow, the vascular skeleton is displayed in red, and branching points are marked with blue dots.
- Export the quantitative results from AngioTool.
- Analyze at least three fields of view per batch from three independent batches and compile the data for statistical analysis.
- Aggregate diameter measurement
6. Quantitative real-time PCR analysis of vascular organoids
NOTE: Perform all RNA isolation and downstream procedures under RNase-free conditions.
- RNA extraction
- Collect 5–10 mature Day 15 vascular organoids in a 1.5 mL RNase-free microcentrifuge tube. Remove the residual medium completely.
NOTE: Pool multiple organoids when necessary to obtain sufficient RNA. - Add 350 µL of lysis buffer supplemented with 1% β-mercaptoethanol.
- Pipette the samples 10–15 times until the organoids are completely lysed.
- Transfer the lysate to a genomic DNA elimination spin column positioned in a collection tube. Centrifuge at 11,000 × g for 30 s at room temperature.
- Discard the column and retain the flow-through.
- Add an equal volume of 70% ethanol, approximately 350 µL, to the flow-through and mix thoroughly by pipetting.
- Transfer up to 700 µL of the mixture to an RNA spin column positioned in a collection tube. Centrifuge at 11,000 × g for 30 s and discard the flow-through.
- Add 350 µL of wash buffer 1 to the column. Centrifuge at 11,000 × g for 30 s and discard the flow-through.
- Prepare the DNase I mixture by combining 10 µL of DNase I with 70 µL of DNase digestion buffer per sample.
- Add 80 µL of the DNase I mixture directly to the column membrane and incubate at room temperature for 15 min.
- Add 350 µL of wash buffer 1 to the column. Centrifuge at 11,000 × g for 30 s and discard the flow-through.
- Add 500 µL of wash buffer 2 to the column. Centrifuge at 11,000 × g for 30 s and discard the flow-through.
- Repeat the wash with 500 µL of wash buffer 2.
- Centrifuge the empty column at 11,000 × g for 2 min to dry the membrane.
- Transfer the column to a fresh 1.5 mL RNase-free microcentrifuge tube. Add 30–50 µL of RNase-free water directly to the membrane and incubate at room temperature for 1 min.
- Centrifuge at 11,000 × g for 1 min to elute the RNA. Store the RNA at −80 °C until use.
NOTE: Assess RNA concentration and purity by spectrophotometry. Use an A260/A280 ratio of 1.8–2.1 as the acceptable range.
- Collect 5–10 mature Day 15 vascular organoids in a 1.5 mL RNase-free microcentrifuge tube. Remove the residual medium completely.
- cDNA synthesis
- Prepare the reverse- reaction mixture on ice.
- Combine 600 ng of total RNA with 4 µL of RT master mix containing reverse transcriptase, buffer, dNTPs, and random primers. Add RNase-free water to a final volume of 20 µL.
- Incubate the reaction at 37 °C for 15 min, followed by 85 °C for 5 s.
- Store the resulting cDNA at −20 °C until use.
- Quantitative real-time PCR
- Prepare 9 µL of qPCR master mix per reaction by combining 5 µL of 2× SYBR Green master mix, 3 µL of RNase-free water, and 1 µL of premixed forward and reverse primers at 10 µM each.
- Dispense 9 µL of master mix into each well of a 96-well qPCR plate.
- Add 1 µL of cDNA to each well to obtain a final reaction volume of 10 µL.
- Seal the plate with optical adhesive film and centrifuge at 1,000 × g for 1 min.
- Perform initial denaturation at 95 °C for 30 s.
- Perform 40 amplification cycles of 95 °C for 5 s followed by 60 °C for 30 s.
- Perform melt-curve analysis to confirm amplicon specificity.
NOTE: Run each sample in duplicate or triplicate. - Calculate relative target-gene expression using the 2−ΔΔCt method. Normalize Ct values to the housekeeping gene (e.g., GAPDH) and calibrate expression against undifferentiated hiPSC samples.
7. Statistical analysis
- Present quantitative data as the mean ± standard deviation (SD) from at least three independent biological replicates (n ≥ 3) per condition.
- Treat each independent batch as one biological replicate for aggregate and organoid diameter measurements, and average the 30 individual structures measured within each batch to obtain a single batch-level mean.
- Average vascular area, pericyte coverage, and branching index measurements from multiple organoids or fields within each batch to obtain a single batch-level value, and use these batch-level values for statistical comparisons.
- Compare the optimized protocol with the original Wimmer protocol using an unpaired two-tailed Student's t-test.
- Define statistical significance as p < 0.05. Indicate significance levels as p < 0.05, p < 0.01, and p < 0.001, as applicable.
- Perform all statistical analyses using statistical analysis software version 10.
Results
The optimized protocol described here enables the generation of mature vascular organoids from hiPSCs within approximately 15 days using a stepwise differentiation strategy (Figure 1A). Briefly, hiPSC aggregates were generated in low-attachment plates supplemented with 0.25% PVA on an orbital shaker (Day −1). Mesoderm induction was initiated on Day 0 using CHIR99021 (12 µM) and BMP-4 (30 ng/mL) for 3 days, followed by vascular lineage specification with VEGF-A (100 ng/mL) and forskolin (2 µM) for 2 days (Days 3–5). On Day 5, the aggregates were embedded in a collagen I–basement membrane matrix and cultured in N2B27 medium supplemented with VEGF-A (100 ng/mL), FGF-2 (100 ng/mL), and 15% FBS to promote vascular sprouting. On Day 10, individual vascular networks were isolated from the gels and transferred to low-attachment 96-well plates, with one organoid per well, for further maturation. By Day 15, mature vascular organoids with a rounded, fully encapsulated morphology were obtained (Figure 1B).
To confirm the vascular identity of the differentiated cells, whole-mount immunofluorescence staining was performed for the endothelial marker CD31, together with Hoechst nuclear counterstaining. Confocal microscopy revealed extensive CD31-positive endothelial networks forming branched tubular structures. Three-dimensional reconstruction of z-stack images further demonstrated the complexity of the vascular networks within the organoids (Figure 1C). Differentiation efficiency was also assessed by quantitative real-time PCR analysis of vascular lineage-specific genes. Expression of the endothelial markers CD31 and CDH5 and the pericyte marker PDGFR-β was significantly upregulated in Day 15 organoids compared with undifferentiated hiPSCs. In contrast, expression of the pluripotency markers OCT4, SOX2, and NANOG was markedly downregulated, confirming successful differentiation toward the vascular lineage (Figure 1D). Co-staining for CD31 and PDGFR-β showed that PDGFR-β-positive pericytes were closely associated with and ensheathed the CD31-positive endothelial tubes, indicating the formation of vascular structures with pericyte coverage (Figure 1E). Collectively, these results demonstrate that the optimized protocol reliably generates vascular organoids comprising both endothelial cells and pericytes within a complex three-dimensional vascular network.
To systematically evaluate the improvements achieved by the optimized protocol, quantitative morphometric analyses were performed to compare organoids generated with the original Wimmer protocol and those generated with the optimized protocol across multiple independent batches. Bright-field microscopy revealed marked morphological differences between the two protocols throughout differentiation. Whereas the original protocol yielded aggregates and organoids of heterogeneous sizes and irregular shapes at multiple stages, the optimized protocol produced consistently uniform aggregates with smooth borders from Day 0, which subsequently developed into more rounded, uniformly sized mature vascular organoids by Day 15 (Figure 2A).
Quantitative analysis of aggregate diameter on Day 0 confirmed that the optimized protocol generated significantly more uniform aggregates (120.3 ± 5.4 µm, CV = 4.47%; 30 aggregates measured per batch; n = 3 independent batches) than the original protocol (112.2 ± 34.7 µm, CV = 30.93%; n = 3 independent batches; t = 6.159, df = 4, p = 0.004; Figure 2B). This improvement in uniformity was maintained through the differentiation endpoint. Day 15 organoids generated using the optimized protocol exhibited substantially reduced size variability (670.8 ± 63.5 µm, CV = 9.47%; 30 organoids measured per batch; n = 3 independent batches) compared with those generated using the original protocol (615.4 ± 270.9 µm, CV = 44.0%; n = 3 independent batches; t = 8.430, df = 4, p = 0.001; Figure 2C).
Vascular network formation was next assessed by quantifying CD31-positive endothelial coverage and PDGFR-β-positive pericyte coverage. Across three independent batches, the optimized protocol produced significantly greater endothelial coverage than the original protocol (40.1 ± 2.9% vs. 28.0 ± 7.0%; t = 2.856, df = 4, p = 0.05; Figure 2D). Pericyte coverage was also significantly greater with the optimized protocol (36.2 ± 2.5% vs. 17.5 ± 5.2%; t = 6.636, df = 4, p = 0.003) (Figure 2E). Branching index analysis using AngioTool further showed that organoids generated using the optimized protocol formed more complex vascular networks (50.2 ± 3.8 vs. 24.1 ± 6.9 points/mm2; t = 6.163, df = 4, p = 0.004; Figure 2F). Finally, overall organoid formation efficiency was evaluated as the percentage of initial aggregates that developed into mature vascular organoids by Day 15. Across three independent batches, the optimized protocol achieved a significantly higher formation efficiency (64.3 ± 3.8%; n = 3) than the original protocol (41.3 ± 10.8%; n = 3; t = 3.433, df = 4, p = 0.03), corresponding to an approximately 1.6-fold increase in organoid yield (60–67 vs. 29–50 organoids per 1 × 10⁶ starting cells; Figure 2G). The optimized protocol also substantially reduced batch-to-batch variability (SD, 3.8% vs. 10.8%), further demonstrating improved reproducibility.
The quantitative outcomes of the original and optimized protocols, including aggregate and organoid diameter, organoid yield and formation efficiency, vascular area, pericyte coverage, branching index, failure rate, and batch-to-batch variability, are summarized in Table 1. The compositions of the media and matrix solutions used for hiPSC maintenance and vascular organoid differentiation are provided in Table 2, and the blocking buffer formulation used for whole-mount immunofluorescence staining is provided in Table 3. Primer sequences used for quantitative real-time PCR analysis are listed in Table 4. Working concentrations and preparation conditions for the key reagents used during vascular organoid generation and characterization are provided in Supplementary Table 1.
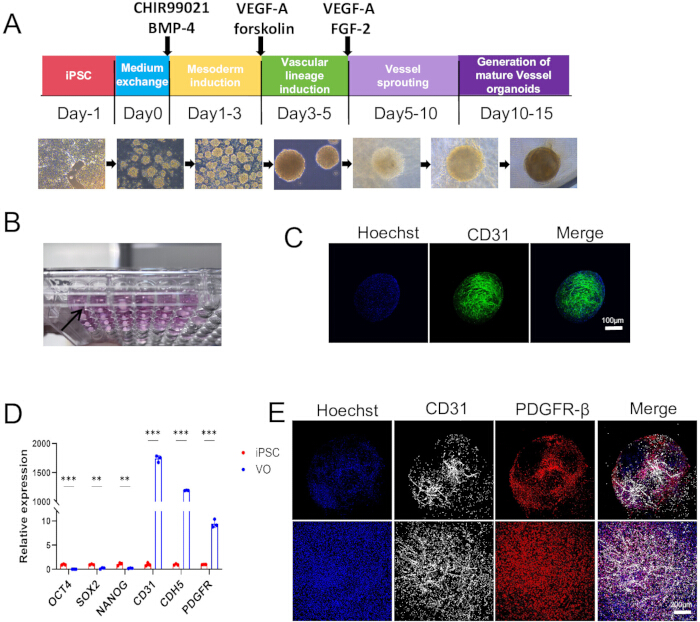
Figure 1: Generation and characterization of vascular organoids derived from human induced pluripotent stem cells. (A) Schematic representation of the stepwise vascular organoid differentiation protocol. hiPSC aggregates undergo mesoderm induction with CHIR99021 and BMP-4, followed by vascular lineage induction with VEGF-A and forskolin, vascular sprouting in the presence of VEGF-A and FGF-2, and subsequent maturation into vascular organoids. Representative bright-field images illustrate morphological changes during differentiation from Day −1 to Day 15. (B) Representative macroscopic image of mature vascular organoids cultured individually in a 96-well plate. (C) Representative confocal images of a Day 15 vascular organoid stained for CD31 (green) and counterstained with Hoechst (blue), showing the endothelial network within the organoid. Scale bar = 100 µm. (D) Quantitative real-time PCR analysis of the pluripotency markers OCT4, SOX2, and NANOG and the vascular lineage markers CD31, CDH5, and PDGFR-β in Day 15 vascular organoids (VO) compared with undifferentiated hiPSCs. Data are presented as mean ± SD from three independent experiments. Statistical significance was determined using an unpaired two-tailed Student's t-test. (E) Representative whole-mount immunofluorescence images of a Day 15 vascular organoid stained for CD31 (white), PDGFR-β (red), and Hoechst (blue), demonstrating the association of PDGFR-β-positive pericytes with CD31-positive endothelial networks. Scale bar = 200 µm. Please click here to view a larger version of this figure.
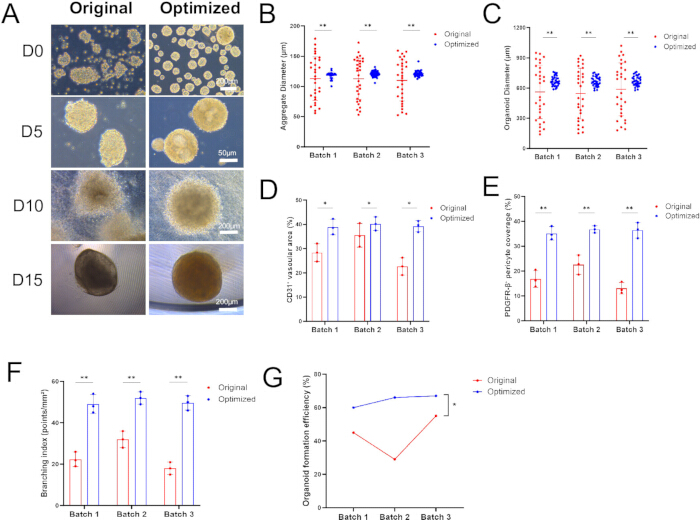
Figure 2: Quantitative comparison of vascular organoids generated using the original Wimmer protocol and the optimized protocol. (A) Representative bright-field images showing the morphology of aggregates and vascular organoids generated using the original and optimized protocols at Day 0 (D0), Day 5 (D5), Day 10 (D10), and Day 15 (D15). Scale bars = 200 µm (D0), 50 µm (D5), 200 µm (D10), and 200 µm (D15). (B) Quantification of aggregate diameter at Day 0 across three independent batches. Thirty aggregates were measured per batch and per condition, and the results were averaged to obtain a batch-level mean. (C) Quantification of organoid diameter at Day 15 across three independent batches. Thirty organoids were measured per batch and per condition, and the measurements were averaged to obtain a batch-level mean. (D) Quantification of CD31-positive vascular area in organoids generated using the original and optimized protocols across three independent batches. (E) Quantification of PDGFR-β-positive pericyte coverage across three independent batches. (F) Quantification of the vascular branching index using AngioTool across three independent batches. (G) Organoid formation efficiency across three independent batches, calculated as the percentage of initial aggregates that developed into mature vascular organoids by Day 15. Data are presented as mean ± SD of three independent batch-level means (n = 3 independent batches per condition). Statistical significance was determined using an unpaired two-tailed Student's t-test on batch-level means. Please click here to view a larger version of this figure.
Table 1: Quantitative comparison of vascular organoid generation using the original Wimmer protocol and the optimized protocol. Comparison of aggregate diameter and size variability at Day 0, organoid diameter and size variability at Day 15, organoid yield, organoid formation efficiency, CD31-positive vascular area, PDGFR-β-positive pericyte coverage, vascular branching index, failure rate, and batch-to-batch variability. Values are presented as mean ± SD where applicable. Aggregate and organoid measurements were obtained from 30 structures per batch across three independent batches per condition. Vascular area, pericyte coverage, and branching measurements were obtained from at least three organoids or fields per batch across three independent batches. Abbreviations: CV = coefficient of variation; SD = standard deviation. Please click here to download this Table.
Table 2: Preparation of media and matrix solutions for hiPSC maintenance and vascular organoid differentiation. Composition and preparation of chemically defined hPSC maintenance medium (PGM1), basement membrane matrix coating solution, 0.02% EDTA passaging wash solution, N2B27 basal medium, N2B27 complete differentiation medium, and collagen I solution used for hiPSC maintenance, differentiation, vascular network formation, and organoid culture. Storage conditions and preparation requirements are provided where applicable. Abbreviations: DMEM = Dulbecco's modified Eagle medium; EDTA = ethylenediaminetetraacetic acid; FBS = fetal bovine serum; FGF-2 = fibroblast growth factor 2; hiPSC = human induced pluripotent stem cell; NEAA = non-essential amino acids; PGM1 = Pluripotency Growth Master 1; VEGF-A = vascular endothelial growth factor A. Please click here to download this Table.
Table 3: Preparation of blocking buffer for whole-mount immunofluorescence staining of vascular organoids. Composition and storage conditions of the blocking and permeabilization buffer used for whole-mount immunofluorescence staining. Abbreviations: BSA = bovine serum albumin; FBS = fetal bovine serum; PBS = phosphate-buffered saline. Please click here to download this Table.
Table 4: Primer sequences used for quantitative real-time PCR analysis. Forward and reverse primer sequences were used to assess the expression of the vascular lineage markers CD31, CDH5, and PDGFR-β; the pluripotency markers OCT4, SOX2, and NANOG; and the housekeeping gene GAPDH. Primer sequences are presented in the 5′→3′ orientation. Abbreviations: qPCR = quantitative real-time PCR. Please click here to download this Table.
Supplementary Table 1: Working concentrations and preparation conditions for key reagents used in vascular organoid generation and characterization. Working concentrations, dilutions, and preparation or storage conditions for Y-27632, CHIR99021, BMP-4, VEGF-A, forskolin, FGF-2, PVA, primary and secondary antibody diluents, Hoechst working solution, PBST wash solution, and 4% PFA fixative. These reagents are used during hiPSC recovery and aggregation, mesoderm and vascular lineage induction, vascular network formation, whole-mount immunofluorescence staining, and organoid fixation. Abbreviations: BMP-4 = bone morphogenetic protein 4; FGF-2 = fibroblast growth factor 2; PFA = paraformaldehyde; PVA = polyvinyl alcohol; PBST = phosphate-buffered saline containing Tween 20; VEGF-A = va Please click here to download this Table.
Discussion
The optimized protocol described herein introduces several key improvements to the vascular organoid differentiation system originally established by Wimmer et al.18, with the aim of enhancing the homogeneity, reproducibility, and structural integrity of vascular organoid generation. Compared with the original protocol, the optimized method provides significant improvements in the following aspects. First, optimizing aggregate formation conditions substantially improves the homogeneity of embryoid bodies. The original protocol employed natural aggregation in low-attachment 6-well plates to generate hiPSC aggregates, seeding 2 × 10⁵ cells per well for the NC8 line or 5 × 10⁵ cells per well for the H9 line and relying on gravity to drive cell aggregation. This approach relies heavily on empirical control of seeding density and incubation time, leading to batch-to-batch variability in aggregate size. In the optimized protocol, while retaining low-attachment 6-well plates for aggregation, three modifications were introduced to improve aggregate uniformity: (1) seeding 5 × 10⁵ cells per well to provide sufficient cell numbers for stable aggregation; (2) adding 0.25% polyvinyl alcohol (PVA) to reduce nonspecific cell–substrate adhesion and promote homotypic cell–cell aggregation; and (3) incubating the plates on an orbital shaker at 37 °C to facilitate uniform cell distribution and synchronous aggregation through continuous gentle agitation. These modifications were associated with the production of aggregates with a more regular spherical morphology and smoother borders, providing more homogeneous starting material for subsequent mesoderm induction and vascular differentiation (Figure 2A,B).
If aggregates are excessively small or fragile or fail to develop smooth borders, first verify cell viability before seeding, as poor cell health is a common cause of inefficient aggregation. For hiPSC lines with poor aggregation capacity, increase the seeding density to 1 × 10⁶ cells per well or extend the incubation period from 1 day to 2–3 days. Conversely, excessively large aggregates generally result from the fusion of multiple aggregates. Increase the frequency of gentle pipetting during the incubation period to minimize aggregate fusion. Maintaining a uniform aggregate size at this initial stage is critical because size heterogeneity is directly associated with variability in vascular differentiation efficiency.
Second, optimization of the medium exchange strategy better maintains the culture environment during vascular differentiation. During the vascular network formation stage, the protocol retains one-third of the conditioned medium at each medium change and replaces the remaining two-thirds with fresh N2B27 complete differentiation medium containing the same supplements. In contrast, the original protocol employed complete medium replacement. Because VEGF-A and FGF-2 are unstable under culture conditions at 37 °C, complete medium replacement may cause substantial fluctuations in growth factor concentrations, potentially compromising sustained endothelial cell proliferation and vascular sprouting. Retaining a portion of the conditioned medium preserves cell-secreted pro-angiogenic factors and extracellular components while minimizing abrupt changes in the culture environment. This strategy was associated with more robust vascular network formation and greater pericyte coverage (Figure 2D,E).
If the gel matrix becomes unstable or collapses following medium addition, first confirm that the medium has been thoroughly prewarmed to 37 °C, as cold medium may cause gel contraction. In addition, verify collagen polymerization by confirming that the pH of the collagen I solution is approximately 7.4 and that the collagen I and basement membrane matrix batches form stable gels. If the matrix remains fragile or fails to solidify, use a new batch of basement membrane matrix or collagen I and incubate the gel for the full 2 h at 37 °C before adding medium. Extend the polymerization period to up to 3 h if necessary.
Third, simplification of vascular organoid isolation and maturation improves throughput and consistency. In the original protocol, vascular networks grown in 12-well plates until Day 10 were transferred individually to 6-well low-attachment plates for 1 day of culture (Day 11), then transferred to 96-well ultra-low-attachment plates for continued culture until Day 15. These two plate-transfer steps increase operational complexity and the risk of organoid loss. The optimized protocol introduces three important simplifications: (1) transferring isolated organoids directly to 96-well ultra-low-attachment plates, with one organoid per well, thereby eliminating the intermediate 6-well culture step and reducing handling and mechanical damage; (2) culturing one organoid per well to prevent fusion during suspension culture and maintain the independence of each organoid; and (3) performing daily medium changes for 5 days to provide a sustained supply of nutrients and growth factors, allowing the organoids to mature into rounded, fully encapsulated structures. These modifications simplify organoid culture, improve throughput, and facilitate subsequent high-throughput drug-screening applications.
To minimize organoid loss during isolation, ensure that the collagen I–basement membrane matrix is completely detached from the bottom of the well before cutting. Gently move a sterile spatula along the bottom of the well from the edge toward the center until the entire gel floats freely. When transferring isolated organoids, use a sterile disposable pipette rather than a P1000 pipette tip to reduce mechanical stress and minimize organoid shearing. If organoids fragment during handling, reassess differentiation quality, including starting cell viability and the activity of key growth factors such as VEGF-A and FGF-2. If organoids fuse during suspension culture, gently separate them using two P200 pipette tips. However, culturing individual organoids, one per well, from the beginning of the maturation stage is the most effective approach to preventing fusion.
Fourth, unification of the culture medium system simplifies the protocol and reduces batch-to-batch variation. The original protocol used N2B27 medium during mesoderm induction with CHIR99021 and BMP-4 and during vascular lineage induction with VEGF-A and forskolin, but switched to serum-free hematopoietic cell culture medium containing FBS, VEGF-A, and FGF-2 during vascular network formation. In contrast, the optimized protocol uses N2B27 complete differentiation medium supplemented with 15% FBS, VEGF-A, and FGF-2 throughout vascular network formation and subsequent organoid maturation, thereby maintaining the same N2B27 basal formulation. This unified strategy reduces additional variables associated with switching culture media and simplifies reagent preparation. The use of the defined B27 and N2 supplements in N2B27 medium may also contribute to improved batch-to-batch consistency, although the relative contribution of this modification, in isolation from the other protocol changes, has not been experimentally separated in the current study. The effectiveness of the optimized protocol was supported by the upregulation of vascular lineage markers and downregulation of pluripotency markers in Day 15 organoids (Figure 1D). In addition, whole-mount immunofluorescence staining revealed extensive CD31+ endothelial networks and closely associated PDGFR-β+ pericytes, confirming the formation of vascular structures with mural cell coverage (Figure 1C,E). PDGFR-β is a well-established marker of pericytes in human vascular organoids, as demonstrated in previous studies21.
If vascular sprouting is poor or large, undifferentiated aggregates form without endothelial networks, and insufficient mesoderm induction may be the underlying cause. Confirm that CHIR99021 and BMP-4 are active and used at the correct concentrations. Poor pericyte recruitment, indicated by sparse PDGFR-β+ cells surrounding CD31+ endothelial tubes, may reflect suboptimal activity of VEGF-A or FGF-2. Testing different growth factor batches and functionally validating FBS batches for their ability to support vascular organoid formation may improve mural cell coverage. To systematically validate the effectiveness of the four methodological improvements described above, quantitative morphometric analyses were performed comparing the optimized protocol with the original Wimmer protocol (Figure 2; Table 1). Bright-field microscopy revealed marked morphological differences between the two protocols throughout differentiation. Whereas the original protocol yielded aggregates and organoids of heterogeneous sizes and irregular shapes at all stages, the optimized protocol consistently produced uniform aggregates with smooth borders from Day 0 onward. These aggregates subsequently developed into more rounded and uniformly sized mature vascular organoids by Day 15 (Figure 2A).
Quantitative analysis confirmed that the optimized protocol generated substantially more uniform aggregates on Day 0 (120.3 ± 5.4 µm, CV = 4.47%, n = 3 independent batches) than the original protocol (112.2 ± 34.7 µm, CV = 30.93%, n = 3 independent batches; Figure 2B). This improvement in uniformity was maintained through the differentiation endpoint, as Day 15 organoids generated using the optimized protocol also exhibited substantially reduced size variability (Figure 2C). These findings suggest that combining PVA-assisted aggregation with orbital shaking reduces aggregate size heterogeneity compared with the original protocol, yielding a more homogeneous starting material for subsequent mesoderm induction and vascular differentiation. However, because the optimized protocol incorporates multiple simultaneous modifications, the specific contribution of each individual change to the observed improvements has not been experimentally separated in the current study.
The optimized protocol also significantly enhanced vascular network formation, increasing CD31+ endothelial coverage (40.1 ± 2.9% vs. 28.0 ± 7.0%; t = 2.856, df = 4, p = 0.05; Figure 2D) and PDGFR-β+ pericyte coverage (36.2 ± 2.5% vs. 17.5 ± 5.2%; t = 6.636, df = 4, p = 0.003; Figure 2E). Branching index analysis using AngioTool further demonstrated that the optimized protocol generated more complex vascular networks (50.2 ± 3.8 vs. 24.1 ± 6.9 points/mm2; t = 6.163, df = 4, p = 0.004; Figure 2F). These improvements may result from two complementary factors. First, homogeneous aggregates provide more consistent starting conditions for vascular sprouting. Second, retaining one-third of the conditioned medium may help maintain supplemented pro-angiogenic factors while preserving cell-secreted factors that could support pericyte migration and association with endothelial tubes.
Ultimately, the optimized protocol yielded an approximately 1.6-fold higher organoid formation efficiency (64.3 ± 3.8% vs. 41.3 ± 10.8%; t = 3.433, df = 4, p = 0.03), corresponding to 60–67 mature organoids per 1 × 10⁶ starting cells compared with 29–50 organoids obtained using the original protocol (Figure 2G). Notably, the optimized protocol substantially reduced batch-to-batch variability, with batch means ranging from 60.0% to 67.0% (SD = 3.8%), whereas the original protocol exhibited markedly greater batch-to-batch variation, with batch means ranging from 29.0% to 50.0% (SD = 10.8%).
Collectively, the quantitative data presented in Figure 2 and Table 1 support the systematic improvements achieved with the optimized protocol in aggregate homogeneity, vascular network formation, pericyte recruitment, vascular complexity, and organoid yield. These improvements directly address major limitations of the original protocol related to reproducibility and scalability.
In summary, the present optimized protocol addresses key limitations of the original method through four principal improvements: optimization of aggregate formation, modification of the medium-exchange strategy, simplification of the organoid isolation and maturation workflow, and unification of the culture-medium system. Together, these modifications make vascular organoid generation more efficient, reproducible, and scalable, providing a more reliable in vitro platform for studies of vascular development, disease modeling, and drug screening. Nevertheless, as in the original method, the current protocol continues to rely on animal-derived components, including basement membrane matrix and FBS. Future efforts may therefore focus on developing chemically defined synthetic matrices and serum-free culture systems to further enhance the translational potential of this platform.
It is important to note that the optimized protocol introduced multiple simultaneous modifications—PVA supplementation, orbital shaking, conditioned-medium retention, a streamlined maturation workflow, and a unified culture medium system—and the current data do not establish which individual modification is responsible for the observed improvements in aggregate homogeneity, endothelial coverage, pericyte coverage, or organoid yield. The present study was designed to evaluate the cumulative effect of these optimizations as a complete protocol, rather than dissecting the contribution of each individual component. Future factorial or ablation experiments will be required to determine the specific role of each modification and further refine the protocol.
Despite these limitations, the current protocol represents a practical and reproducible foundation for vascular organoid generation. Several emerging directions in the vascular organoid field offer opportunities for further protocol refinement and expanded application. Recent advances in synthetic and animal-free hydrogels have provided promising alternatives to basement membrane matrix and collagen I, with dynamic hydrogels shown to enhance angiogenesis and direct the differentiation of vascular organoids into arterioles22. A robust animal-origin-free method based on single-layer “sitting drop” cultures has also been developed to maintain cellular integrity while improving reproducibility and compatibility with automation23. Single-cell multi-omics studies have provided unprecedented resolution of cellular heterogeneity during human blood vessel organoid development, revealing key cell-fate and state transitions that may guide targeted optimization of differentiation protocols24. The integration of microfluidic platforms has enabled the development of functional vascularized organoids-on-chip with perfusable capillary networks, enhancing organoid growth, maturation, and function through intravascular perfusion25. Furthermore, specialized vascular organoid-on-chip systems are emerging as promising platforms for drug screening and disease modeling, with potential applications in regenerative medicine and reconstructive surgery26. Together with the optimized differentiation protocol presented here, these complementary approaches may accelerate the translational application of vascular organoids in disease modeling and therapeutic screening.
Although the current protocol was validated using a single iPSC line, the robustness of the differentiation approach is supported by consistent results across multiple independent batches. Nevertheless, evaluation across additional iPSC and ESC lines will be necessary to further establish its generalizability. The optimized conditions, particularly PVA supplementation, orbital shaking, and conditioned-medium retention, are designed to address fundamental aspects of organoid culture, including aggregation uniformity, mass transfer, and paracrine support, and may therefore provide similar benefits across different cell-line backgrounds.
Disclosures
The authors declare no competing financial interests.
Acknowledgements
This work was supported by the National Natural Science Foundation of China (NSFC) through the Young Scientists Fund (C) (No. 32200655) and the General Program (No. 32270847). The authors also thank the Anhui University Public Service Platform for its support.
Materials
| Name | Company | Catalog Number | Comments |
|---|---|---|---|
| 0.22 μm Bottle-Top Filter | Nalgene | FPE204030 | For sterile filtration of media and buffers |
| 15 mL Conical Tube | SparkJade | GD0001 | Sterile |
| 2 mL Microcentrifuge Tube | Eppendorf | 22363204 | Sterile |
| 2-Mercaptoethanol (1000×) | Gibco | 21985023 | Use in fume hood |
| Alexa Fluor 488 AffiniPure F2 Fragment Donkey Anti-Rabbit IgG (H+L) | Lablead | Y1104 | Secondary antibody; dilute 1:300 |
| Alexa Fluor 594 AffiniPure F(ab′)2 Fragment Donkey Anti-Goat IgG (H+L) | Lablead | Y1007 | Secondary antibody; dilute 1:300 |
| Anti-CD31 antibody | Cell Signaling | 3528s | Primary antibody; dilute 1:100 in blocking buffer |
| Anti PDGFR β antibody | Zenbio | 347269 | Primary antibody; dilute 1:100 in blocking buffer |
| Automated Cell Counter | Life Technologies | Countess™ II | Includes counting chamber slides |
| B27 Supplement (50×) | Gibco | 17504044 | For N2B27 medium; thaw at 4ºC, aliquot and store at −20ºC, avoid freeze-thaw |
| Benchtop Centrifuge | Zonkia | SC-3610 | With swinging-bucket rotor |
| Biological Safety Cabinet (Class II) | Thermo Fisher | NA | NA |
| BMP4 | Proteintech | HZ-1045 | Reconstitute in sterile ddH2O to 100 ng/μL, aliquot and store at −20 °C |
| Bovine Serum Albumin (BSA) | Biosharp | 9048-46-8 | For blocking buffer |
| CHIR99021 | MCE | HY-10182 | Prepare 10 mM stock in DMSO, store at −20ºC for up to 1 year |
| CO2 Incubator | Fisher Scientific | LS-CO150 | 37 ºC, 5% CO2, humidified |
| Confocal Imaging Dish | Biosharp | BS-20-GJM | For imaging after staining |
| Confocal Microscope | LEICA | NA | Equipped with 10×, 20×, 63× objectives and ZEN software |
| DMEM | Vivacell | C3113-0500 | For Matrigel dilution and collagen I solution |
| DMEM/F-12, GlutaMAX Supplement | Gibco | 10565018 | For Matrigel dilution and N2B27 medium |
| EDTA (0.5 M, pH 8.0) | Invitrogen | AM9260G | Dilute with PBS to 0.02% for passaging |
| Fetal Bovine Serum (FBS) | Gibco | 10270-106 | For N2B27 complete differentiation medium (15% final) |
| FGF-2 | Novoprotein | C046 | Prepare 1 mg/mL stock in sterile PBS, aliquot and store at −20ºC |
| Forskolin | R&D Systems | 1099 | Prepare 10 mM stock in DMSO, store at −20ºC |
| HEPES (1M) | Gibco | 15630080 | For collagen I solution |
| Hoechst | Beyotime | C1071S-4 | Prepare 1 mg/mL stock in deionized water, aliquot and store at −20ºC |
| Inverted Microscope | LEICA | DMIL LED | Routine cell observation |
| Matrigel (growth factor-reduced) | STEEMA | BM05 | Store at −20ºC after aliquoting, avoid freeze-thaw; handle on ice |
| MEM Non-Essential Amino Acids Solution (NEAA, 100×) | Gibco | 11140035 | For N2B27 medium |
| N2 Supplement (100×) | Gibco | 17502048 | For N2B27 medium; store at −20ºC protected from light |
| Neurobasal Medium | Gibco | 21103049 | For N2B27 medium |
| Nuclease Free Water (DNase/Rnase Free) | Lablead | Doo55WJ | For RNA/cDNA preparation and qPCR |
| Orbital Shaker | Joan Lab | NA | For washing steps |
| Paraformaldehyde (4% solution) | Servicebio | G1101 | Dilute with PBS to 4% for fixation; use in fume hood |
| Penicillin-Streptomycin (100×) | Gibco | 15140122 | For N2B27 medium |
| PGM1 Medium | Cellapy | A1517001 | hiPSC expansion medium; store at 4ºC protected from light, stable for 2 weeks |
| PGM1 Supplement (25×) | Cellapy | A1517101 | For use with PGM1 Basal Medium |
| Polyvinyl Alcohol (PVA) | Sigma-Aldrich | P8136 | Dissolve in PGM1 at 0.25% (w/v) to promote aggregation |
| PureCol (Bovine Type I Collagen, 3 mg/mL) | Advanced BioMatrix | 5005 | For collagen I-Matrigel mixture; test batch for polymerization capacity |
| qPCR Thermal Cycler | Thermo Fisher | StepOnePlus™ | With melt curve capability; for real-time PCR detection |
| Reverse Transcription Kit | Accurate Biology | AG11706 | For cDNA synthesis from total RNA; contains RT master mix with reverse transcriptase, buffer, dNTPs, and random primers |
| RNA Extraction Kit | Yeasen | 19221ES50 | For total RNA isolation from vascular organoids; includes gDNA elimination columns and RNase-free DNase I |
| Sodium Bicarbonate (7.5%) | Gibco | 25080094 | For collagen I solution |
| Sodium Deoxycholate | Sigma-Aldrich | D6750 | Prepare 1% (w/v) solution in deionized water for blocking buffer |
| Sodium Hydroxide (1.0 N) | Sigma-Aldrich | S2770 | For pH adjustment of collagen I solution |
| Sterile Disposable Pipettes (10 mL) | Bkmamlab | 110205007 | Individually wrapped, sterile |
| Sterile Filter Pipette Tips (1000, 200, 20 μL) | Biozym | VT0270/VT0250/VT0220 | Sterile, with filter |
| Sterile Needle (30 G) | NA | NA | For dissecting vascular networks |
| Sterile Spatula (Round End) | Fisher Scientific | 21-401-5 | Stainless steel |
| SYBR Green Master Mix | Accurate Biology | AG11733 | 2× concentration for qPCR; contains hot-start DNA polymerase, buffer, dNTPs, and SYBR Green dye |
| Tissue Culture-Treated 12-Well Plate | BD Falcon | 353043 | For gel embedding and vascular network culture |
| Tissue Culture-Treated 6-Well Plate | Eppendorf | 30720113 | Standard TC-treated |
| Triton X-100 | Sigma-Aldrich | T9084 | For blocking buffer |
| Trypan Blue (0.4%) | Thermo Fisher | 15250061 | For cell counting |
| Tween 20 | Sigma-Aldrich | P7949 | For 0.05% PBS-T wash solution |
| Ultra-Low Attachment 6-Well Plate | Corning | 3471 | For aggregate formation and differentiation |
| Ultra-Low Attachment Round-Bottom 96-Well Plate | Beyotime | FULA962-6pcs | For suspension culture of vascular organoids |
| VEGF-A | Proteintech | HZ-1038 | Prepare 1 mg/mL stock in sterile PBS, aliquot and store at −20ºC |
| Water Bath | Blue pard | HWS-24 | 37ºC |
| Y-27632 | MCE | HY-10071 | Prepare 10 mM stock in sterile PBS or DMSO, store at −20ºC; working concentrations: 5 μM (thawing), 50 μM (aggregate formation) |
References
- Lancaster MA, Knoblich JA. Organogenesis in a dish: modeling development and disease using organoid technologies. Science. 2014;345:1247125.
- Clevers H. Modeling development and disease with organoids. Cell. 2016;165:1586-1597.
- Spence JR, et al. Directed differentiation of human pluripotent stem cells into intestinal tissue in vitro. Nature. 2011;470:105-109.
- Lancaster MA, et al. Cerebral organoids model human brain development and microcephaly. Nature. 2013;501:373-379.
- Quadrato G, et al. Cell diversity and network dynamics in photosensitive human brain organoids. Nature. 2017;545:48-53.
- Takasato M, et al. Kidney organoids from human iPS cells contain multiple lineages and model human nephrogenesis. Nature. 2015;526:564-568.
- Takebe T, et al. Vascularized and functional human liver from an iPSC-derived organ bud transplant. Nature. 2013;499:481-484.
- Huch M, et al. Long-term culture of genome-stable bipotent stem cells from adult human liver. Cell. 2015;160:299-312.
- Nakano T, et al. Self-formation of optic cups and storable stratified neural retina from human ESCs. Cell Stem Cell. 2012;10:771-785.
- Mansour AA, et al. An in vivo model of functional and vascularized human brain organoids. Nat Biotechnol. 2018;36:432-441.
- Ham O, et al. Blood vessel formation in cerebral organoids formed from human embryonic stem cells. Biochem Biophys Res Commun. 2020;521:84-90.
- Sun XY, et al. Generation of vascularized brain organoids to study neurovascular interactions. eLife. 2022;11:e76707.
- Grebenyuk S, Ranga A. Engineering organoid vascularization. Front Bioeng Biotechnol. 2019;7:39.
- Parikh M, Pierce GN. Considerations for choosing an optimal animal model of cardiovascular disease. Can J Physiol Pharmacol. 2024;102:75-85.
- Krug A, et al. Three-dimensional spheroid models for cardiovascular biology and pathology. Mechanobiol Med. 2025;3:100144.
- Carmeliet P. Angiogenesis in health and disease. Nat Med. 2003;9:653-660.
- Wimmer RA, et al. Human blood vessel organoids as a model of diabetic vasculopathy. Nature. 2019;565:505-510.
- Wimmer RA, et al. Generation of blood vessel organoids from human pluripotent stem cells. Nat Protoc. 2019;14:3082-3100.
- Naderi-Meshkin H, et al. Vascular organoids: unveiling advantages, applications, challenges, and disease modelling strategies. Stem Cell Res Ther. 2023;14:292.
- Xu C, et al. Vascular organoid generation from human-induced pluripotent stem cells. J Vis Exp. 2024;214:e67125.
- Frenz-Wiessner S, et al. Generation of complex bone marrow organoids from human induced pluripotent stem cells. Nat Methods. 2024;21:868-881.
- Sun D, et al. Matrix viscoelasticity controls differentiation of human blood vessel organoids into arterioles and promotes neovascularization in myocardial infarction. Adv Mater. 2025;37:e2410802.
- Hoffmann A, et al. Animal-origin-free method for generating blood vessel organoids. Sci Rep. 2026;16:12096.
- Nikolova MT, et al. Fate and state transitions during human blood vessel organoid development. Cell. 2025;188:3329-3348.e31.
- Quintard C, et al. A microfluidic platform integrating functional vascularized organoids-on-chip. Nat Commun. 2024;15:1452.
- Sun L, Wang P, Lin X, Qiu Y. Microfluidic vascular organoids-on-chips: a promising platform for advancing plastic and reconstructive surgery. Chinese Journal of Plastic and Reconstructive Surgery. 2025.