A phantom-head model was used to quantify post-treatment residual dye coverage after erythritol air-flowing, sodium bicarbonate air-polishing, or nickel-titanium brush instrumentation in two peri-implant defect configurations. All protocols left residual dye. Erythritol left greater implant-level residual coverage than the other two protocols in both Class 1A and Class 1B defects.
Research Article
Mechanical Debridement of Dental Implant Surfaces: Residual Dye Coverage and Qualitative Surface Morphology in a Phantom-Head In Vitro Model
In This Article
Summary
Abstract
Mechanical debridement of implant surfaces is limited by implant geometry and defect-related access restrictions. This study evaluated post-treatment residual dye coverage after three mechanical debridement protocols in a standardized phantom-head model, testing the null hypothesis that coverage would not differ among protocols within each defect configuration. Sixty titanium implants were coated with permanent dye and subjected to erythritol air-flowing, sodium bicarbonate air-polishing, or nickel-titanium (Ni-Ti) brush instrumentation in simulated Class 1A and Class 1B peri-implant defects (n = 10 per group). Residual dye coverage was quantified from three photographic projections per surface using ImageJ and expressed as the percentage of evaluable projected implant area covered by residual dye, with the implant as the experimental unit. Pre-treatment coverage was standardized procedurally but not measured quantitatively; outcomes therefore represent post-treatment residual coverage rather than contamination removed. Scanning electron microscopy (SEM) and energy-dispersive X-ray spectroscopy (EDS) were used for descriptive surface characterization. Residual dye remained on all implants. Within Class 1A defects, implant-level coverage differed among protocols (p < 0.001), erythritol showing greater coverage than sodium bicarbonate (adjusted p < 0.001) and Ni-Ti (adjusted p = 0.014). Coverage also differed within Class 1B defects (p < 0.001), erythritol again exceeding sodium bicarbonate (adjusted p = 0.018) and Ni-Ti (adjusted p < 0.001). Sodium bicarbonate and Ni-Ti did not differ in either configuration (adjusted p = 0.143 and 0.383). On the distal surface of Class 1B defects, Ni-Ti showed lower coverage than both (adjusted p = 0.003 and 0.005). Surface-site distribution also differed within each protocol in Class 1B defects (p ≤ 0.006). Exploratory SEM-EDS observations of individual specimens showed differences in surface appearance. Within the limitations of this in vitro model, residual dye coverage differed by protocol, and no protocol resulted in a dye-free surface.
Introduction
Peri-implant diseases are highly prevalent conditions associated with significant morbidity, representing a major clinical challenge in contemporary implant dentistry1. According to the 2017 World Workshop on the Classification of Periodontal and Peri-Implant Diseases and Conditions, peri-implantitis is defined as a plaque-associated pathological condition affecting tissues around dental implants, characterized by inflammation of the peri-implant mucosa and progressive loss of supporting bone2,3. Epidemiological evidence indicates that nearly one in five patients (19%–22%) may develop peri-implantitis4,5.
Given that bacterial accumulation is the primary etiological factor, effective management of peri-implantitis depends on thorough removal of dysbiotic biofilm from the implant surface to arrest the inflammatory process6. However, this remains challenging due to the complex macro- and micro-topography of implant surfaces. Consequently, surgical approaches that provide direct access to the implant surface are considered the most predictable strategy for achieving effective mechanical decontamination in advanced peri-implant bone defects7,8. Treatment outcomes are further influenced by defect morphology and the ability of decontamination methods to adequately access the affected implant surface9,10.
A wide range of mechanical decontamination strategies have been proposed, including curettes, ultrasonic instruments, air-abrasive systems, and rotary titanium brushes11,12. Despite extensive research, no consensus has been reached regarding the most effective modality for peri-implantitis treatment13. An ideal mechanical decontamination method should not only effectively remove biofilm and deposits but also avoid significant deleterious alterations to the implant surface14,15. Conventional mechanical approaches, such as curettes and ultrasonic devices, may induce surface damage16 and often fail to restore the surface properties of rough implant surfaces17.
Air-abrasive systems are used for biofilm removal from tooth and implant surfaces. Although the term air-polishing has traditionally been applied to biofilm removal using powders including erythritol, glycine, sodium bicarbonate, and calcium carbonate, a recent expert consensus proposed air-flowing as a more appropriate terminology when a specific device is used with a specially developed 14-µm erythritol powder18. Accordingly, the erythritol-based intervention in the present study is referred to as erythritol air-flowing, whereas the sodium bicarbonate-based intervention is referred to as sodium bicarbonate air-polishing.
Among emerging mechanical approaches, air-abrasive systems and rotary brushes have gained increasing attention. Systematic reviews of in vitro studies indicate that air-abrasive systems can achieve substantial implant surface decontamination, although residual contamination varies according to powder characteristics, implant surface properties, device parameters, and surface accessibility19,20. In surgical simulation models, air-abrasive systems and rotating titanium brushes have demonstrated favorable cleaning performance compared with conventional methods such as curettes and ultrasonic devices21,22,23,24,25,26. Several of these studies evaluated rotating titanium brushes rather than nickel-titanium (Ni-Ti) brushes; therefore, their findings should not be interpreted as direct evidence for Ni-Ti brush instrumentation. Evidence specifically evaluating Ni-Ti brushes remains limited and is currently restricted to in vitro studies assessing biofilm removal efficacy and alterations in titanium surface characteristics27,28.
Despite these advancements, direct comparisons of erythritol air-flowing, sodium bicarbonate air-polishing, and Ni–Ti brush instrumentation within a single standardized experimental model remain limited, particularly under conditions incorporating restricted surgical access and different peri-implant defect configurations. Importantly, much of the available evidence is derived from simplified laboratory models that do not adequately reproduce clinical access limitations or defect morphology29. There is therefore a need for experimental models that incorporate these clinical challenges into the study design. To address this gap, the present study employed three-dimensional (3D) printed peri-implantitis models representing two distinct defect configurations, integrated into a dental phantom head to reproduce predefined access constraints. The study aimed to compare post-treatment residual dye coverage following sodium bicarbonate air-polishing, erythritol air-flowing, and Ni-Ti brush instrumentation within each defect configuration. Implant surface morphology and sampled elemental composition were additionally characterized qualitatively using scanning electron microscopy and energy-dispersive X-ray spectroscopy as exploratory outcomes. The null hypothesis was that implant-level residual dye coverage would not differ among the three debridement protocols, tested separately within each defect configuration.
Protocol
The reporting of this phantom-head in vitro study was reviewed and structured with reference to the Checklist for Reporting In Vitro Studies (CRIS) for experimental dental research30. Ethical approval was obtained from the Akdeniz University Faculty of Medicine Clinical Research Ethics Committee (06.03.2025; Decision No: TBAEK-282). The experimental protocol was adapted from previously established methodologies26 and further refined based on subsequent literature29,31, with modifications introduced to reproduce standardized access constraints. Each of the three mechanical decontamination methods (erythritol air-flowing, sodium bicarbonate air-polishing, and Ni-Ti brush) was evaluated separately in both peri-implantitis defect configurations (Class 1A and Class 1B), resulting in a total of six experimental groups. The overall workflow and experimental group structure are presented in Figure 1 and Figure 2, respectively. Commercial names, manufacturers, and catalog numbers for all materials and instruments are provided in the Table of Materials.
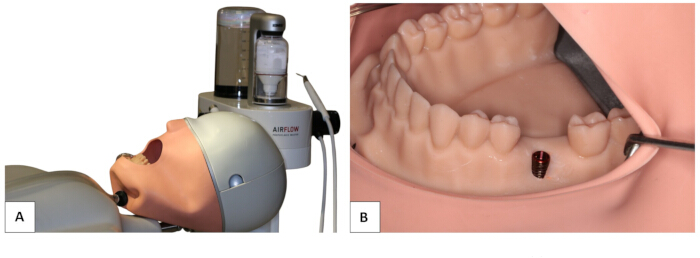
Figure 1: Experimental setup. (A) Integration of the 3D-printed resin model into the phantom head and (B) establishment of a standardized experimental setup simulating clinical conditions. Please click here to view a larger version of this figure.
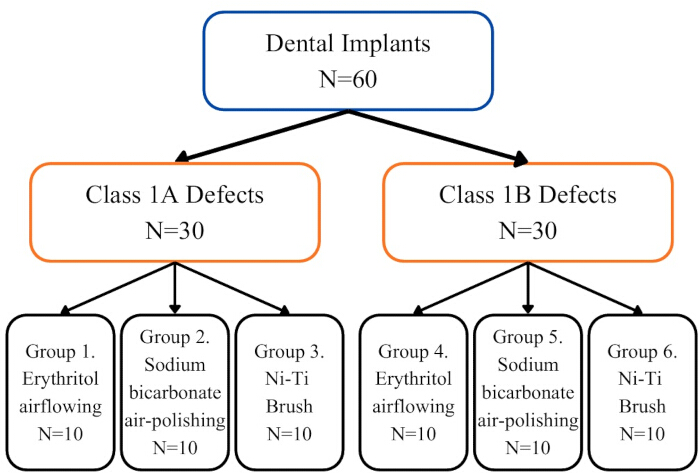
Figure 2: Schematic flowchart illustrating the study design and experimental group allocation. SB, sodium bicarbonate. Please click here to view a larger version of this figure.
An a priori sample-size calculation was performed using G*Power 3.1 (ANOVA: fixed effects, omnibus, one-way). Based on data from a comparable in vitro study31, an effect size of f = 0.50 was assumed. With α = 0.05, 80% power, and six experimental groups, the calculated minimum total sample size was 58 implants. To allow equal allocation across the six groups, the sample size was increased to 60 implants, resulting in 10 implants per group and an estimated power of approximately 0.83 under the prespecified model. For the primary analyses, the three debridement protocols were compared separately within each defect configuration, with 10 implants per protocol. A sensitivity analysis based on the corresponding three-group fixed-effects omnibus model indicated that a total sample size of 30 implants provides 80% power to detect an effect size of approximately f = 0.60 or greater at α = 0.05. The exploratory protocol-by-defect configuration interaction analysis was not used for the original sample-size determination.
In vitro 3D peri-implant defect model preparation
A mandibular educational phantom model was modified by removing the mandibular first molar and replacing the site with soft silicone material to create a flat alveolar ridge. The model was digitized using a laboratory scanner, and the resulting STL data were imported into dental computer-aided design (CAD) software for virtual defect design. Peri-implant defect configurations were digitally designed to simulate the two defect types most frequently observed at the implant level, Class 1A and Class 1B, based on the data reported by Monje et al.32. Class 1A represented a buccal dehiscence defect, whereas Class 1B represented a combined two- to three-wall intrabony defect. For Class 1A defects, the buccal defect extended 5 mm and measured 4.2 mm in width, corresponding to the diameter of the implant used in the study. Class 1B defects additionally included mesial and distal components, each extending 5 mm in depth. The finalized STL files were fabricated using a three-dimensional (3D) printing system and model resin. Following printing, the models were rinsed in 96% ethanol for 5–10 min and post-cured for 5 min according to the recommended processing protocol. For stabilization, each model was mounted onto phantom head units using a custom fixation system. A metal nut compatible with the phantom system was positioned centrally at the base of each model. The bonding surface was slightly roughened to improve mechanical retention, after which the metal component was secured with a universal adhesive and additionally reinforced with flowable composite resin to minimize micromovement during instrumentation.
Implant specimens and simulated contamination
A total of 62 bone-level grade 4 titanium dental implants (PrimeTaper EV) with a diameter of 4.2 mm and a length of 11 mm were used. The implants had a macrothread pitch of 0.75 mm and a microthread pitch of 0.25 mm. They were screw-shaped implants with a defined surface produced by grit blasting, followed by treatment in a diluted hydrofluoric acid solution. All 62 implants were sterile, industrially manufactured units of identical specifications originating from a single production lot (lot no. 527590). Two implants served as control specimens: one positive control, which underwent the same simulated contamination procedure as the experimental specimens but received no debridement, and one sterile reference control, which was neither contaminated nor instrumented. The remaining 60 implants were distributed among the six experimental groups (n = 10 per group) in a fixed sequence rather than through a formally generated random allocation sequence, and allocation was not concealed.
The fixed allocation sequence was as follows: the first 10 implants were allocated to the Class 1A erythritol group, followed by 10 implants allocated to the Class 1B erythritol group, 10 to the Class 1A sodium bicarbonate group, 10 to the Class 1B sodium bicarbonate group, 10 to the Class 1A Ni-Ti brush group, and the final 10 to the Class 1B Ni-Ti brush group. The order of protocol processing was likewise predetermined rather than randomized, with erythritol performed first, followed by sodium bicarbonate and then Ni-Ti brush instrumentation.
Simulated contamination was performed sequentially in protocol-specific batches of 20 implants, comprising the Class 1A and Class 1B groups assigned to the same debridement protocol. One day before each debridement session, the corresponding batch of 20 implants was immersed in red permanent dye for 15 s, then air-dried inverted for 24 h at room temperature. After the 24-h drying period, the relevant debridement protocol was performed. This sequence was first completed for the erythritol groups, followed by the sodium bicarbonate groups and, finally, the Ni-Ti brush groups. Each protocol-specific batch, therefore, underwent the same sequence of dye immersion, 24-h drying, and subsequent debridement on consecutive treatment days. The positive control implant was contaminated separately after all debridement sessions had been completed, using the same 15 s dye-immersion and 24 h drying procedure. It received no debridement and served as a reference for the appearance of a fully contaminated, non-instrumented surface. Throughout specimen preparation, implants were handled exclusively using implant drivers or impression posts to minimize unintended surface contamination. A single operator (B.B.A.) placed all experimental implants into the 3D-printed models. Osteotomies were prepared using a surgical motor at 800 rpm and oriented parallel to the adjacent teeth. Each implant was positioned with 6 mm of the implant body embedded within the model and the coronal 5 mm exposed, thereby reproducing the predefined extent of simulated peri-implant bone loss. Because both the debridement protocol and defect configuration were evident during instrumentation, operator blinding was not feasible. The model represented an open-access instrumentation condition intended to approximate the access available after surgical exposure33. Soft tissues, bleeding, saliva, and the surgical wound environment were not reproduced, and no actual flap elevation was performed.
Mechanical debridement protocols
All debridement procedures were performed by the same investigator (B.B.A.) under standardized phantom-head conditions. Three mechanical debridement methods were evaluated: erythritol air-flowing (E), sodium bicarbonate air-polishing (SB), and nickel-titanium brush instrumentation (Ni-Ti). Each protocol was evaluated in both Class 1A and Class 1B defect configurations. Total instrumentation time was predefined as 2 min for Class 1A defects and 3 min for Class 1B defects, in accordance with the previously described experimental protocol31; the longer treatment duration for Class 1B defects accommodated the additional mesial and distal defect components. In Class 1A defects, the entire 2-min treatment period was devoted to the exposed buccal surface. In Class 1B defects, the 3-min treatment period was divided equally among the three exposed surfaces, with 60 s allocated to each of the buccal, mesial, and distal aspects, timed using a stopwatch. This time allocation was applied identically across all three debridement protocols. Because total treatment duration was predefined according to defect configuration rather than to equalize exposure across individual surfaces, surface-specific exposure differed between Class 1A and Class 1B defects. Accordingly, implant-level outcomes were not directly compared between the two defect configurations; protocol comparisons were performed separately within each configuration.
For the erythritol air-flowing protocol, 14-µm erythritol powder was delivered using a submucosal handpiece at a fixed operating pressure of 6 bar. In accordance with the manufacturer’s recommendations for submucosal application, the power setting was maintained within the recommended range of 5–10, and the water setting was set to the maximum level (10). The nozzle was moved continuously along the exposed implant surface using vertical movements and was not held stationary during instrumentation. A new submucosal tip was used for each implant (Figure 3A).
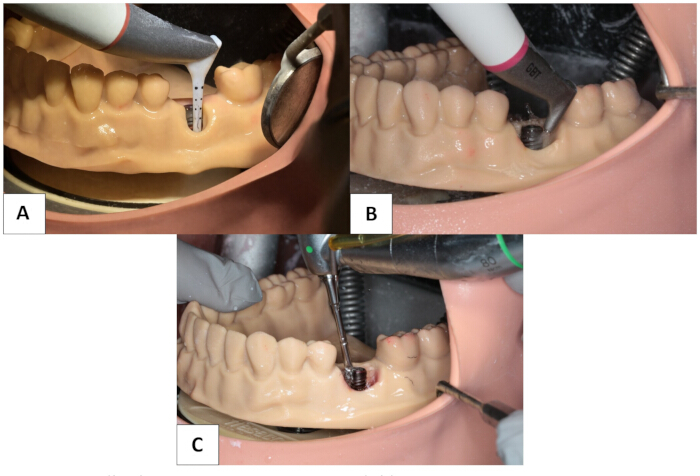
Figure 3: Application of the three mechanical debridement protocols. (A) erythritol air-flowing using a submucosal handpiece, illustrated in a Class 1A defect; (B) sodium bicarbonate air-polishing using a supramucosal handpiece, illustrated in a Class 1B defect; and (C) Ni–Ti brush instrumentation, illustrated in a Class 1B defect. Please click here to view a larger version of this figure.
For the sodium bicarbonate air-polishing protocol, approximately 40-µm sodium bicarbonate powder was delivered using a supramucosal handpiece at a fixed operating pressure of 4 bar. In accordance with the manufacturer's recommendations for use, the power setting was maintained within the range of 2–6, the water setting at the maximum level (10), and the working distance at 2–5 mm, with an angulation of 15°–80° relative to the implant surface. During application, the angulation was continuously adjusted within this range while semicircular sweeping movements were performed, and the handpiece was not held stationary (Figure 3B).
For the nickel-titanium brush protocol, a rotary nickel-titanium brush system was operated at 900 rpm using a surgical contra-angle handpiece, within the manufacturer-recommended operating range of 600–1,200 rpm. Continuous sterile saline irrigation was maintained throughout instrumentation in accordance with the manufacturer’s instructions. Instrumentation was performed using the manufacturer-recommended touch-and-back technique, consisting of gentle contact-withdrawal movements to maintain controlled brush contact with the implant surface. Brush selection was predefined before instrumentation based on the manufacturer- and product-described characteristics of each brush design and the access geometry of the respective defect surface, and the same predefined assignment was applied to all implants within each defect configuration, and no selection was made during instrumentation.
Pocket Short brushes, intended for posterior/molar access, were assigned to the buccal surface. Omega brushes, designed to facilitate access in deep and spatially restricted areas, were additionally assigned to the mesial and distal surfaces to improve instrumentation within the narrow proximal defect anatomy. Nano brushes, characterized by a narrow conical tip intended for targeted access, were used on all instrumented surfaces for the cervical microthreaded region and interthread recesses. In Class 1A defects, the Pocket Short and Nano brushes were each applied for 1 min, resulting in a standardized total instrumentation time of 2 min. In Class 1B defects, 1 min was allocated to each of the buccal, mesial, and distal surfaces. The buccal surface was instrumented for 30 s with the Pocket Short brush, followed by 30 s with the Nano brush. Each proximal surface was instrumented for 30 s with the Omega brush, followed by 30 s with the Nano brush, resulting in a standardized total instrumentation time of 3 min for Class 1B defects. Each brush set was replaced after every five implants (Figure 3C).
Photographic documentation and image analysis
Immediately after debridement, the implants were removed from the models, gently air-dried for 10 s, and positioned in standardized custom-made acrylic photographic holders22,25,26,34. Images were acquired using a digital camera equipped with a macro lens under fixed parameters: ISO 160, aperture f/16, shutter speed 1/250 s, and a camera-to-implant distance of 15 cm. Photographs were obtained from a frontal view (0°), perpendicular to the implant long axis, and from approximately 30° coronal and apical angulations, consistent with previous in vitro protocols23,24,26,31. For Class 1A defects, three standardized images per implant were captured at the predefined angulations (Figure 4). For Class 1B defects, nine images were obtained per implant, corresponding to three surfaces (buccal, mesial, and distal) at each of the three angulations (Figure 5). In total, 360 high-resolution images were included in the analysis.
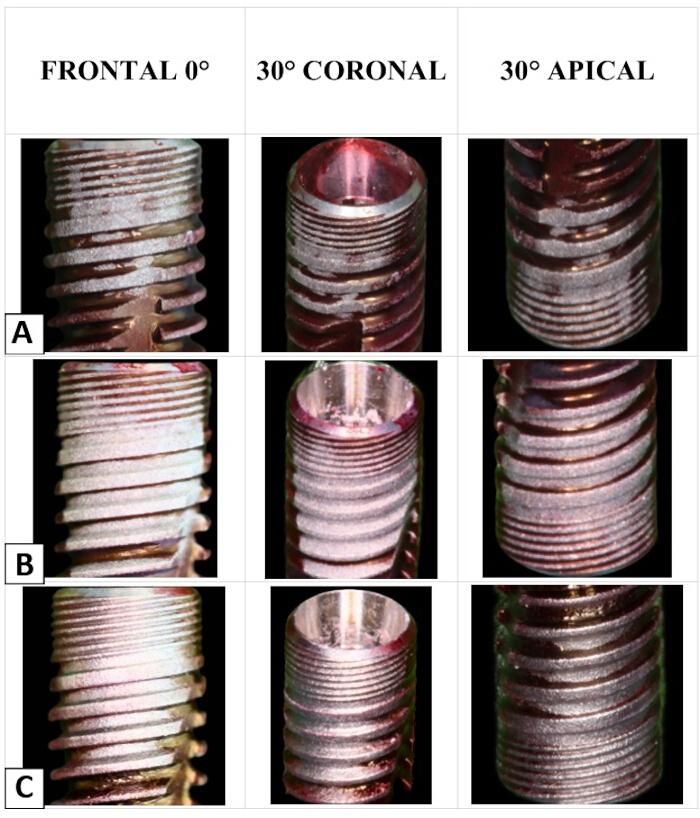
Figure 4: Representative macroscopic images of implant surfaces after debridement in the Class 1A defect group. (A) erythritol, (B) sodium bicarbonate, and (C) Ni–Ti. Please click here to view a larger version of this figure.
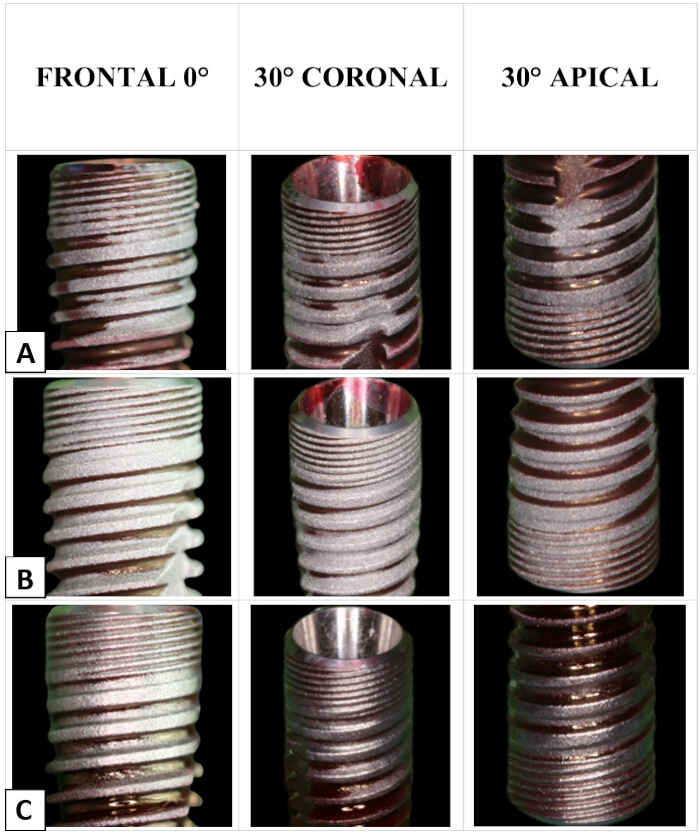
Figure 5: Representative macroscopic images of buccal implant surfaces after debridement in the Class 1B defect group. (A) erythritol, (B) sodium bicarbonate, and (C) Ni–Ti. Please click here to view a larger version of this figure.
Each surface was photographed at three angulations in a custom holder. The three photographic angulations were incorporated as complementary components of the measurement procedure rather than as independent experimental observations. Because the coronally and apically oriented aspects of the micro- and macrothread geometry are not fully visualized in a single frontal projection, frontal, coronal, and apical views were used to provide complementary representations of each assessed surface. Accordingly, the three projection-specific measurements obtained from the same surface were treated as repeated measurements of that surface and were not subjected to independent inferential comparisons.
Image analysis was performed using ImageJ. For each post-debridement image, an image-specific analysis area was defined as the entire implant segment corresponding to the coronal 5 mm that had remained exposed during instrumentation. The apical 6 mm of the 11-mm implant, corresponding to the portion embedded within the defect model, was excluded. Within this evaluable area, the total projected implant area and the area covered by residual red dye were measured in pixels. Post-treatment residual dye coverage was calculated for each projection as the residual dye-covered projected area divided by the total evaluable projected implant area within the same image, multiplied by 100. Because the absolute projected area varied with photographic angulation and minor differences in specimen framing, absolute pixel areas were not compared between images or experimental groups; all quantitative comparisons were based on the within-image percentage of residual dye coverage. No digital enhancement was applied to the raw images. Pre-treatment dye coverage was not quantitatively measured for individual implants, and no separate pre-treatment photographic dataset was acquired. Baseline contamination was instead standardized procedurally using an identical dye-immersion and drying protocol for all specimens. Consequently, no within-implant pre- versus post-treatment inferential comparison was performed, and the quantitative outcome was defined exclusively as post-treatment residual dye coverage and was not interpreted as the amount or percentage of contamination removed from baseline.
Before image analysis, the first investigator (B.B.A.) replaced the original specimen identifiers (1.1–6.10), which encoded the experimental group allocation, with non-sequential four-digit numerical codes. Only the recoded image files were provided to the second investigator (K.U.), and the correspondence between the numerical codes and the original treatment and defect groups was not disclosed during image analysis. The second investigator, who did not perform the debridement methods, therefore performed all image measurements while blinded to specimen identity and group allocation. Each image was analyzed in triplicate, and the mean value was recorded; individual repeat values were not retained. For each evaluated surface, residual dye coverage was first calculated separately for the frontal, coronal, and apical projections. The three projection-specific percentages were then averaged with equal weighting to generate a single surface-level value for each implant. For Class 1A defects, the implant-level value corresponded to the buccal surface-level value. For Class 1B defects, the implant-level value was calculated as the mean of the buccal, mesial, and distal surface-level values. The implant, rather than the individual image or photographic projection, was defined as the experimental unit for inferential analyses.
The primary outcome was implant-level post-treatment residual dye coverage (%). The primary comparison evaluated differences among the three debridement protocols separately within each defect configuration. Surface-specific residual dye coverage on the buccal, mesial, and distal surfaces of Class 1B defects was evaluated as a secondary outcome. Class 1A and Class 1B implant-level values were not compared statistically because they were derived from different sets of assessed surfaces and because treatment duration differed between the two defect configurations.
Exploratory surface characterization by SEM and EDS
Surface characterization was performed on eight implants: one from each of the six experimental groups, together with two controls — a sterile reference control and a fully dye-coated, non- instrumented implant. Within each experimental group, the specimen was selected by lot: the ten implants were numbered, corresponding numbered slips were drawn from an opaque container, and the specimen matching the drawn number was examined. Selection was carried out after all instrumentation and photographic analysis had been completed. Control specimens were examined in the same predefined regions and under identical imaging parameters as the experimental specimens. As a single specimen per group cannot be assumed to reflect the group as a whole, this component of the study is qualitative and exploratory, and the findings are reported as observations on individual specimens rather than as protocol-level effects. Specimens were stored in sterile containers and mounted on stubs using conductive carbon tape. To standardize imaging orientation, the implants were pre-marked at the cervical region. Surface morphology was examined on the buccal, mesial, and distal aspects at multiple magnifications, including ×100, ×250, ×500, ×1000, and ×5000. Additional imaging at ×10,000 magnification was performed when a detailed assessment was required. Field-emission scanning electron microscopy was performed at 10 kV to 30 kV with a working distance of 12 mm. To standardize SEM imaging, predefined regions were consistently examined across all specimens. Counting apically from the cervical margin of the implant, the second microthread within the cervical microthreaded zone and the second macrothread within the implant body were selected31. Analysis focused on a standardized 1 mm2 field within each of these two regions. Energy-dispersive X-ray spectroscopy was performed to identify the elemental composition of deposits observed on the implant surfaces. Within each predefined SEM field, EDS acquisition sites were selected according to the presence of visually identifiable surface deposits. When no discrete deposit was evident, the spectrum was acquired from the exposed titanium surface within the same predefined field. Site selection within the standardized field was therefore targeted rather than systematic, and the resulting elemental proportions describe the composition of individual deposits; they do not represent the mean surface composition of a specimen, the extent of deposition, or the proportion of the surface affected. No quantitative comparison of elemental content was made between groups. SEM and EDS findings were considered exploratory qualitative observations and were not subjected to inferential statistical analysis.
Statistical analysis
Statistical analyses were performed using IBM SPSS Statistics 25. The implant was defined as the experimental unit for all inferential analyses. Distributional assumptions were assessed using the Shapiro-Wilk test. Given the small group sizes (n = 10) and evidence of non-normality in some protocol-surface cells, non-parametric procedures were used consistently for confirmatory analyses. Data are reported as both mean ± standard deviation and median with interquartile range for descriptive purposes. The three debridement protocols were compared separately within each defect configuration using the Kruskal-Wallis test, followed by Dunn's pairwise comparisons with Bonferroni adjustment where the omnibus test was significant. Within Class 1B defects, between-protocol comparisons were additionally performed separately for the buccal, mesial, and distal surfaces. Because these surfaces were assessed repeatedly on the same implants, differences among surface sites within each protocol were evaluated using the Friedman test followed by Wilcoxon signed-rank pairwise comparisons with Bonferroni adjustment. As an exploratory analysis, the effects of debridement protocol, defect configuration, and their interaction were evaluated using a two-way analysis of variance restricted to the buccal surface, which was the only surface assessed using an identical measurement construct in both defect configurations. Model assumptions were evaluated using residual diagnostics and Levene's test for homogeneity of variance. This analysis was considered exploratory. Projection-specific measurements from the frontal, coronal, and apical photographic angulations were retained for descriptive reporting in Supplementary Table 1 but were not subjected to inferential comparison because they represented complementary projections of the same implant surface rather than independent experimental outcomes. Effect sizes were reported as η2H = (H − k + 1)/(n − k) for Kruskal-Wallis analyses, Kendall's W for Friedman analyses, r = |z|/√N for Wilcoxon signed-rank pairwise comparisons, where N represented the number of paired observations, and partial η2 for the exploratory two-way analysis of variance. Cohen's d was additionally reported as a descriptive standardized mean difference for independent-group pairwise contrasts. Statistical significance was set at p < 0.05. Pairwise hypothesis tests were two-sided and adjusted for multiple comparisons as specified above.
Results
Post-treatment residual dye coverage and implant-level protocol comparisons
Confirmatory comparisons among debridement protocols were performed separately within each defect configuration, with the implant as the experimental unit. Descriptive values for all protocols, defect configurations and surface sites are presented in Table 1. Residual dye coverage was measurable on every implant across all six experimental groups; no specimen was completely free of residual dye after debridement.
Within Class 1A defects, implant-level residual dye coverage differed significantly among the three debridement protocols (Kruskal-Wallis H = 23.28, p < 0.001, η2H = 0.79; Table 2). Residual dye coverage was highest following the erythritol protocol (36.80% ± 2.45%; median 37.11%, IQR 35.10–38.77) and lowest following the sodium bicarbonate protocol (19.63% ± 4.44%; median 20.04%, IQR 15.46–23.12), with the Ni-Ti brush protocol showing intermediate values (26.31% ± 3.04%; median 26.30%, IQR 23.91–28.21). Dunn's pairwise comparisons showed higher residual dye coverage after the erythritol protocol than after either the sodium bicarbonate protocol (adjusted p < 0.001, d = 4.79) or the Ni-Ti brush protocol (adjusted p = 0.014, d = 3.80). The difference between the sodium bicarbonate and Ni-Ti brush protocols was not statistically significant (adjusted p = 0.143).
Within Class 1B defects, the overall implant-level value, calculated as the mean of the buccal, mesial, and distal surface-level values, also differed among protocols (H = 18.71, p < 0.001, η2H = 0.62; Table 3) Residual dye coverage was 39.91% ± 3.38% (median 39.39%, IQR 38.11–42.71) for the erythritol protocol, 33.69% ± 3.52% (median 33.85%, IQR 32.53–36.26) for the sodium bicarbonate protocol, and 30.75% ± 1.97% (median 30.25%, IQR 29.64–31.10) for the Ni-Ti brush protocol. Residual dye coverage was higher with erythritol than with sodium bicarbonate (adjusted p = 0.018, d = 1.80) and the Ni-Ti brush (adjusted p < 0.001, d = 3.31), whereas sodium bicarbonate and the Ni-Ti brush did not differ significantly (adjusted p = 0.383).
Implant-level values were not statistically compared between Class 1A and Class 1B defect configurations because they were derived from different sets of assessed surfaces, and treatment duration differed between the two configurations.
Surface-specific protocol comparisons within Class 1B defects
Between-protocol comparisons were performed separately for the buccal, mesial, and distal surfaces within Class 1B defects (Table 3).
On the buccal surface, residual dye coverage differed significantly among the three protocols (H = 18.36, p < 0.001, η2H = 0.61). Mean residual dye coverage was 35.48% ± 6.51% for erythritol, 21.35 ± 5.70% for sodium bicarbonate, and 21.74% ± 2.23% for the Ni-Ti brush. Residual dye coverage was higher after the erythritol protocol than after either the sodium bicarbonate protocol (adjusted p < 0.001 , d = 2.31) or the Ni-Ti brush protocol (adjusted p = 0.001, d = 2.83), whereas the sodium bicarbonate and Ni-Ti brush protocols did not differ significantly (adjusted p = 1.000).
On the mesial surface, residual dye coverage also differed significantly among protocols (H = 8.28, p = 0.016, η2H = 0.23). Mean residual dye coverage was 43.25% ± 2.86% for erythritol, 40.10% ± 6.28% for sodium bicarbonate, and 38.69% ± 2.47% for the Ni-Ti brush. Following adjustment for multiple comparisons, residual dye coverage was higher after the erythritol protocol than after the Ni-Ti brush protocol (adjusted p = 0.014, d = 1.71). Differences between erythritol and sodium bicarbonate (p = 0.170) and between sodium bicarbonate and the Ni-Ti brush (p = 1.000) were not statistically significant.
On the distal surface, residual dye coverage differed significantly among protocols (H = 14.02, p = 0.001, η2H = 0.45). Mean residual dye coverage was 41.00% ± 4.39% for erythritol, 39.61% ± 2.97% for sodium bicarbonate, and 31.84% ± 4.58% for the Ni-Ti brush. Residual dye coverage was lower after the Ni-Ti brush protocol than after either the erythritol protocol (adjusted p = 0.003 , d = 2.04) or the sodium bicarbonate protocol (adjusted p = 0.005, d = 2.01), whereas the erythritol and sodium bicarbonate protocols did not differ significantly (adjusted p = 1.000).
Distribution of residual dye coverage across surface sites within Class 1B defects
Because the buccal, mesial, and distal surfaces were assessed on the same implants, differences among surface sites were evaluated separately within each protocol using the Friedman test (Table 4). Residual dye coverage differed significantly across surface sites for all three protocols: erythritol (χ2 = 10.40, p = 0.006, Kendall's W = 0.52), sodium bicarbonate (χ2 = 15.20, p < 0.001, W = 0.76), and Ni-Ti brush (χ2 = 16.20, p < 0.001, W = 0.81).
Following the erythritol protocol, residual dye coverage was lower on the buccal surface than on the mesial surface (median difference -8.10 percentage points, adjusted p = 0.018, r = 0.87), whereas the buccal-distal and mesial-distal comparisons were not statistically significant (adjusted p = 0.193 and p = 0.697, respectively). Following the sodium bicarbonate protocol, residual dye coverage was lower on the buccal surface than on both the mesial (median difference -17.78 percentage points, adjusted p = 0.006, r = 0.98) and distal surfaces (-18.47 percentage points, adjusted p = 0.006, r = 0.98), with no significant difference between the mesial and distal surfaces (adjusted p = 1.000). Following the Ni-Ti brush protocol, residual dye coverage was lower on the buccal surface than on both the mesial (-17.24 percentage points, adjusted p = 0.006, r = 0.98) and distal surfaces (-11.19 percentage points, adjusted p = 0.012, r = 0.91), and was lower on the distal surface than on the mesial surface (+6.56 percentage points, adjusted p = 0.018, r = 0.87).
Exploratory protocol-by-defect configuration analysis
An exploratory two-way analysis of variance was performed on buccal-surface residual dye coverage, the only outcome measured using an identical construct in both defect configurations. A significant main effect of debridement protocol was observed (F(2,54) = 70.48, p < 0.001, partial η2 = 0.723). Neither the main effect of defect configuration (F(1,54) = 1.51, p = 0.224, partial η2 = 0.027) nor the protocol-by-defect configuration interaction (F(2,54) = 2.59, p = 0.084, partial η2 = 0.088) was statistically significant. This analysis was exploratory because the original sample-size determination was not based on the detection of the interaction term, and the study, therefore, cannot exclude a small interaction effect.
Exploratory qualitative SEM-EDS observations
SEM and EDS findings are reported as exploratory descriptive observations from individual specimens, comprising one implant from each experimental group (n = 1 of 10) and two control implants, and were not subjected to inferential statistical analysis. On the erythritol-treated specimen, the examined microthread and macrothread regions showed largely preserved morphology and a relatively homogeneous surface appearance compared with the sterile reference implant. The sodium bicarbonate-treated specimen showed localized granular irregularities and crystalline-appearing deposits within the thread geometry. The Ni-Ti brush-treated specimen showed abrasion-like surface changes, including scratches, microcrack-like features, and blunting of thread peaks, which were most apparent at higher magnification (×5,000; Figure 6, Figure 7, and Figure 8). These observations were descriptive and were not interpreted as group-level protocol effects.
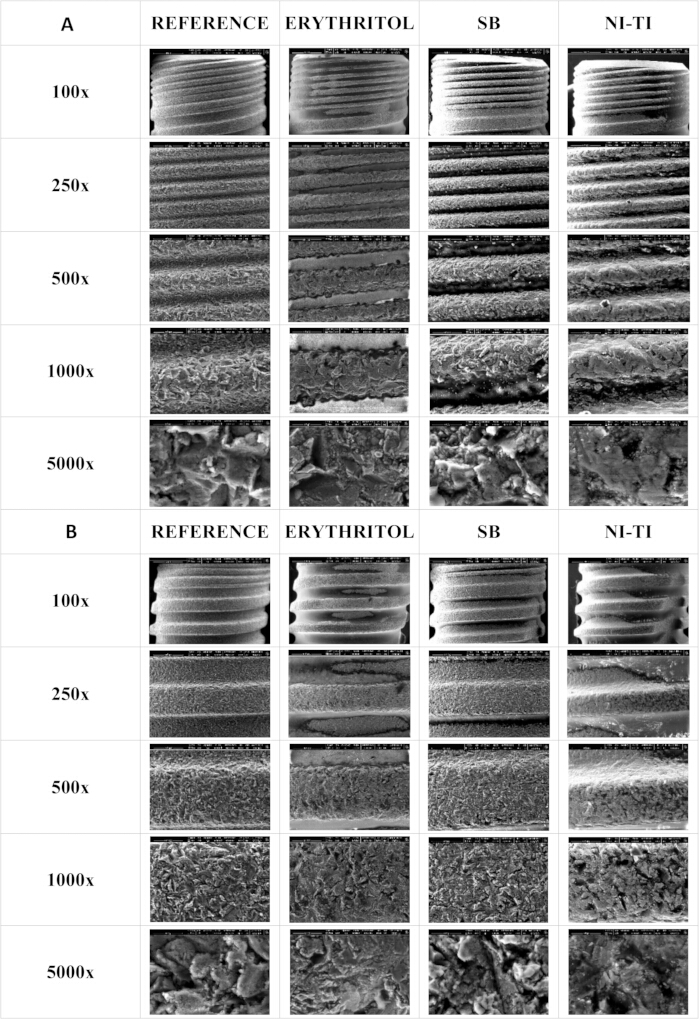
Figure 6: SEM images of microthread and macrothread surfaces in the Class 1A defect. (A) Microthread and (B) macrothread surfaces at ×100, ×250, ×500, ×1000, and ×5000 magnifications, comparing untreated reference and instrumented implant surfaces. Please click here to view a larger version of this figure.
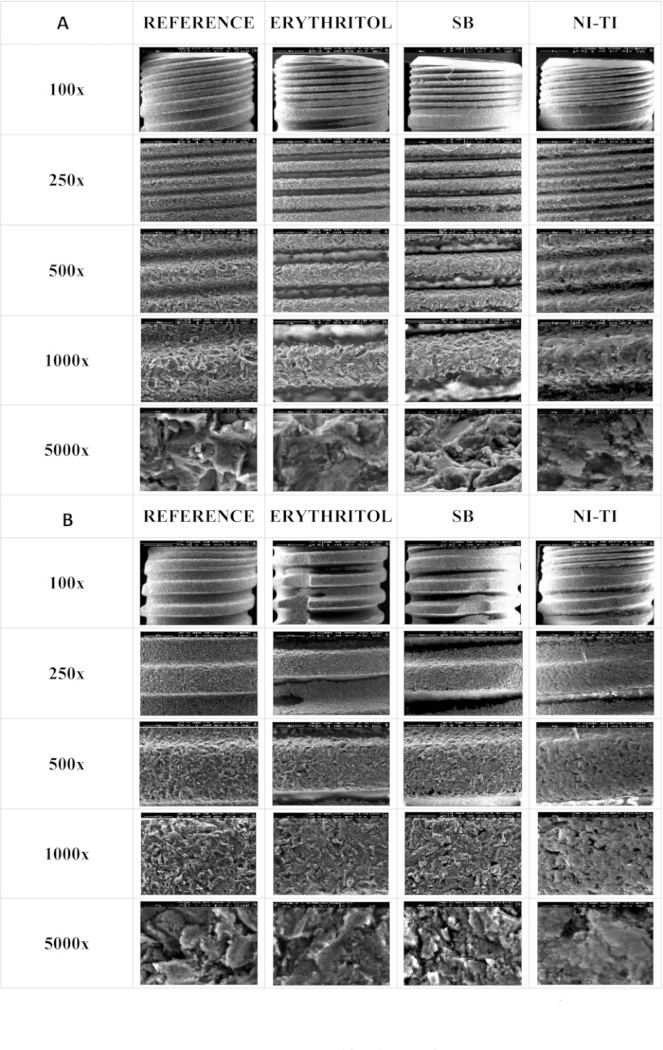
Figure 7: SEM images of microthread and macrothread surfaces on the buccal aspect in the Class 1B defect group. (A) Microthread and (B) macrothread surfaces at ×100, ×250, ×500, ×1000, and ×5000 magnifications, comparing untreated reference and instrumented implant surfaces. Please click here to view a larger version of this figure.
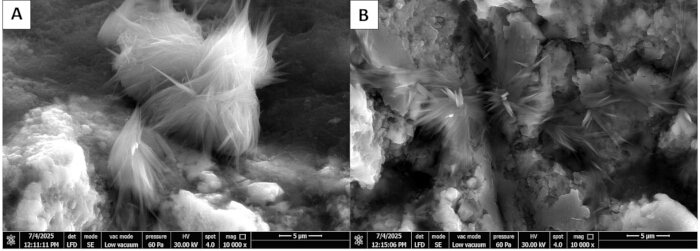
Figure 8: SEM images of specimens from the Class 1A defect group at ×10,000 magnification. The images show characteristic needle-like crystalline structures of sodium bicarbonate (NaHCO₃) particles on (A) microthread and (B) macrothread surfaces. Please click here to view a larger version of this figure.
EDS findings were interpreted descriptively at the sampled-site level rather than as quantitative estimates of whole-surface elemental composition. On the sterile reference implant, only titanium was detected in the analyzed spectrum. The dye-coated, non-instrumented control showed prominent carbon and oxygen signals (Supplementary Figure 1). On the erythritol-treated specimen, no discrete deposits were identified within the examined fields, and the analyzed exposed surface was predominantly composed of titanium. On the sodium bicarbonate-treated specimen, sodium and oxygen signals were detected at crystalline-appearing deposits, compatible with sodium-containing residues from the sodium bicarbonate protocol. On the Ni-Ti brush-treated specimen, spectra acquired from visible deposits showed carbon and oxygen as the principal detected elements (Supplementary Figure 2). Carbon-containing spectra were interpreted cautiously because carbon signals may be influenced by surface contamination and specimen preparation.
Within this phantom-head in vitro model, post-treatment residual dye coverage differed significantly among the three debridement protocols in both defect configurations, and the null hypothesis of no difference among protocols was rejected for the primary outcome. At the implant level, the erythritol air-flowing protocol showed higher residual dye coverage than the sodium bicarbonate air-polishing and Ni-Ti brush protocols in both Class 1A and Class 1B defects, whereas the sodium bicarbonate air-polishing and Ni-Ti brush protocols did not differ significantly within either configuration. Within Class 1B defects, the Ni-Ti brush protocol showed lower residual dye coverage on the distal surface than both the erythritol and sodium bicarbonate protocols, and residual dye distribution differed significantly among surface sites within each protocol. Residual dye remained on all implants following each debridement protocol. The protocol-by-defect configuration analysis was exploratory, while SEM-EDS findings were interpreted descriptively; the examined specimens showed differences in surface appearance and sampled elemental composition.
DATA AVAILABILITY:
The data supporting the findings of this study, including the raw quantitative datasets and the original SEM and EDS files, are available as Supplementary Material (Supplementary File 1).
| Protocol | Defect | Surface | n | Mean ± SD | Median [IQR] | Range |
| Erythritol | Class 1A | Buccal (implant-level) | 10 | 36.80 ± 2.45 | 37.11 [35.10–38.77] | 32.59–39.99 |
| Erythritol | Class 1B | Buccal | 10 | 35.48 ± 6.51 | 35.12 [32.69–35.87] | 26.14–50.76 |
| Erythritol | Class 1B | Mesial | 10 | 43.25 ± 2.86 | 44.12 [43.22–44.45] | 36.37–46.56 |
| Erythritol | Class 1B | Distal | 10 | 41.00 ± 4.39 | 39.60 [37.81–42.59] | 37.22–50.50 |
| Erythritol | Class 1B | Implant-level | 10 | 39.91 ± 3.38 | 39.39 [38.11–42.71] | 34.84–45.14 |
| Sodium bicarbonate | Class 1A | Buccal (implant-level) | 10 | 19.63 ± 4.44 | 20.04 [15.46–23.12] | 13.77–25.93 |
| Sodium bicarbonate | Class 1B | Buccal | 10 | 21.35 ± 5.70 | 19.76 [16.73–24.65] | 14.72–30.75 |
| Sodium bicarbonate | Class 1B | Mesial | 10 | 40.10 ± 6.28 | 41.28 [34.11–43.56] | 32.03–51.57 |
| Sodium bicarbonate | Class 1B | Distal | 10 | 39.61 ± 2.97 | 39.61 [38.12–40.84] | 34.03–44.31 |
| Sodium bicarbonate | Class 1B | Implant-level | 10 | 33.69 ± 3.52 | 33.85 [32.53–36.26] | 27.28–38.15 |
| Ni–Ti brush | Class 1A | Buccal (implant-level) | 10 | 26.31 ± 3.04 | 26.30 [23.91–28.21] | 22.13–31.28 |
| Ni–Ti brush | Class 1B | Buccal | 10 | 21.74 ± 2.23 | 21.36 [20.16–22.62] | 18.98–26.03 |
| Ni–Ti brush | Class 1B | Mesial | 10 | 38.69 ± 2.47 | 38.82 [38.02–40.25] | 34.13–42.24 |
| Ni–Ti brush | Class 1B | Distal | 10 | 31.84 ± 4.58 | 31.39 [28.85–33.60] | 24.71–40.79 |
| Ni–Ti brush | Class 1B | Implant-level | 10 | 30.75 ± 1.97 | 30.25 [29.64–31.10] | 28.44–34.58 |
Table 1: Post-treatment residual dye coverage, by protocol, defect configuration, and surface site. Residual dye coverage is expressed as the percentage of residual dye-covered pixels relative to the total evaluable projected implant area within the same image. Each surface value is the mean of the frontal, coronal and apical projections; implant-level values are the mean of the assessed surfaces. Descriptive statistics only; between-protocol comparisons are reported in Table 2 and Table 3. In Class 1A defects, only the buccal surface was accessible for instrumentation and assessment; the implant-level value is therefore identical to the buccal value. In Class 1B defects, the implant-level value is the mean of the buccal, mesial, and distal surface values of the same implant. Pre-treatment dye coverage was not quantitatively measured for individual implants. Baseline contamination was standardized procedurally using an identical dye-immersion and drying protocol for all specimens. Values are therefore interpreted exclusively as post-treatment residual dye coverage and not as the amount or percentage of contamination removed. Treatment duration was 2 min for Class 1A and 3 min for Class 1B defects. Class 1A and Class 1B implant-level values derive from different sets of assessed surfaces and were not compared statistically.
| Protocol | Mean ± SD | Median [IQR] | H | p | η²H |
| Erythritol | 36.80 ± 2.45 | 37.11 [35.10–38.77] | 23.28 | < 0.001 | 0.79 |
| Sodium bicarbonate | 19.63 ± 4.44 | 20.04 [15.46–23.12] | |||
| Ni–Ti brush | 26.31 ± 3.04 | 26.30 [23.91–28.21] | |||
| Pairwise comparisons (Dunn's test, Bonferroni-adjusted) | |||||
| Comparison | z | p | Cohen's d | ||
| Erythritol vs. sodium bicarbonate | 4.80 | < 0.001 | 4.79 | ||
| Erythritol vs. Ni–Ti brush | 2.82 | 0.014 | 3.80 | ||
| Sodium bicarbonate vs. Ni–Ti brush | 1.98 | 0.143 | −1.76 | ||
Table 2: Comparison of debridement protocols within Class 1A defects. Post-treatment residual dye coverage (%) at implant level; in this configuration, the implant-level value corresponds to the buccal surface. The implant is the experimental unit; each value is the mean of three angulations. n = 10 per group. Kruskal-Wallis test followed by Dunn's pairwise comparisons, where the omnibus test was significant, with Bonferroni adjustment. η2H = (H − k + 1)/(n − k). Treatment duration was 2 min for all three protocols in this configuration. A positive Cohen's d indicates higher residual dye coverage for the first-named protocol.
| Level / statistic | Erythritol | Sodium bicarbonate | Ni–Ti brush | H | p | η²H |
| Overall implant level (primary) | ||||||
| Mean ± SD | 39.91 ± 3.38 | 33.69 ± 3.52 | 30.75 ± 1.97 | 18.71 | < 0.001 | 0.62 |
| Median [IQR] | 39.39 [38.11–42.71] | 33.85 [32.53–36.26] | 30.25 [29.64–31.10] | |||
| Buccal surface | ||||||
| Mean ± SD | 35.48 ± 6.51 | 21.35 ± 5.70 | 21.74 ± 2.23 | 18.36 | < 0.001 | 0.61 |
| Median [IQR] | 35.12 [32.69–35.87] | 19.76 [16.73–24.65] | 21.36 [20.16–22.62] | |||
| Mesial surface | ||||||
| Mean ± SD | 43.25 ± 2.86 | 40.10 ± 6.28 | 38.69 ± 2.47 | 8.28 | 0.016 | 0.23 |
| Median [IQR] | 44.12 [43.22–44.45] | 41.28 [34.11–43.56] | 38.82 [38.02–40.25] | |||
| Distal surface | ||||||
| Mean ± SD | 41.00 ± 4.39 | 39.61 ± 2.97 | 31.84 ± 4.58 | 14.02 | 0.001 | 0.45 |
| Median [IQR] | 39.60 [37.81–42.59] | 39.61 [38.12–40.84] | 31.39 [28.85–33.60] | |||
| Pairwise comparisons (Dunn's test, Bonferroni-adjusted) | ||||||
| Level | Comparison | z | p | Cohen's d | ||
| Overall implant level | Erythritol vs. sodium bicarbonate | 2.74 | 0.018 | 1.80 | ||
| Overall implant level | Erythritol vs. Ni–Ti brush | 4.27 | < 0.001 | 3.31 | ||
| Overall implant level | Sodium bicarbonate vs. Ni–Ti brush | 1.52 | 0.383 | 1.03 | ||
| Buccal | Erythritol vs. sodium bicarbonate | 3.89 | < 0.001 | 2.31 | ||
| Buccal | Erythritol vs. Ni–Ti brush | 3.51 | 0.001 | 2.83 | ||
| Buccal | Sodium bicarbonate vs. Ni–Ti brush | 0.38 | 1.000 | −0.09 | ||
| Mesial | Erythritol vs. sodium bicarbonate | 1.91 | 0.170 | 0.65 | ||
| Mesial | Erythritol vs. Ni–Ti brush | 2.82 | 0.014 | 1.71 | ||
| Mesial | Sodium bicarbonate vs. Ni–Ti brush | 0.91 | 1.000 | 0.30 | ||
| Distal | Erythritol vs. sodium bicarbonate | 0.18 | 1.000 | 0.37 | ||
| Distal | Erythritol vs. Ni–Ti brush | 3.33 | 0.003 | 2.04 | ||
| Distal | Sodium bicarbonate vs. Ni–Ti brush | 3.15 | 0.005 | 2.01 | ||
Table 3: Comparison of debridement protocols within Class 1B defects, at the implant level, and by surface site. Post-treatment residual dye coverage (%). The implant-level comparison is the primary analysis for this configuration; surface-specific comparisons are secondary. Surfaces were assessed on the same implants and are analyzed separately. n = 10 per group. Kruskal-Wallis test followed by Dunn's pairwise comparisons, where the omnibus test was significant, with Bonferroni adjustment. Treatment duration was 3 min for all three protocols in this configuration. Non-significant pairwise differences should not be interpreted as evidence of equivalence. A positive Cohen's d indicates higher residual dye coverage for the first-named protocol.
| Protocol / statistic | Buccal | Mesial | Distal | χ² | p | Kendall's W |
| Erythritol | ||||||
| Mean ± SD | 35.48 ± 6.51 | 43.25 ± 2.86 | 41.00 ± 4.39 | 10.40 | 0.006 | 0.52 |
| Median [IQR] | 35.12 [32.69–35.87] | 44.12 [43.22–44.45] | 39.60 [37.81–42.59] | |||
| Sodium bicarbonate | ||||||
| Mean ± SD | 21.35 ± 5.70 | 40.10 ± 6.28 | 39.61 ± 2.97 | 15.20 | < 0.001 | 0.76 |
| Median [IQR] | 19.76 [16.73–24.65] | 41.28 [34.11–43.56] | 39.61 [38.12–40.84] | |||
| Ni–Ti brush | ||||||
| Mean ± SD | 21.74 ± 2.23 | 38.69 ± 2.47 | 31.84 ± 4.58 | 16.20 | < 0.001 | 0.81 |
| Median [IQR] | 21.36 [20.16–22.62] | 38.82 [38.02–40.25] | 31.39 [28.85–33.60] | |||
| Pairwise comparisons (Wilcoxon signed-rank, Bonferroni-adjusted) | ||||||
| Protocol | Comparison | Median difference | p | r | ||
| Erythritol | Buccal vs. mesial | −8.10 | 0.018 | 0.87 | ||
| Erythritol | Buccal vs. distal | −5.36 | 0.193 | 0.58 | ||
| Erythritol | Mesial vs. distal | +3.82 | 0.697 | 0.38 | ||
| Sodium bicarbonate | Buccal vs. mesial | −17.78 | 0.006 | 0.98 | ||
| Sodium bicarbonate | Buccal vs. distal | −18.47 | 0.006 | 0.98 | ||
| Sodium bicarbonate | Mesial vs. distal | −1.72 | 1.000 | 0.00 | ||
| Ni–Ti brush | Buccal vs. mesial | −17.24 | 0.006 | 0.98 | ||
| Ni–Ti brush | Buccal vs. distal | −11.19 | 0.012 | 0.91 | ||
| Ni–Ti brush | Mesial vs. distal | +6.56 | 0.018 | 0.87 | ||
Table 4: Distribution of post-treatment residual dye coverage across surface sites within Class 1B defects. Buccal, mesial, and distal surfaces were assessed on the same implants and are treated as repeated measures within an implant. Each value is the mean of the frontal, coronal, and apical projections; n = 10 implants per protocol. Friedman test followed by Wilcoxon signed-rank pairwise comparisons with Bonferroni adjustment. Kendall's W is the effect size for the omnibus test; r = |z|/√n for pairwise comparisons. Negative median differences indicate lower residual dye coverage on the first-named surface. Treatment duration was 3 min for all three protocols. Performed within Class 1B defects only, as proximal surfaces were not accessible in the Class 1A configuration.
Supplementary Figure 1: EDS analysis of a sterile reference implant surface and a dye-contaminated, untreated implant surface. (A) Sterile reference implant surface and (B) a dye-contaminated, untreated implant surface. Please click here to download this file.
Supplementary Figure 2: EDS analysis of implant surfaces after debridement. (A) Erythritol, (B) sodium bicarbonate, and (C) Ni–Ti. Please click here to download this file.
Supplementary Table 1: Projection-specific residual dye coverage according to photographic angulation (descriptive). Residual dye coverage (%) for each of the three photographic projections, reported for transparency. These values were not subjected to inferential comparison: the frontal, coronal, and apical views are complementary projections of the same implant surface rather than independent experimental outcomes, and the surface-level values used in all analyses are their equally weighted mean. n = 10 implants per protocol and configuration. Values are implant-level means for the projection indicated. No p-values are reported. Projection-specific measurements are descriptive only. Please click here to download this file.
Supplementary File 1: Raw data.zip. Please click here to download this file.
Discussion
The present in vitro study compared erythritol air-flowing, sodium bicarbonate air-polishing, and Ni-Ti brush instrumentation within a standardized phantom-head framework incorporating two peri-implant defect configurations. An important feature of this model was the incorporation of access restrictions related to defect geometry and adjacent dentition. Previous in vitro studies21,22,25,26,34 have frequently evaluated mechanical instrumentation using horizontal, circumferential, or otherwise more accessible defect configurations. The Class 1A and Class 1B configurations used here instead represent two frequently observed implant-level defect patterns reported by Monje et al.32, and Khan et al.29, and Ozgu et al.31, similarly used three-dimensional defect models to investigate mechanical instrumentation. In the present study, integration of these defect models into a dental phantom head extended this approach by introducing additional constraints related to adjacent dentition and operator positioning. Accordingly, the observed differences should be interpreted within the context of this phantom-head model and not as evidence of biological decontamination or clinical treatment efficacy. The principal quantitative finding was that erythritol air-flowing resulted in greater implant-level residual dye coverage than both sodium bicarbonate air-polishing and Ni-Ti brush instrumentation in both defect configurations, whereas sodium bicarbonate air-polishing and Ni-Ti brush instrumentation did not differ significantly at the implant level. The differences observed between erythritol air-flowing and sodium bicarbonate air-polishing should be interpreted at the level of the complete tested protocols. Previous systematic reviews have shown substantial variability in the performance of air-abrasive systems according to implant surface characteristics, powder properties, access conditions, and instrumentation parameters19,20. In the present experiment, the two air-abrasive protocols differed not only in powder composition and particle size but also in handpiece design, operating pressure, working distance, angulation, and delivery pattern. Consequently, the lower residual dye coverage observed with sodium bicarbonate cannot be attributed specifically to its approximately 40-µm particle size relative to the 14-µm erythritol powder. Powder characteristics may contribute to mechanical interactions with the surface, but their effect cannot be isolated from other protocol-specific parameters. This interpretation is supported by laboratory studies in which erythritol and sodium bicarbonate have produced different or comparable outcomes depending on the experimental conditions, and by recent evidence showing that handpiece design, power setting, air pressure, working distance, and implant surface can substantially influence air-abrasive protocol performance35,36. In a separate in vitro biofilm model, Pujarern et al.37 reported no significant difference between erythritol and sodium bicarbonate. Differences between that study and the present findings may reflect variation in the experimental model and protocol-specific operating conditions, but direct comparison is limited because the measured outcomes and experimental conditions were not equivalent.
At the implant level, Ni-Ti brush instrumentation did not differ significantly from sodium bicarbonate air-polishing in either defect configuration. Within Class 1B defects, however, Ni-Ti brush instrumentation resulted in lower residual dye coverage on the distal surface than both erythritol air-flowing and sodium bicarbonate air-polishing. This surface-specific finding should not be generalized as evidence of the overall superiority of Ni-Ti instrumentation in complex defect configurations. The implant-level result is consistent with an in vitro report of comparable cleaning performance between air-abrasive systems and rotating brushes on dye-contaminated implant surfaces24, however, this study evaluated titanium brushes rather than Ni-Ti brushes and therefore provides only indirect context for the present findings. The surface-specific findings within Class 1B defects further emphasize the importance of access geometry. Residual dye distribution differed among the buccal, mesial, and distal surfaces for all three protocols, although the pattern was not identical: buccal coverage was lower than mesial coverage following erythritol air-flowing, and lower than both mesial and distal coverage following sodium bicarbonate air-polishing and Ni–Ti brush instrumentation. These findings are consistent with previous simulated peri-implant defect studies showing that inaccessible surface areas, implant geometry, and defect configuration can influence the amount and distribution of material remaining on implant surfaces after mechanical instrumentation21,24. A direct implant-level comparison between the two defect configurations was not possible: Class 1A values were derived from the buccal surface only, whereas Class 1B implant-level values incorporated buccal, mesial, and distal surfaces, and treatment duration also differed between the two configurations. The exploratory analysis, restricted to the buccal surface, which provided the only identical measurement construct across both configurations, showed a significant protocol effect but no statistically significant defect-configuration effect or protocol-by-defect interaction. Accordingly, the present data do not support a claim that defect configuration modifies the relative performance of the three protocols. The exploratory interaction analysis was not powered to detect such an effect, and a small interaction cannot be excluded. The Ni-Ti brush findings require site-specific interpretation similarly. Within Class 1B defects, Ni-Ti brush instrumentation resulted in lower residual dye coverage than both air-abrasive protocol on the distal surface and lower coverage than erythritol air-flowing on the mesial surface. These surface-specific differences should not be generalized as evidence of an overall advantage of Ni-Ti brushes in complex defects. The distal finding may reflect the direct mechanical engagement provided by the predefined Omega and Nano brush sequence within the restricted proximal anatomy. However, brush geometry was assigned to surface sites a priori, with Omega and Nano brushes used on proximal surfaces and Pocket Short and Nano brushes on the buccal surface. Brush type was therefore confounded with surface site, and the observed distal difference cannot be attributed independently to Ni-Ti instrumentation, brush geometry, or access conditions.
The SEM-EDS component provides additional descriptive information but must be interpreted separately from the quantitative residual-dye analysis. Qualitative SEM-EDS assessment was performed on one implant per group, and EDS acquisition sites were targeted within predefined fields according to the presence of visible deposits. The observations, therefore, characterize individual specimens and sampled locations rather than estimating the frequency or magnitude of surface alterations within each protocol. Within each specimen, a tiered magnification protocol was used rather than relying solely on isolated high-magnification fields, allowing overall thread morphology and localized surface features to be examined together. This reduced dependence on a single field of view but did not overcome the limitation of examining only one specimen per group. Within these limits, the erythritol-treated specimen showed a surface appearance relatively similar to the sterile reference in the examined microthread and macrothread regions (Figure 6, Figure 7, Supplementary Figure 1A, and Supplementary Figure 2A). The sodium bicarbonate-treated specimen showed localized crystalline-appearing deposits, with sodium and oxygen detected at these sites (Figure 8 and Supplementary Figure 2B). These findings are compatible with the presence of sodium-containing residues following sodium bicarbonate air-polishing. In contrast, the Ni-Ti-treated specimen showed abrasion-like surface alterations, including scratches, microcrack-like features, and blunting of thread peaks (Figure 6 and Figure 7). These specimen-level observations are consistent with experimental evidence showing that nitinol and titanium brushes can alter the morphology and topography of rough titanium surfaces, with effects varying according to surface type38. Carbon-dominated EDS spectra were interpreted cautiously because carbon signals may be influenced by adventitious surface contamination and specimen preparation (Supplementary Figure 2C). Because no quantitative topographic analysis, such as profilometry, was performed, the SEM observations cannot establish the magnitude of the observed surface alterations or whether they occurred consistently across the remaining implants. The possibility of brush deterioration and metallic particle release also warrants consideration. Visible deterioration of the Ni-Ti brushes was observed after instrumentation and was photographically documented (Figure 3C). However, the brushes were not systematically examined before and after use, and the extent of wear, bristle deformation, or material loss was not quantified. Therefore, although the observed deterioration raises the possibility of Ni-Ti particle release during instrumentation, the present experiment cannot determine whether such particles were released or deposited on the implant surface. Similarly, the absence of a detectable nickel signal at the sampled EDS sites does not exclude release elsewhere on the implant surface or release below the spatial or analytical detection limits of the applied EDS protocol. This question is particularly relevant for Ni-Ti devices, because nickel-containing alloys raise material-specific concerns regarding possible ion or particle release, particularly given the known allergenic potential of nickel. The present data do not permit conclusions regarding nickel release, corrosion, or biological effects. Future studies should therefore combine systematic pre- and post-use characterization of Ni-Ti brushes with quantitative particle analysis and surface-sensitive techniques such as X-ray photoelectron spectroscopy (XPS) to assess possible changes in surface chemistry and the composition or oxidation state of the titanium oxide passivation layer. XPS has been used to characterize treatment-related surface chemistry following metallic brush instrumentation, including titanium-brush instrumentation by Lollobrigida et al.39, and has more recently been used alongside SEM, EDX, and profilometry to characterize the surface-chemical effects of nitinol brush instrumentation38.
An important methodological feature of the present study was the incorporation of predefined access restrictions into a standardized phantom-head setup. Class 1A and Class 1B defect configurations were digitally designed and 3D printed, adjacent dentition was retained, implant exposure was standardized to the coronal 5 mm, and instrumentation was performed by one operator under predefined protocol-specific conditions. Following previous methodology23,24, customized acrylic blocks were used to acquire images from a frontal view and from 30° coronal and apical angulations (Figure 4 and Figure 5). The photographic assessment was also structured so that frontal, coronal, and apical projections served as complementary views of the same surface rather than independent experimental observations. Their equally weighted mean was used to obtain a single surface-level value, and the implant was retained as the experimental unit. In addition, image files were recoded using non-sequential numerical identifiers before analysis, allowing the examiner performing ImageJ measurements to remain unaware of treatment allocation and implant identity. These features reduced several sources of measurement and analytical variability while maintaining the access restrictions created by the phantom-head configuration.
Several additional limitations should be considered. First, group allocation and protocol order followed a fixed sequence rather than being randomized, and simulated contamination was performed in protocol-specific batches on consecutive treatment days. All specimens were sterile, industrially manufactured units of identical specification originating from a single production lot, which constrains specimen-level variation; nevertheless, protocol was confounded with treatment day and batch, even though an identical 15-s dye immersion and 24-h drying interval was maintained for every experimental specimen. This design may have introduced systematic differences that cannot be separated statistically from treatment effects. Allocation was not concealed, and operator blinding was impossible because both the instruments and defect configurations were visually apparent during treatment; as a single operator performed all procedures, performance bias cannot be excluded. Second, residual dye was identified manually in ImageJ. Each image was measured in triplicate, and the mean was used, but the individual replicate measurements were not retained; consequently, intra-examiner repeatability and an intraclass correlation coefficient cannot be calculated retrospectively. The blind coding of image files reduced the potential for treatment-aware assessment bias but did not eliminate the subjective component of manual segmentation; defect configuration, moreover, remained inferable from image content, since Class 1B images include proximal surfaces not present in Class 1A images. Assessment was image-based and two-dimensional: although three angulations were used to capture surfaces not visible in a single projection, residual dye within the deepest thread recesses cannot be resolved photographically, and reported values may underestimate true residual dye coverage on the three-dimensional implant surface. Third, although instrumentation time and brush sequence were predefined within each defect configuration, different Ni-Ti brush geometries were intentionally assigned to different surfaces. The Ni-Ti intervention should therefore be interpreted as the performance of the complete predefined brush protocol rather than the isolated effect of brush material or any individual brush design. In addition, each brush set was used for five implants despite the manufacturer's single-use instructions. Visible deterioration of the Ni-Ti brushes was observed after instrumentation and was photographically documented; however, the extent of wear, bristle deformation, or material loss was not quantified. Thus, an influence of progressive brush deterioration on instrumentation performance cannot be excluded. Fourth, Class 1A and Class 1B differed in both treatment duration and the surfaces contributing to the implant-level outcome; for this reason, direct statistical comparisons between the configurations were intentionally avoided. Fifth, the sample-size calculation supported the prespecified primary comparisons, but the study had limited sensitivity for smaller effects, particularly surface-specific differences and the exploratory protocol-by-defect interaction. Accordingly, non-significant comparisons should not be interpreted as evidence of equivalence. Sixth, only one grade 4 titanium implant design and one defined rough surface were evaluated. The findings may differ from other implant macrogeometries, thread designs, surface treatments, or materials. Finally, SEM-EDS was based on one implant per experimental group and targeted EDS sampling, without quantitative profilometry, XPS, or systematic particle analysis. These observations, therefore, cannot be generalized as protocol-level surface effects. The permanent-dye model nevertheless defines an important boundary for interpretation. The study quantified the percentage of the evaluable projected implant surface covered by residual red dye after treatment. Permanent dye provides standardized visual contrast and allows the same image-analysis procedure to be applied across specimens, as in several previous experimental implant-cleaning models14,21,24. However, dried dye does not reproduce the structural organization, extracellular matrix, adhesion characteristics, microbial viability, or host interactions of a naturally developed peri-implant biofilm, and the findings should not be extrapolated to biofilm removal or to biological or clinical outcomes. Moreover, although dye application was procedurally standardized using the same immersion and drying procedure, no separate pre-treatment photographic dataset was obtained, and initial dye coverage was not quantified for each implant. Consequently, within-implant change scores could not be calculated, and the outcome represents post-treatment residual dye coverage. The present findings, therefore, cannot establish the absolute amount or percentage of dye removed from baseline, nor can they establish bacterial killing, biofilm disruption, or restoration of surface biocompatibility. They should be interpreted exclusively as comparative post-treatment residual dye coverage. The phantom-head model also remains substantially different from the biological and procedural environment of peri-implantitis treatment. It reproduced selected mechanical access restrictions but did not include soft tissues, an actual mucoperiosteal flap, bleeding, saliva, salivary pellicle, calculus, naturally developed multispecies biofilm, host inflammatory responses, healing, or patient-related factors. Accordingly, the present findings cannot predict clinical disease resolution, re-osseointegration, treatment prognosis, or the relative clinical effectiveness of the three procedures. Mechanical surface debridement should therefore be regarded as one component of peri-implantitis management rather than a standalone strategy; effective management also requires sustained control of the peri-implant biofilm and the maintenance or re-establishment of a stable peri-implant soft-tissue barrier40,41. Thus, the present results should be considered preclinical evidence of residual dye distribution under defined access conditions and should not be used as a basis for recommending any protocol for clinical treatment.
Within this phantom-head in vitro model, post-treatment residual dye coverage differed among the three debridement protocols in both defect configurations. Erythritol air-flowing left greater implant-level residual coverage than sodium bicarbonate air-polishing and Ni-Ti brush instrumentation within both Class 1A and Class 1B defects, while sodium bicarbonate air-polishing and Ni-Ti brush instrumentation did not differ significantly at the implant level within either configuration. In Class 1B defects, residual dye distribution varied by surface site, and the Ni-Ti brush protocol resulted in lower distal-surface residual coverage than the other two protocols. Residual dye remained after every protocol, consistent with previous experimental findings20,22,25,26,34. The exploratory SEM-EDS observations further indicated differences in surface appearance and sampled deposit composition among the individual specimens, but these observations require confirmation in studies with adequate group-level sampling and quantitative surface characterization. Future work should evaluate these protocols using biological contamination models, randomized treatment sequences, prospective assessment of intra- and inter-examiner agreement in image segmentation, single-use Ni-Ti instrumentation with systematic wear and particle analysis, and surface-characterization methods capable of quantifying topographical and chemical changes.
Disclosures
The authors declare no conflicts of interest related to this study. The study was partially self-funded by the authors and their institutions. The companies that supplied study materials had no involvement in the design, conduct, analysis, interpretation, or reporting of the study.
Acknowledgements
The authors acknowledge Dentsply Sirona for supplying the implants used in this study. The authors also acknowledge EMS for providing the powders and submucosal nozzle tips used in the experimental procedures.
Materials
| Name | Company | Catalog Number | Comments |
|---|---|---|---|
| 3D printing system | DentaFab, Istanbul, Turkey | https://www.dentafab.com/ | Used to fabricate the finalized STL files of the 3D peri-implant defect models using model resin. |
| Acrylic photographic holder | Custom-made | Custom-made | Used to standardize implant positioning during post-decontamination image acquisition. |
| Air-Flow Classic Comfort (40 µm) | EMS, Nyon, Switzerland | https://www.ems-dental.com/en-us/products/airflow-comfort | Sodium bicarbonate powder (40 µm); Used for sodium bicarbonate air-polishing decontamination. |
| Airflow Max | EMS, Nyon, Switzerland | https://www.ems-dental.com/en-us/products/airflow-max | Air-polishing handpiece, supramucosal; Used with sodium bicarbonate powder at 4 bar, maintaining a 2-5 mm distance and 15°–80° angulation maximum water setting, and manufacturer-recommended power. |
| CAD software | Exocad GmbH, Darmstadt, Germany | Not specified | Used to import STL data and digitally design peri-implantitis defect configurations. |
| Canon EOS 70D | Canon Inc., Japan | Not specified | Digital camera; Used for standardized high-resolution photographic documentation under fixed camera settings. |
| EDGE Laboratory scanner | DOF Inc., Seoul, Korea | Not specified | Used to digitize the modified mandibular phantom model and generate STL data. |
| Educational dental phantom model | Frasaco, Tettnang, Germany | https://www.frasaco.de/ | Modified by removing the mandibular first molar and replacing the site with soft silicone material to create a flat alveolar ridge. |
| Energy-dispersive X-ray spectroscopy system | EDS unit integrated with SEM, FEI Company | Not specified | Used on selected samples to determine the elemental composition of surface residues. |
| Erythritol powder | Air-Flow PLUS, 14 µm, EMS, Switzerland | Not specified | Used for erythritol air-flowing decontamination. |
| ImageJ v1.54g | NIH, USA | Version v1.54g | Image analysis software; Used to quantify residual surface contamination. RRID: SCR_003070. |
| Implant driver or impression post | Dentsply Sirona, Germany | https://www.dentsplysirona.com/en-us/shop/BP-1000191388/implant-driver-ev.html | Used to handle implants during contamination and experimental procedures to avoid direct contact with the implant surface. |
| KaVo Dental SURGmatic S201 XL Pro | KaVo Dental Excellence, Germany | https://www.kavo.com/en/surgmatic-s201-xll-pro | Surgical contra-angle; Used to operate the nickel-titanium brush system at 900 rpm. |
| Macro lens | EF 100 mm f/2.8L Macro IS USM, Canon Inc., Japan | Not specified | Used with the digital camera for standardized macro photography of implant surfaces. |
| Metal nut | DIN 934-I6I(A2K) SW7-M4; Würth | Not specified | Used as part of the custom fixation system to mount 3D-printed models onto phantom head units. |
| Model resin | Alias, Istanbul, Turkey | Not specified | Used to fabricate the 3D-printed peri-implantitis defect models. |
| NiTi Brush set | Hans Korea Co. Ltd., South Korea | GMDN code: 57955 | Brush types included Omega, Pocket short, Pocket, and Nano; operated at 900 rpm under continuous saline irrigation. |
| Perioflow | EMS, Nyon, Switzerland | https://www.ems-dental.com/en-us/products/perioflow-max | Airflowing handpiece, submucosal; Used with 14 µm erythritol powder at 6 bar, maximum water setting, and manufacturer-recommended power. |
| PrimeTaper EV Implant | OsseoSpeed, Dentsply Sirona, Germany | 68011099 | Dental implant; Commercially pure titanium, grade 4; cervical diameter 4.2 mm; length 11 mm; macrothread pitch 0.75 mm; microthread pitch 0.25 mm. Manufacturing lot no: 527590 |
| QUANTA FEG 250 | FEI Technologies Inc., Oregon, USA | Not specified | Scanning electron microscope; Used for qualitative surface characterization at 10-30 kV and a working distance of 12 mm. |
| Red permanent dye | Edding Permanent Lumocolor, Nuremberg, Germany | https://www.edding.com/ | Used as a simulated biofilm surrogate; implants were immersed for 15 s and air-dried for 24 h. |
| SPSS Statistics 25 | IBM SPSS Statistics 25, SPSS Inc., USA | Version 25 | Statistical analysis software; Used for statistical analysis. RRID: SCR_016479. |
| Surgical motor | Dentsply Sirona, Charlotte, USA | https://www.dentsplysirona.com/en-us | Used to prepare osteotomies at 800 rpm, parallel to adjacent teeth. |
| Tokuyama Universal Bond | Tokuyama Universal Bond, Tokuyama Dental, Japan | Not specified | Universal adhesive; Used to secure the metal screw nut to the base of each 3D-printed model. |
References
- Herrera D, et al. Prevention and treatment of peri-implant diseases—The EFP S3 level clinical practice guideline. J Clin Periodontol. 2023;50(S26):4-76.
- Berglundh T, et al. Peri-implant diseases and conditions: Consensus report of workgroup 4 of the 2017 World Workshop on the Classification of Periodontal and Peri-Implant Diseases and Conditions. J Periodontol. 2018;89:S313-8.
- Schwarz F, Derks J, Monje A, Wang HL. Peri-implantitis. J Clin Periodontol. 2018;45:S246-66.
- Derks J, Tomasi C. Peri-implant health and disease. A systematic review of current epidemiology. J Clin Periodontol. 2015;42(S16):S158-71.
- Diaz P, et al. What is the prevalence of peri-implantitis? A systematic review and meta-analysis. BMC Oral Health. 2022;22(1).
- Lindhe J, Meyle J. Peri-implant diseases: Consensus report of the Sixth European Workshop on Periodontology. J Clin Periodontol. 2008;35(S8):282-5.
- Chan H, et al. Surgical management of peri-implantitis: A systematic review and meta-analysis of treatment outcomes. J Periodontol. 2014;85(8):1027-41.
- Renvert S, Polyzois IN. Clinical approaches to treat peri-implant mucositis and peri-implantitis. Periodontol 2000. 2015;68(1):369-404.
- Ramanauskaite A, Daugela P, Juodzbalys G. Treatment of peri-implantitis: Meta-analysis of findings in a systematic literature review and novel protocol proposal. Quintessence Int. 2016;47(5):379-93.
- Claffey N, Clarke E, Polyzois I, Renvert S. Surgical treatment of peri-implantitis. J Clin Periodontol. 2008;35(S8):316-32.
- Meyle J. Mechanical, chemical and laser treatments of the implant surface in the presence of marginal bone loss around implants. Eur J Oral Implantol. 2012;5(Suppl):S71-81.
- González FJ, et al. Adjuvant effect of titanium brushes in peri-implant surgical treatment: A systematic review. Dent J (Basel). 2021;9(8):84.
- Esposito M, et al. Interventions for replacing missing teeth: Treatment of perimplantitis. Cochrane Database Syst Rev. 2010;6:CD004970.
- Mensi M, et al. Comparison between four different implant surface debridement methods: An in-vitro experimental study. Minerva Stomatol. 2020;69(5):286-94.
- Louropoulou A, Slot DE, van der Weijden F. The effects of mechanical instruments on contaminated titanium dental implant surfaces: A systematic review. Clin Oral Implants Res. 2014;25(10):1149-60.
- Fox SC, Moriarty JD, Kusy RP. The effects of scaling a titanium implant surface with metal and plastic instruments: An in vitro study. J Periodontol. 1990;61(8):485-90.
- Louropoulou A, Slot DE, Van der Weijden F. Influence of mechanical instruments on the biocompatibility of titanium dental implants surfaces: A systematic review. Clin Oral Implants Res. 2015;26(7):841-50.
- Liu CC, et al. Air powder waterjet technology using erythritol or glycine powders in periodontal or peri-implant prophylaxis and therapy: A consensus report of an expert meeting. Clin Exp Dent Res. 2024;10(1):e855.
- Moharrami M, et al. Effects of air abrasive decontamination on titanium surfaces: A systematic review of in vitro studies. Clin Implant Dent Relat Res. 2019;21(2):398-421.
- Francis S, et al. Titanium surface decontamination: A systematic review of in vitro comparative studies. Int J Oral Maxillofac Implants. 2022;37(1):76-84.
- Steiger-Ronay V, et al. Location of unaccessible implant surface areas during debridement in simulated peri-implantitis therapy. BMC Oral Health. 2017;17(1):137.
- Keim D, et al. In vitro efficacy of three different implant surface decontamination methods in three different defect configurations. Clin Oral Implants Res. 2019;30(6):550-8.
- Sanz-Martín I, et al. Significance of implant design on the efficacy of different peri-implantitis decontamination protocols. Clin Oral Investig. 2021;25(6):3589-97.
- Luengo F, et al. In vitro effect of different implant decontamination methods in three intraosseous defect configurations. Clin Oral Implants Res. 2022;33(11):1087-97.
- Korello K, et al. In vitro efficacy of non-surgical and surgical implant surface decontamination methods in three different defect configurations in the presence or absence of a suprastructure. Clin Implant Dent Relat Res. 2023;25(3):549-63.
- Sahrmann P, et al. In vitro cleaning potential of three different implant debridement methods. Clin Oral Implants Res. 2015;26(3):314-9.
- Conserva E, et al. Evaluation of biological response of STRO-1/c-Kit enriched human dental pulp stem cells to titanium surfaces treated with two different cleaning systems. Int J Mol Sci. 2019;20(8):1868.
- Ichioka Y, et al. Mechanical removal of biofilm on titanium discs: An in vitro study. J Biomed Mater Res B Appl Biomater. 2022;110(5):1044-55.
- Khan SN, Koldsland OC, Tiainen H, Hjortsjö C. Anatomical three-dimensional model with peri-implant defect for in vitro assessment of dental implant decontamination. Clin Exp Dent Res. 2024;10(1):e841.
- Krithikadatta J, Gopikrishna V, Datta M. CRIS Guidelines (Checklist for Reporting In-vitro Studies): A concept note on the need for standardized guidelines for improving quality and transparency in reporting in-vitro studies in experimental dental research. J Conserv Dent. 2014;17(4):301.
- Ozgu I, Ustun K. Effects of mechanical methods used in peri-implantitis treatment on implant surface decontamination and roughness. J Vis Exp. 2025;217:67778.
- Monje A, et al. Morphology and severity of peri-implantitis bone defects. Clin Implant Dent Relat Res. 2019;21(4):635-43.
- Heitz-Mayfield LJA, Mombelli A. The therapy of peri-implantitis: A systematic review. Int J Oral Maxillofac Implants. 2014;29(Suppl):325-45.
- Tuchscheerer V, et al. In vitro surgical and non-surgical air-polishing efficacy for implant surface decontamination in three different defect configurations. Clin Oral Investig. 2021;25(5):2819-28.
- Matsubara VH, et al. Cleaning potential of different air abrasive powders and their impact on implant surface roughness. Clin Implant Dent Relat Res. 2020;22(1):96-104.
- Wei MCT, Tran C, Meredith N, Walsh LJ. Effectiveness of implant surface debridement using particle beams at differing air pressures. Clin Exp Dent Res. 2017;3(4):148-53.
- Pujarern P, et al. Efficacy of biofilm removal on the dental implant surface by sodium bicarbonate and erythritol powder airflow system. Eur J Dent. 2024;18(4):1022-9.
- De Lauretis A, et al. Surface-specific outcomes of mechanical debridement with titanium, chitosan and nitinol brushes on titanium dental implant surfaces. J Dent. 2025;162:106010.
- Lollobrigida M, et al. The prevention of implant surface alterations in the treatment of peri-implantitis: Comparison of three different mechanical and physical treatments. Int J Environ Res Public Health. 2020;17(8):2624.
- Jiao Y, Tay FR, Niu L-N, Chen J-H. Advancing antimicrobial strategies for managing oral biofilm infections. Int J Oral Sci. 2019;11(3):28.
- Tang K, et al. The integration of peri-implant soft tissues around zirconia abutments: Challenges and strategies. Bioact Mater. 2023;25:348-61.