This study combines paired human tissues, two lung squamous cell carcinoma cell lines, RNA and protein stability assays, genetic rescue experiments, and a FOXD1-knockdown xenograft model to examine METTL3-associated FOXD1 regulation and provide a reproducible framework for investigating post-transcriptional oncogenic mechanisms.
Research Article
METTL3-Associated FOXD1 Regulation Promotes Lung Squamous Cell Carcinoma Progression: A Multimodel Experimental Approach
* These authors contributed equally
In This Article
Summary
Abstract
Lung squamous cell carcinoma (LUSC) has limited treatment options, motivating investigation of molecular pathways that support tumor-cell growth. Forkhead box D1 (FOXD1) expression was assessed using gene expression profiling interactive analysis (GEPIA), quantitative reverse-transcription polymerase chain reaction (qRT-PCR), western blotting, and immunohistochemistry in paired tissues and cell lines. FOXD1 or methyltransferase-like 3 (METTL3) was depleted in LUSC cells, and cell viability, apoptosis, migration, global N6-methyladenosine (m6A), transcript stability, and protein stability were evaluated. A FOXD1-knockdown xenograft model tested the in vivo role of FOXD1; METTL3 was not manipulated in animals.
FOXD1 expression was higher in LUSC tissues and cells than in corresponding controls. FOXD1 knockdown reduced viability and migration, increased apoptosis, and suppressed xenograft growth. METTL3 expression correlated with FOXD1 in paired LUSC tissues. In cultured cells, METTL3 knockdown lowered global m6A and FOXD1 abundance, whereas FOXD1 re-expression partially rescued the associated phenotypes. Actinomycin D, cycloheximide, and MG132 assays were consistent with METTL3-associated changes in FOXD1 RNA and protein stability.
These data support a functional association between METTL3 and FOXD1 in LUSC cells. In vivo, FOXD1 knockdown suppressed xenograft growth and reduced Ki-67 staining, establishing FOXD1 as a promoter of xenograft growth. Direct METTL3–FOXD1 binding, site-specific m6A modification, reader dependence, and in vivo validation of the complete METTL3–FOXD1 pathway remain to be established.
Introduction
Lung cancer remains a leading cause of cancer mortality worldwide1,2. Lung squamous cell carcinoma (LUSC), a major histologic subtype of non-small cell lung cancer (NSCLC), often presents after curative local treatment is no longer feasible3,4. Systemic treatment has improved, but many patients still experience poor outcomes5. Defining molecular programs that sustain LUSC growth may therefore reveal testable biomarkers and therapeutic hypotheses.
Forkhead box D1 (FOXD1) is a transcription factor implicated in colorectal, head and neck, gastric, oral squamous, and breast cancers6,7,8,9,10. In NSCLC, FOXD1 expression has been associated with adverse outcome and with experimental cell growth and metastasis11,12. MicroRNA-30a-5p also suppresses LUSC-cell proliferation and migration by targeting FOXD113. These observations identify FOXD1 as a plausible LUSC regulator, but they do not establish how its expression is maintained in this disease.
N6-methyladenosine (m6A) is a reversible RNA modification installed, removed, and interpreted by writer, eraser, and reader proteins. This regulatory system can influence RNA processing, translation, and decay, and its disruption has been linked to malignant phenotypes and treatment response14,15,16,17. Methyltransferase-like 3 (METTL3) is a catalytic component of the m6A writer complex; however, a correlation between METTL3 and FOXD1 alone cannot demonstrate direct methylation or reader-mediated regulation.
We hypothesized that METTL3 promotes LUSC progression by sustaining FOXD1 expression through m6A-associated post-transcriptional regulation. By integrating paired clinical specimens, two tumor cell lines, loss-of-function and rescue assays, transcript and protein stability analyses, and a FOXD1-knockdown xenograft model, this study provides a functional framework for investigating the METTL3–FOXD1 relationship while distinguishing association from direct site-specific methylation.
Protocol
Human tissue collection was conducted in accordance with the Declaration of Helsinki and was approved by the Institutional Review Board of the First Hospital of Jilin University (approval no. 2022-339; July 22, 2022), and written informed consent was obtained from all participants. The animal protocol was approved by the Animal Management Committee of the First Hospital of Jilin University (approval no. 2022-0015; January 25, 2022) and was conducted in accordance with institutional guidelines for animal care and use.
Study subjects
Archived specimens comprised 12 paired primary LUSC and adjacent non-tumor tissues collected from patients who underwent surgery between January 2019 and December 2020. Eligible patients had pathologically confirmed primary LUSC, no documented metastasis, and no LUSC-directed treatment during the preceding 6 months. Cases were selected with a random-number table and included seven men and five women aged 30–65 years. Written informed consent was obtained from all participants.
Cell lines
Human bronchial epithelial BEAS-2B cells (RRID: CVCL_0168), LUSC SK-MES-1 (RRID: CVCL_0630), and NCI-H226 cells (RRID: CVCL_1544) were obtained from the Cell Bank of the Chinese Academy of Sciences. Cells were maintained in Dulbecco's modified Eagle medium containing 10% fetal bovine serum and 1% penicillin–streptomycin at 37 °C in 5% CO2. Commercial identifiers are consolidated in the accompanying Table of Materials.
Small interfering RNA screening and rescue
Three individual small interfering RNAs targeting FOXD1 or METTL3 were screened in SK-MES-1 and NCI-H226 cells. Knockdown was assessed 48 h after transfection by quantitative reverse transcription PCR (qRT-PCR) and western blotting. FOXD1 siRNA-1 was used for downstream FOXD1 functional assays because it produced the greatest reduction in both cell lines. Downstream METTL3 experiments used the selected screen-derived si-METTL3 reagent. The archived record does not identify a SmartPool or preserve a sequence or vendor identifier that can be assigned with confidence. For rescue experiments, cells received the selected si-METTL3 reagent, the FOXD1 overexpression construct, or both; expression and cellular phenotypes were assessed 48 h after transfection.
RNA isolation and qRT-PCR
Total RNA was isolated from tissues or cells with a phenol–guanidinium reagent and reverse transcribed using a commercial reverse-transcription kit. qRT-PCR was performed with a TB Green master mix on a real-time PCR system (RRID: SCR_018051). Primer sequences are provided in Table 1. Relative expression was normalized to glyceraldehyde 3-phosphate dehydrogenase (GAPDH). Reaction assembly and thermal cycling followed the manufacturer's protocol for the listed master mix.
Western blotting
Tissues or cells were lysed in radioimmunoprecipitation assay (RIPA) buffer containing protease inhibitors. Equivalent protein amounts were separated by sodium dodecyl sulfate–polyacrylamide gel electrophoresis (SDS-PAGE) and transferred to polyvinylidene fluoride (PVDF) membranes. Membranes were incubated overnight at 4 °C with antibodies against FOXD1 (1:1,000), METTL3 (1:1,000; RRID: AB_2142033), or GAPDH (1:2,000; RRID: AB_10622025), followed by horseradish peroxidase–conjugated anti-rabbit immunoglobulin G for 1 h at room temperature. Signals were developed by enhanced chemiluminescence, with GAPDH as the loading control. The Table of Materials identifies the commercial primary antibodies and records the secondary reagent as an anti-rabbit immunoglobulin G detection antibody.
Cell viability and apoptosis
For viability measurements, control and transfected LUSC cells were seeded in 96-well plates at 2,000 cells per well. At 12-h intervals, 10 µL of cell counting kit-8 reagent was added per well, plates were incubated for 1 h at 37 °C, and absorbance was recorded at 450 nm. For apoptosis analysis, 1 × 10⁵ cells per well were seeded in 6-well plates and analyzed 48 h after transfection. Harvested cells were processed according to the Annexin V–fluorescein isothiocyanate (FITC)/ propidium iodide (PI) kit instructions, resuspended in 100 µL of binding buffer, stained with 5 µL of each reagent for 30 min at room temperature in the dark, and analyzed by flow cytometry within 4 h.
Transwell migration
Transfected LUSC cells were placed in serum-free medium in the upper transwell chamber; the lower chamber contained 500 µL of medium supplemented with 10% fetal bovine serum. After 24 h, migrated cells were fixed with 4% paraformaldehyde and stained with crystal violet for 10 min. Non-migrated cells on the upper membrane surface were removed with a cotton swab. Migrated cells were imaged with a microscope under identical acquisition settings and quantified with ImageJ (RRID: SCR_003070).
m6A methylation modification
Global m6A abundance was measured with a colorimetric RNA methylation assay. After RNA extraction and quality assessment, 200 ng of RNA was applied to each assay well. Capture antibody (50 µL) was added for 60 min at room temperature. Wells were washed three times, incubated with 50 µL detection antibody for 30 min, washed four times, and incubated with signal-enhancement solution for 30 min. Absorbance was measured at 450 nm. All steps followed the listed kit instructions.
mRNA stability detection
LUSC cells were seeded in 6-well plates and transfected with negative-control small interfering RNA (si-NC) or METTL3-targeting small interfering RNA (si-METTL3). At 48 h, actinomycin D was added to 5 µg/mL to stop transcription. Cells were collected at 0 h, 2 h, 4 h, and 6 h, total RNA was isolated, and FOXD1 transcript abundance was measured by qRT-PCR.
Cycloheximide (CHX) and MG132 assays
For each inhibitor endpoint assay, untreated vector-control cells, inhibitor-treated vector-control cells, and inhibitor-treated METTL3-overexpressing cells were compared. MG132 was used at 10 µM, and CHX at 20 µM; lysates were collected after 12 h for western blotting. For the CHX time course, si-NC- or si-METTL3-transfected cells were treated with 20 µM CHX and collected at 0 h, 3 h, 6 h, and 9 h. FOXD1 protein abundance was measured by western blotting.
In vivo experiments
Five-week-old athymic BALB/c nude mice were assigned to negative-control and FOXD1-knockdown SK-MES-1 groups (n = 8 mice per group). Each mouse received a subcutaneous injection of approximately 8 × 10⁶ cells. Tumor monitoring began 1 week after implantation; tumor size was recorded every 4 days for 20 consecutive days. Mice were euthanized using approved institutional protocols on day 27 after inoculation, immediately after the final measurement, and tumors were excised, weighed, and photographed. Stable FOXD1-knockdown and matched negative-control SK-MES-1 cell populations were used for implantation.
Immunochemistry
Excised tumors were paraffin-embedded and sectioned at 4–5 µm. Sections were deparaffinized, rehydrated, incubated overnight at 4 °C with primary antibody, and then incubated with the appropriate secondary antibody for 30 min. Antigen-positive cells were visualized with a diaminobenzidine substrate. FOXD1 and Ki-67 were evaluated in the xenografts, with paired sections processed in the same staining batch and imaged under identical acquisition settings.
Statistical analysis
Analyses were performed with GraphPad Prism version 8 (RRID: SCR_002798) and R (RRID: SCR_001905). Two-group comparisons used Student's t-test, and comparisons involving more than two groups used analysis of variance. Paired human-tissue analyses used 12 patient pairs; in vitro summaries represent three independent biological experiments; xenograft analyses used eight mice per group. Technical replicates were not treated as independent observations. Data are presented as mean ± standard deviation. A two-sided P < 0.05 was considered statistically significant.
Results
FOXD1 expression is elevated in human LUSC tissues
A gene expression profiling interactive analysis (GEPIA) query showed higher FOXD1 transcript abundance in LUSC than in normal lung samples, whereas the lung adenocarcinoma comparison did not reach significance (Figure 1A). Analysis of 12 paired LUSC and adjacent non-tumor tissues yielded the same direction of change by qRT-PCR and western blotting (Figure 1B,C). Immunohistochemical staining also showed a stronger FOXD1 signal in tumor sections than in paired adjacent tissue (Figure 1D).
FOXD1 knockdown reduces viability and migration and increases apoptosis in LUSC cells
FOXD1 transcript abundance was greater in SK-MES-1 and NCI-H226 cells than in BEAS-2B cells (Figure 2A). Three FOXD1-targeting small interfering RNAs were screened; siRNA-1 produced the largest reduction detected by qRT-PCR and western blotting and was selected for subsequent assays (Figure 2B,C). Relative to the negative control, FOXD1 knockdown reduced Cell Counting Kit-8 signal (Figure 2D), increased Annexin V–positive cells (Figure 2E), and decreased Transwell migration (Figure 2F) in both LUSC cell lines. A single selected reagent was carried forward, so the functional results do not constitute sequence-independent exclusion of off-target effects.
METTL3 expression correlates with FOXD1 in LUSC samples
m6A methylation is a dynamic and reversible chemical modification widely present in eukaryotes, which is regulated by methyltransferases and demethylases, and is recognized and processed by m6A-binding proteins18. Global m6A signal was higher in the 12 LUSC tissues than in paired adjacent tissues and was also higher in both LUSC cell lines than in BEAS-2B cells (Figure 3A). Transcripts encoding METTL3, METTL14, WTAP, and RBM15 were increased in the paired tumor samples (Figure 3B). Across GEPIA data and the 12-tumor set, FOXD1 showed its clearest positive association with METTL3; the association with RBM15 was weaker (Figure 3C,D). Western blotting further showed higher METTL3 abundance in tumor tissues (Figure 3E). These analyses establish co-variation, not direct regulation.
METTL3 knockdown alters FOXD1 abundance and LUSC-cell phenotypes
Three METTL3-targeting small interfering RNAs were screened in SK-MES-1 and NCI-H226 cells by qRT-PCR and western blotting (Figure 4A,B). METTL3 knockdown lowered the global m6A signal (Figure 4C). FOXD1 overexpression increased FOXD1 without increasing METTL3 (Figure 4D), and the four-group rescue experiment confirmed lower FOXD1 abundance after METTL3 knockdown and its restoration by the FOXD1 construct (Figure 4E,F). METTL3 knockdown reduced viability and migration and increased apoptosis; FOXD1 re-expression partially opposed these changes (Figure 4G–I). Thus, the rescue data are consistent with FOXD1 acting downstream of METTL3 in cultured cells.
METTL3 perturbation is associated with FOXD1 RNA and protein stability
Growing evidence suggests that m6A mRNA modification modulates various aspects of the mRNA cycle, including pre-mRNA splicing, translation, nucleocytoplasmic export, decay, and splicing19,20. SRAMP identified candidate m6A motifs in FOXD1 RNA, and m6A2Target listed METTL3 as a predicted FOXD1-associated writer in H1299 cells (Figure 5A,B). These database outputs are hypothesis-generating and do not demonstrate binding or site-specific methylation in LUSC cells. Following transcriptional blockade with actinomycin D, FOXD1 RNA declined more rapidly after METTL3 knockdown than in control cells (Figure 5C). FOXD1 abundance was higher in MG132-treated METTL3-overexpressing cells than in MG132-treated vector controls, whereas this pattern was not observed after CHX treatment (Figure 5D,E). The CHX time course showed faster loss of FOXD1 protein after METTL3 knockdown (Figure 5F). Collectively, these assays are consistent with METTL3-associated changes in FOXD1 RNA and protein stability but do not identify the modified adenosine, demonstrate direct binding, or define an m6A reader.
FOXD1 knockdown suppresses LUSC xenograft growth
To test FOXD1 function in vivo, control and FOXD1-knockdown SK-MES-1 cells were implanted subcutaneously in nude mice (n = 8 per group). Beginning 1 week after implantation, tumors were measured every 4 days for 20 days and were collected on day 27 after inoculation. Excised tumors were smaller in the FOXD1-knockdown group (Figure 6A), their growth curves rose more slowly (Figure 6B), and their final weights were lower (Figure 6C). FOXD1 and Ki-67 staining was also reduced in the knockdown tumors (Figure 6D). These experiments evaluate FOXD1 knockdown only; they do not test METTL3 inhibition in vivo.
Taken together, FOXD1 was overexpressed in lung squamous cell carcinoma tissues and cells and supported proliferation, migration, and xenograft growth. METTL3 knockdown reduced global m6A levels, decreased FOXD1 expression, and impaired malignant cellular phenotypes, whereas FOXD1 re-expression partially reversed these effects. The stability assays support METTL3-associated post-transcriptional regulation of FOXD1 but do not establish direct site-specific methylation or in vivo rescue of the complete pathway. The study design is summarized in Figure 7.
DATA AVAILABILITY:
All data analyzed in this study are included in the article and its figures. De-identified numerical data underlying the reported summaries are available from the corresponding author on reasonable request, subject to institutional governance and participant-protection requirements. No simulation files or custom analysis code were used.
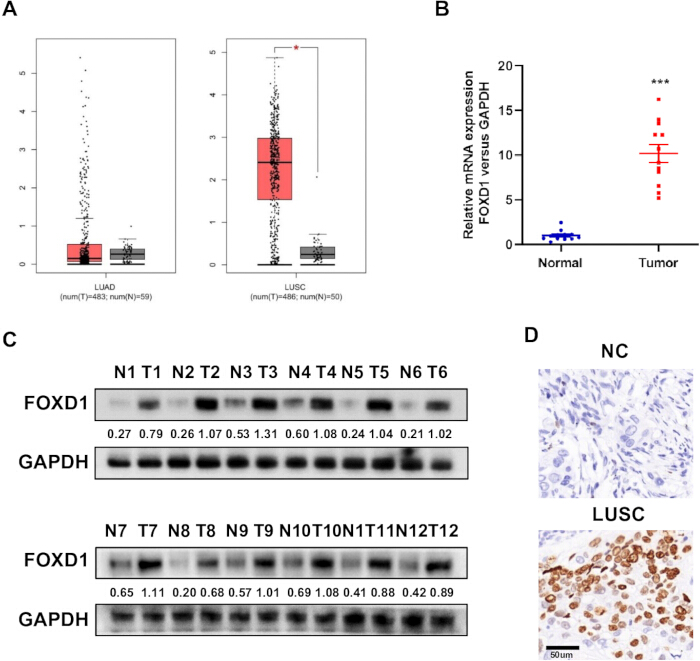
Figure 1: FOXD1 expression in human lung cancer samples. (A) GEPIA comparison of FOXD1 transcript abundance in lung adenocarcinoma (LUAD) and lung squamous cell carcinoma (LUSC) versus normal lung samples. (B) FOXD1 transcript abundance in 12 paired LUSC and adjacent non-tumor tissues. (C) FOXD1 protein abundance in the same paired tissues. (D) Representative FOXD1 immunohistochemistry. Human tissue n = 12 pairs; in vitro-style technical repetition does not change the patient-level n. Scale bar in panel D = 50 µm. ***P < 0.001. Please click here to view a larger version of this figure.
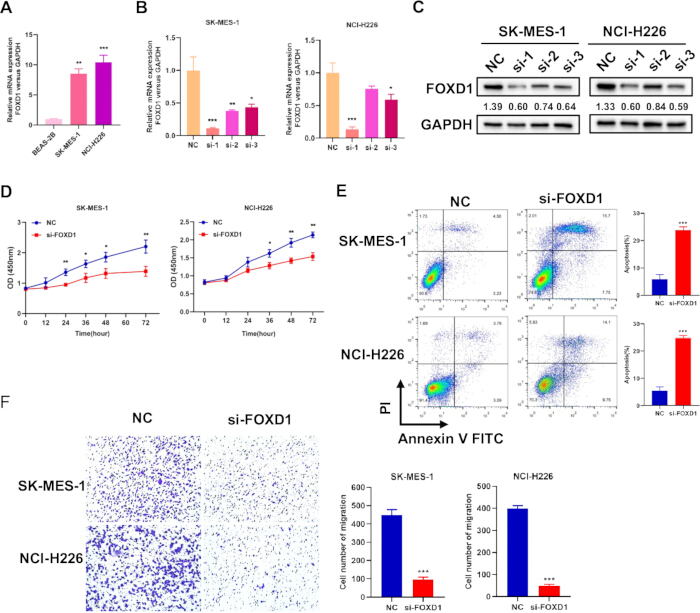
Figure 2: Effects of FOXD1 knockdown in SK-MES-1 and NCI-H226 cells. (A) FOXD1 transcript abundance in BEAS-2B, SK-MES-1, and NCI-H226 cells. (B) qRT-PCR screening of three FOXD1-targeting small interfering RNAs 48 h after transfection. (C) Western-blot screening of the same three FOXD1-targeting small interfering RNAs. (D) Cell counting kit-8 assay after FOXD1 knockdown. (E) Annexin V–fluorescein isothiocyanate/propidium iodide apoptosis analysis at 48 h. (F) Transwell migration measured 24 h after seeding transfected cells; the archived field-of-view images are presented without a retrospective scale bar because calibration metadata were unavailable. Three independent biological experiments were performed. *P < 0.05; **P < 0.01; ***P < 0.001. Please click here to view a larger version of this figure.
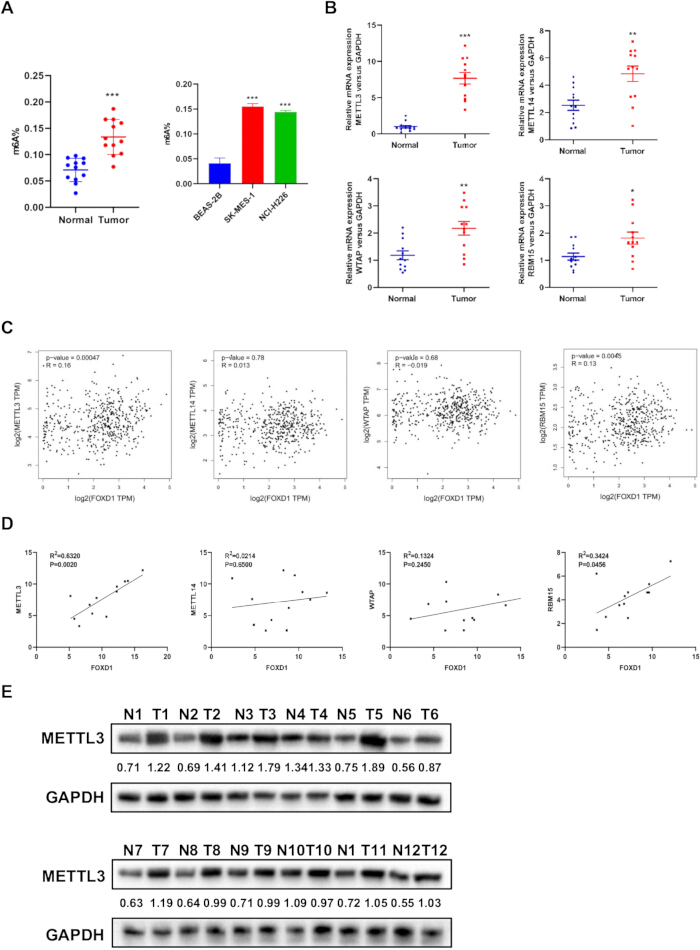
Figure 3: Global N6-methyladenosine and the association between METTL3 and FOXD1. (A) Global m6A signal in paired tissues and in BEAS-2B, SK-MES-1, and NCI-H226 cells. (B) METTL3, METTL14, WTAP, and RBM15 transcripts in 12 paired LUSC and adjacent tissues. (C) GEPIA correlations between FOXD1 and each writer. (D) Correlations between FOXD1 and writer transcripts in 12 LUSC tumors. (E) METTL3 protein in paired LUSC and adjacent tissues. Human-tissue n = 12 pairs; cell assays represent three independent biological experiments. *P < 0.05; **P < 0.01; ***P < 0.001. Please click here to view a larger version of this figure.
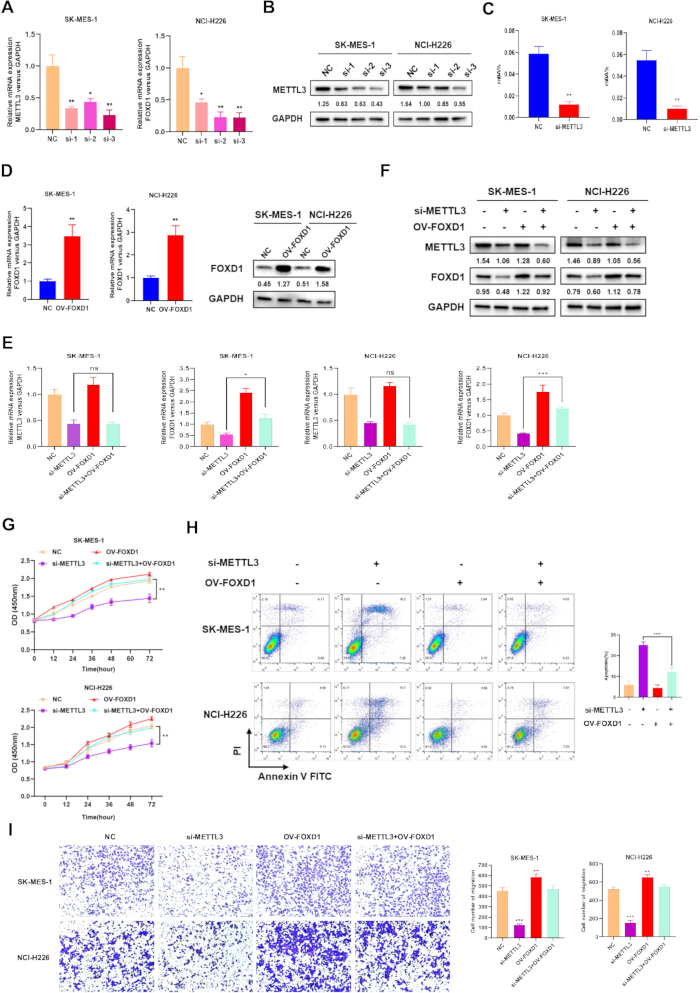
Figure 4: METTL3 knockdown, FOXD1 rescue, and LUSC-cell phenotypes. (A) qRT-PCR screening of three METTL3-targeting small interfering RNAs 48 h after transfection. (B) Western-blot screening of the same three METTL3-targeting small interfering RNAs. (C) Global m6A signal after METTL3 knockdown. (D) FOXD1 transcript and protein abundance after FOXD1 overexpression. (E) METTL3 and FOXD1 transcript abundance in control, si-METTL3, ov-FOXD1, and combined si-METTL3 + ov-FOXD1 conditions measured by qRT-PCR. (F) METTL3 and FOXD1 protein abundance in the same rescue groups measured by western blotting. (G) Cell Counting Kit-8 assay. (H) Apoptosis by flow cytometry. (I) Transwell migration. Three independent biological experiments were performed. Numbers below western-blot bands indicate normalized target-protein/GAPDH ratios. ns, not significant; *P < 0.05; **P < 0.01; ***P < 0.001. Please click here to view a larger version of this figure.
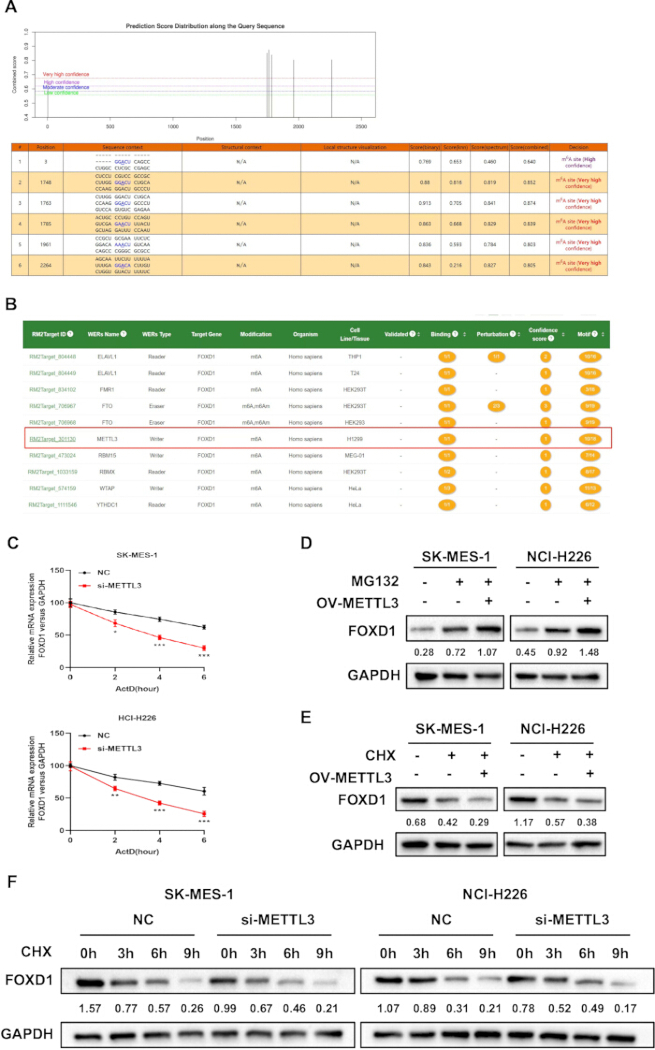
Figure 5: METTL3 is associated with FOXD1 transcript and protein regulation. (A) SRAMP-predicted N6-methyladenosine sites within the FOXD1 transcript. (B) m6A2Target prediction identifying METTL3 as a candidate writer associated with FOXD1. (C) Relative FOXD1 mRNA abundance after actinomycin D treatment at 5 µg/mL in negative-control and METTL3-knockdown cells at 0 h, 2 h, 4 h, and 6 h. (D) FOXD1 protein abundance in untreated vector-control cells, MG132-treated vector-control cells, and MG132-treated METTL3-overexpressing cells (10 µM MG132). (E) FOXD1 protein abundance in untreated vector-control cells, CHX-treated vector-control cells, and CHX-treated METTL3-overexpressing cells (20 µM CHX). (F) FOXD1 protein expression after CHX treatment at 20 µM for 0 h, 3 h, 6 h, and 9 h in negative-control and METTL3-knockdown cells. GAPDH served as the loading control. Cell experiments were performed in three independent biological replicates. The blots shown are representative; numbers below the bands indicate normalized FOXD1/GAPDH ratios. *P < 0.05; **P < 0.01; ***P < 0.001. Please click here to view a larger version of this figure.
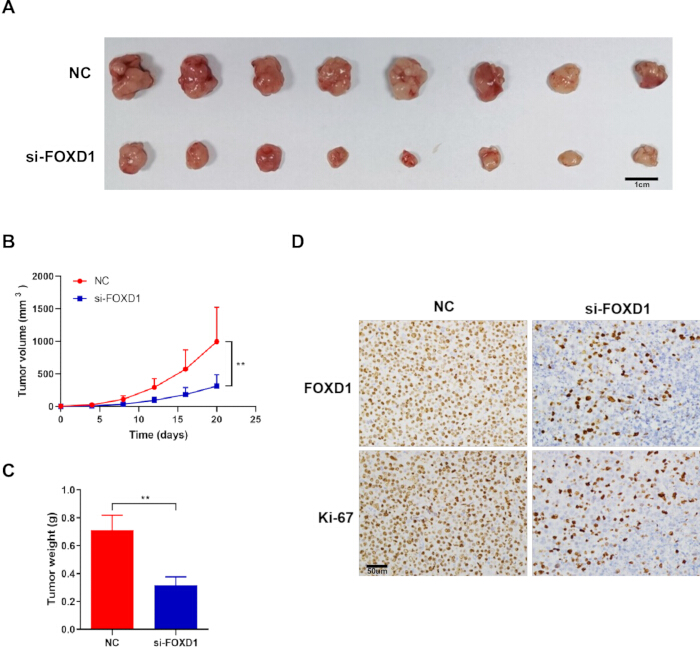
Figure 6: FOXD1 knockdown suppresses SK-MES-1 xenograft growth. (A) Excised tumors from negative-control and FOXD1-knockdown groups; scale bar = 1 cm. (B) Tumor growth measured every 4 days for 20 days, beginning 1 week after implantation, with collection on day 27 after inoculation. (C) Tumor weight at collection. (D) Representative FOXD1 and Ki-67 immunohistochemistry in xenograft tissue; scale bar = 50 µm. n = 8 mice per group; **P < 0.01. Please click here to view a larger version of this figure.
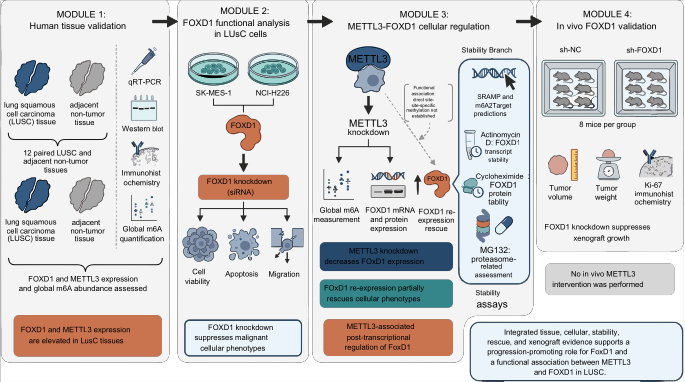
Figure 7: Overall study design and evidence boundary. Paired LUSC tissues (n = 12 pairs) and cell lines were used for FOXD1, METTL3, and global m6A profiling; genetic perturbation and rescue were followed by viability, apoptosis, migration, and stability assays. A FOXD1-knockdown xenograft model (n = 8 mice per group) was monitored for 20 days. The diagram distinguishes cell-based METTL3 evidence from FOXD1-specific in vivo evidence and identifies direct binding, site-specific m6A, reader identity, and in vivo METTL3 activity as untested. Please click here to view a larger version of this figure.
| Gene | Direction | Sequence (5′–3′) |
| FOXD1 | Forward | TCTGAGTAACGCGTTATGCTT |
| FOXD1 | Reverse | CGGAATCGGACGCAAGTCTT |
| GAPDH | Forward | GGAGCGAGATCCCTCCAAAAT |
| GAPDH | Reverse | GGCTGTTGTCATACTTCTCATGG |
| METTL14 | Forward | CTGAAAGTGCCGACAGCATTGG |
| METTL14 | Reverse | CTCTCCTTCATCCAGATACTTACG |
| METTL3 | Forward | CCAGCACAGCTTCAGCAGTTCC |
| METTL3 | Reverse | GCGTGGAGATGGCAAGACAGATG |
| RBM15 | Forward | GTTGTGGCTTATGTGGAGTTTAC |
| RBM15 | Reverse | CACTTAAAACACCGGCATTGG |
| WTAP | Forward | GCAACAACAGCAGGAGTCTGCA |
| WTAP | Reverse | CTGCTGGACTTGCTTGAGGTAC |
Table 1: Quantitative reverse-transcription polymerase chain reaction primer sequences. Sequences are reported in the 5′–3′ direction.
Discussion
The present workflow supports a role for FOXD1 in LUSC across paired tissues, two cell lines, and a xenograft model. FOXD1 was higher in tumor specimens and LUSC cells, and its depletion reduced viability and migration while increasing apoptosis. These findings align with reports linking FOXD1 to growth, invasion, therapy resistance, and adverse outcomes in several cancers 10,11,12,13,21,22,23,24,25,26,27,28. They also extend prior LUSC observations by connecting cell-based phenotypes with a FOXD1-knockdown xenograft experiment.
The paired-tissue and cell analyses further linked FOXD1 abundance with METTL3 and global m6A. Four writer genes were elevated in the 12 tumor pairs, but METTL3 showed the strongest positive association with FOXD1. In cultured cells, METTL3 depletion reduced global m6A and FOXD1 abundance, and FOXD1 re-expression partially rescued the associated viability, apoptosis, and migration phenotypes. These data support a METTL3-FOXD1 functional relationship in the tested cells, consistent with the broad influence of m6A regulation on malignant phenotypes29,30,31,32,33,34,35,36.
Several protocol points are important for reproducibility. Knockdown efficiency should be confirmed in each cell line before functional assays, and rescue conditions should verify FOXD1 restoration without interpreting the construct as METTL3 overexpression. Actinomycin D, CHX, and MG132 treatments must use the concentrations and sampling times stated in the protocol. Cell density, serum gradient, and a consistent imaging field should be controlled in Transwell assays. If an investigator adapts the workflow, stable short hairpin RNA or genome editing may be preferable for long-duration in vivo experiments, but those alternatives require independent validation.
The study has several limitations. The human cohort comprised 12 paired samples and was not designed for outcome modeling. Only one selected small interfering RNA was carried into functional assays, so sequence-independent off-target validation was not achieved. Western-blot interpretation is restricted to the normalized values shown in the figures; post hoc inferential testing was not performed. SRAMP and m6A2Target predictions, global m6A measurements, and stability assays do not substitute for RNA immunoprecipitation, methylated RNA immunoprecipitation, site-directed mutagenesis, or reader-specific rescue. METTL3 was not perturbed in vivo, so the xenograft data cannot support an in vivo METTL3 claim.
Future studies should test pharmacological METTL3 inhibition, map FOXD1-associated m6A sites and direct binding, identify the relevant reader protein, and repeat the rescue strategy in vivo. A larger, independently annotated cohort would also be required to assess clinical outcomes. Within its present scope, the study supports FOXD1 as a functional LUSC regulator and provides cell-based evidence that METTL3 influences FOXD1 abundance; it does not establish a complete METTL3-m6A-reader-FOXD1 pathway.
Disclosures
The authors declare that they have no conflict of interest.
Author Contributions:
D.A. and Q.D. contributed to data collection and clinical information acquisition. K.W. and S.F. performed molecular biology experiments and data analysis. L.G. participated in study design and data interpretation. H.Z. conducted statistical analysis and assisted with data validation. Y.S. carried out animal experiments and immunohistochemical analysis. Q.P. contributed to migration assays and experimental resources. G.L. conceived and supervised the study and drafted the manuscript. All authors reviewed, revised, and approved the manuscript.
Acknowledgements
The authors thank Zhe Tang and Yan Zhang for technical assistance with quantitative polymerase chain reaction and western blotting, respectively, and Yang Li for assistance with cell viability and apoptosis assays. This research was funded by the Natural Science Foundation of Tibet Autonomous Region (No. XZ202001ZR0040G).
Materials
| Name | Company | Catalog Number | Comments |
|---|---|---|---|
| 7500 Fast Real-Time PCR System | Applied Biosystems | 7500 Fast | qRT-PCR (RRID: SCR_018051) |
| Actinomycin D | Sigma-Aldrich | SBR00013 | RNA-stability assay, 5 µg/mL |
| Annexin V-FITC/PI apoptosis kit | BD Biosciences | 556547 | Flow-cytometric apoptosis |
| Athymic BALB/c nude mice | N/A | N/A | Subcutaneous xenograft |
| BEAS-2B | Chinese Academy of Sciences Cell Bank | https://www.cellosaurus.org/CVCL_0168 | Non-tumor bronchial epithelial reference; RRID: CVCL_0168 |
| Cell Counting Kit-8 | Beyotime | C0037 | Cell viability |
| Crystal violet | N/A | N/A | Transwell staining, 10 min |
| Cycloheximide | MedChemExpress | HY-12320 | Protein-stability assays, 20 µM |
| DAB substrate kit | N/A | N/A | Immunohistochemistry visualization |
| Dulbecco's modified Eagle medium | Gibco | 11995065 | Cell culture |
| Enhanced chemiluminescence reagent | Thermo Fisher Scientific | A38556 | Western-blot detection |
| Fetal bovine serum | Gibco | 10091148 | Cell culture, 10% |
| Flow cytometer | N/A | N/A | Apoptosis measurement |
| FOXD1 antibody | Thermo Fisher Scientific | PA5-27142 | Western blot, 1:1,000; immunohistochemistry |
| FOXD1 overexpression construct | N/A | N/A | FOXD1 rescue |
| GAPDH antibody | Cell Signaling Technology | 5174 | Western-blot loading control, 1:2,000 (RRID: AB_10622025) |
| GEPIA | Peking University | http://gepia.cancer-pku.cn/ | Expression and correlation queries; RRID: SCR_018294 |
| GraphPad Prism | GraphPad Software | Version 8 | Statistical analysis; RRID: SCR_002798 |
| Horseradish peroxidase-conjugated anti-rabbit immunoglobulin G | N/A | N/A | Western blot, 1 h at room temperature |
| ImageJ | National Institutes of Health | https://imagej.nih.gov/ij/ | Migration-image quantification; RRID: SCR_003070 |
| Ki-67 antibody | N/A | N/A | Xenograft immunohistochemistry |
| m6A2Target | Web resource | http://m6a2target.canceromics.org/ | Predicted m6A regulator-target association |
| Methyltransferase-like 3 antibody | Proteintech | 15073-1-AP | Western blot, 1:1,000; RRID: AB_2142033 |
| MG132 | MedChemExpress | HY-13259 | Proteasome-inhibition assay, 10 µM |
| N6-methyladenosine colorimetric assay | Epigentek | P-9005-96 | Global m6A measurement |
| NCI-H226 | Chinese Academy of Sciences Cell Bank | https://www.cellosaurus.org/CVCL_1544 | LUSC cell model; RRID: CVCL_1544 |
| Olympus microscope | Olympus | Model not recorded | Transwell imaging |
| Penicillin-streptomycin | Gibco | 10378016 | Cell culture, 1% |
| Polyvinylidene fluoride membrane | Merck | IPVH00010 | Western-blot transfer |
| PrimeScript reverse-transcription reagent kit | Takara | RR037A | Complementary DNA synthesis |
| R Project for Statistical Computing | R Foundation | https://www.r-project.org/ | Statistical analysis; RRID: SCR_001905 |
| Radioimmunoprecipitation assay lysis buffer | Beyotime | P0013B | Protein extraction |
| RNAiso Plus | Takara | 9108 | RNA extraction |
| siRNA reagents | N/A | N/A | FOXD1 and METTL3 knockdown; siRNA-1 selected |
| SK-MES-1 | Chinese Academy of Sciences Cell Bank | https://www.cellosaurus.org/CVCL_0630 | LUSC cell and xenograft model; RRID: CVCL_0630 |
| SRAMP | Web resource | http://www.cuilab.cn/sramp | Candidate FOXD1 m6A-site prediction |
| TB Green PCR master mix | Takara | RR820A | qRT-PCR |
| Transfection reagent | N/A | N/A | siRNA and plasmid delivery |
| Transwell inserts | N/A | N/A | Migration assay |
References
- Li MY, Liu LZ, Dong M. Progress on pivotal role and application of exosome in lung cancer carcinogenesis, diagnosis, therapy and prognosis. Mol Cancer. 2021;20(1):22.
- Hirsch FR, et al. Lung cancer: current therapies and new targeted treatments. Lancet. 2017;389(10066):299-311.
- Li Y, et al. Transcriptomic and functional network features of lung squamous cell carcinoma through integrative analysis of GEO and TCGA data. Sci Rep. 2018;8(1):15834.
- Fu L, et al. The value of CEP55 gene as a diagnostic biomarker and independent prognostic factor in LUAD and LUSC. PLoS One. 2020;15(5):e0233283.
- Chen TJ, et al. MicroRNA-665 facilitates cell proliferation and represses apoptosis through modulating Wnt5a/β-catenin and Caspase-3 signaling pathways by targeting TRIM8 in LUSC. Cancer Cell Int. 2021;21(1):215.
- Chen C, et al. CXCL5 induces tumor angiogenesis via enhancing the expression of FOXD1 mediated by the AKT/NF-κB pathway in colorectal cancer. Cell Death Dis. 2019;10(3):178.
- Wu Q, et al. FOXD1-AS1 regulates FOXD1 translation and promotes gastric cancer progression and chemoresistance by activating the PI3K/AKT/mTOR pathway. Mol Oncol. 2021;15(1):299-316.
- Chen Y, Liang W, Liu K, Shang Z. FOXD1 promotes EMT and cell stemness of oral squamous cell carcinoma by transcriptional activation of SNAI2. Cell Biosci. 2021;11(1):154.
- Liang H, et al. FOXD1 is a prognostic biomarker and correlated with macrophages infiltration in head and neck squamous cell carcinoma. Biosci Rep. 2021;41(7):BSR20202929.
- Zhao YF, et al. FOXD1 promotes breast cancer proliferation and chemotherapeutic drug resistance by targeting p27. Biochem Biophys Res Commun. 2015;456(1):232-7.
- Nakayama S, et al. FOXD1 expression is associated with poor prognosis in non-small cell lung cancer. Anticancer Res. 2015;35(1):261-8.
- Li D, et al. FOXD1 promotes cell growth and metastasis by activation of vimentin in NSCLC. Cell Physiol Biochem. 2018;51(6):2716-2731.
- Chen C, et al. miR-30a-5p inhibits proliferation and migration of lung squamous cell carcinoma cells by targeting FOXD1. Biomed Res Int. 2020;2020:2547902.
- Chen XY, Zhang J, Zhu JS. The role of m(6)A RNA methylation in human cancer. Mol Cancer. 2019;18(1):103.
- Jiang X, et al. The role of m6A modification in the biological functions and diseases. Signal Transduct Target Ther. 2021;6(1):74.
- Ma Z, Ji J. N6-methyladenosine (m6A) RNA modification in cancer stem cells. Stem Cells. 2020;38(12):1511-1519.
- Gao R, et al. m6A modification: a double-edged sword in tumor development. Front Oncol. 2021;11:679367.
- He L, et al. Functions of N6-methyladenosine and its role in cancer. Mol Cancer. 2019;18(1):176.
- Sun T, Wu R, Ming L. The role of m6A RNA methylation in cancer. Biomed Pharmacother. 2019;112:108613.
- An Y, Duan H. The role of m6A RNA methylation in cancer metabolism. Mol Cancer. 2022;21(1):14.
- Sack LM, et al. Profound tissue specificity in proliferation control underlies cancer drivers and aneuploidy patterns. Cell. 2018;173(2):499-514.e23.
- Vazquez A, et al. Cancer metabolism at a glance. J Cell Sci. 2016;129(18):3367-73.
- Cai K, et al. FOXD1 facilitates pancreatic cancer cell proliferation, invasion, and metastasis by regulating GLUT1-mediated aerobic glycolysis. Cell Death Dis. 2022;13(9):765.
- Zhou L, et al. Down-regulation of miR-30a-5p is associated with poor prognosis and promotes chemoresistance of gemcitabine in pancreatic ductal adenocarcinoma. J Cancer. 2019;10(21):5031-5040.
- Pan F, Li M, Chen W. FOXD1 predicts prognosis of colorectal cancer patients and promotes colorectal cancer progression via the ERK 1/2 pathway. Am J Transl Res. 2018;10(5):1522-1530.
- Qiu S, et al. Diagnostic and prognostic value of FOXD1 expression in head and neck squamous cell carcinoma. J Cancer. 2021;12(3):693-702.
- Wu T, et al. miR-30e-5p-mediated FOXD1 promotes cell proliferation by blocking cellular senescence and apoptosis through p21/CDK2/Rb signaling in head and neck carcinoma. Cell Death Discov. 2023;9(1):295.
- Sun Q, et al. FOXD1 promotes dedifferentiation and targeted therapy resistance in melanoma by regulating the expression of connective tissue growth factor. Int J Cancer. 2021;149(3):657-674.
- Wang T, Kong S, Tao M, Ju S. The potential role of RNA N6-methyladenosine in cancer progression. Mol Cancer. 2020;19(1):88.
- Zeng C, Huang W, Li Y, Weng H. Roles of METTL3 in cancer: mechanisms and therapeutic targeting. J Hematol Oncol. 2020;13(1):117.
- Haussmann IU, et al. m6A potentiates Sxl alternative pre-mRNA splicing for robust Drosophila sex determination. Nature. 2016;540(7632):301-304.
- Liu N, et al. N(6)-methyladenosine-dependent RNA structural switches regulate RNA-protein interactions. Nature. 2015;518(7540):560-4.
- Kennedy EM, et al. Posttranscriptional m6A editing of HIV-1 mRNAs enhances viral gene expression. Cell Host Microbe. 2016;19(5):675-685.
- Lin S, et al. The m(6)A methyltransferase METTL3 promotes translation in human cancer cells. Mol Cell. 2016;62(3):335-345.
- Han J, et al. METTL3 promote tumor proliferation of bladder cancer by accelerating pri-miR221/222 maturation in m6A-dependent manner. Mol Cancer. 2019;18(1):110.
- Li A, et al. Cytoplasmic m(6)A reader YTHDF3 promotes mRNA translation. Cell Res. 2017;27(3):444-447.