We present a three-dimensional stimulated emission depletion (3D STED) workflow combining uptake assays and pharmacological perturbation to visualize membrane protein trafficking in intact Drosophila wing imaginal discs at near-isotropic super-resolution.
Method Article
Visualizing Protein Trafficking in Whole Tissue Context Using Super-Resolution Nanoscopy in Drosophila
In This Article
Summary
Abstract
The fruit fly Drosophila melanogaster is widely used to study conserved developmental and cellular signaling pathways in vivo. Many signaling pathways, including Wnt signaling, depend on tightly regulated secretion, endocytosis, and intracellular trafficking events. However, visualizing the dynamics of membrane-associated proteins within intact epithelial tissues such as wing imaginal discs remains challenging because of the small size and densely packed columnar organization of these cells. Here, we present a protocol combining three-dimensional stimulated emission depletion (3D STED) nanoscopy with Uptake assays and pharmacological perturbations in Drosophila wing imaginal discs. This workflow enables super-resolution imaging of membrane-associated protein dynamics within intact tissue architecture at near-isotropic resolution. Using Wingless-secreting cells as an example, we visualize the localization and trafficking of Wingless (Wg) at the apical membrane. To analyze dynamic trafficking processes, the imaging workflow is combined with an uptake assay that selectively labels proteins undergoing secretion and reinternalization within a defined time window. In combination with chemical inhibitors and visualization using 3D STED nanoscopy, this approach enables functional analysis of membrane trafficking dynamics. Together, this workflow provides a versatile framework for studying membrane organization and protein trafficking at subcellular resolution in whole tissue samples of Drosophila.
Introduction
The fruit fly Drosophila melanogaster is a widely used model organism in developmental biology, evolution, behavior, and biomedical research, including the study of cancer and other human diseases1,2. Many fundamental cellular signaling pathways are highly conserved between Drosophila and vertebrates, making this model system particularly valuable for investigating conserved biological mechanisms in vivo.
In this protocol, the Drosophila wing imaginal disc is used as a model system to study membrane-associated dynamics within the Wingless (Wg)/Wnt signaling pathway. Many developmental signaling pathways rely on tightly regulated secretion, membrane localization, endocytosis, and intracellular trafficking of signaling molecules3. This is also the case at the dorsoventral (DV) boundary of the wing imaginal disc, where Wg is secreted from producing cells at the apical membrane and transported to neighboring receiving cells through interactions with glypicans4,5,6,7. In recipient cells, Wg binds to Frizzled receptors and activates downstream Wnt signaling. In addition to the pool of Wg that is transported away from the DV boundary, a fraction of Wg is re-internalized by producing cells and trafficked through the endosomal system to distinct intracellular destinations8,9,10. The Wg-producing cells at the DV boundary therefore provide an excellent model for investigating membrane trafficking, secretion dynamics, and the cellular mechanisms that regulate signalling activity in vivo.
However, the highly columnar architecture of imaginal disc epithelial cells makes visualization challenging, requiring higher, more isotropic resolution than conventional confocal microscopy can provide to resolve individual vesicles. To overcome these limitations, we optimized tissue preparation, staining, and imaging conditions for super-resolution nanoscopy in intact Drosophila tissues. Specifically, we established a workflow for three-dimensional stimulated emission depletion (3D STED) nanoscopy that enables orthogonal visualization of membrane-associated protein localization along the apical-basal axis of the epithelium11,12. 3D STED is particularly well suited for this application because it provides improved axial resolution compared with conventional confocal microscopy, enabling the visualization of fine subcellular structures in densely packed tissues13,14. Using this approach, we analyzed the apical membrane region of Wg-secreting cells at the DV boundary of the wing imaginal disc and detected Wg at the apical membrane alongside other membrane-associated proteins, such as Discs large 1 (Dlg1) or Evenness interrupted/Wntless (Evi/Wls).
To further investigate protein trafficking dynamics, this imaging workflow was combined with a previously established uptake assay15. This assay enables the selective detection of proteins that have undergone secretion and subsequent re-internalization within a defined time window, thereby visualizing a dynamic pool of proteins trafficking through the plasma membrane. To expand its utility, the Uptake assay was combined with pharmacological perturbations, allowing the analysis of how specific cellular processes influence membrane trafficking dynamics. Together, these approaches provide a powerful framework for studying protein trafficking, secretion, and signaling mechanisms in their native tissue context at high spatial resolution.
Furthermore, the protocol is compatible with a wide range of staining approaches, including standard immunofluorescence protocols. The incorporation of fluorescent dyes is also feasible, further expanding the range of cellular structures and molecular targets that can be visualized. In all cases, fluorophores should be selected for compatibility with STED nanoscopy. Although the present protocol focuses on two-color (red and far-red) 3D STED imaging, the workflow can readily be adapted to additional fluorophores and alternative imaging configurations, thereby increasing its flexibility for diverse experimental applications.
Together, this protocol establishes a versatile framework for combining STED super-resolution nanoscopy with functional perturbation approaches in intact Drosophila tissues. The workflow provides a foundation for future studies investigating membrane organization, protein trafficking, and signaling dynamics at subcellular resolution within complex tissue environments.
Protocol
1. Combined ex vivo inhibitor treatment and uptake assay
NOTE: Refer to the Table of Materials for detailed information on the used chemicals and materials.
- Medium and solution preparation
- Prepare SchM+ medium.
- Add 4% fetal bovine serum (FBS) to Schneider’s insect medium and mix well.
NOTE: SchM+ medium should be freshly prepared on the day of the experiment.
- Add 4% fetal bovine serum (FBS) to Schneider’s insect medium and mix well.
- Prepare 1× PBS-T.
- Add 0.1% Triton X-100 to 1× phosphate-buffered saline (PBS) and mix well.
- Prepare chemical compound solutions.
CAUTION: Many of the following chemical compounds are considered cytotoxic, and careful handling under a fume hood with appropriate equipment and waste disposal is essential.- Dynasor2-24: Dissolve Dynasor2-24 (also known as Dyngo-4a) in dimethyl sulfoxide (DMSO), according to the manufacturer’s instructions, to prepare a 10 mM stock solution. For treatment, dilute the stock solution 1:1000 or 1:2000 in SchM+ to obtain final concentrations of 10 µM or 5 µM, respectively.
- DMSO control: Dilute DMSO 1:1000 in SchM+ and use 200 µL as a negative control in each experiment.
- Prepare acid buffer for uptake assay.
- Prepare a solution of 0.1 M Glycine in dH2O.
- Adjust the pH to 3.5 with 37% HCl (hydrochloric acid).
- Prepare SchM+ medium.
- Sample collection
- Maintain flies at 25 °C with a 12/12-h light/dark cycle.
- Collect L3 (larval stage 3) larvae from vials using forceps and place in a 12-well glass staining plate, each well filled with SchM+.
NOTE: Prepare enough tissue to always include control samples in each experimental replicate. - Open the larvae at the posterior end and invert.
- Remove the gut and fat body from the inverted larval tissue as thoroughly as possible while keeping the tissue submerged in SchM+.
- Then, transfer the tissue into a 0.2 mL PCR tube containing SchM+.
NOTE: we place only 6-7 inverted larvae per polymerase chain reaction (PCR) tube to ensure full emersion and free movement of the tissue.
NOTE: Overfilling the tube with tissue should be avoided to prevent artifacts during staining. Refer to the Table of Materials for detailed information on the chemicals and materials used in this study.
- Ex vivo inhibitor treatment and uptake assay
- Remove SchM+ medium from the sample.
- Add previously prepared chemical compound solution as required, e.g., 200 µL of 5 µM Dynasor2-24 solution.
CAUTION: These chemical compounds are considered cytotoxic, and careful handling under a fume hood with appropriate equipment and waste disposal is essential. - Add 200 µL of DMSO (1:1000) solution to the control sample, representing a negative control.
- For the uptake assay (Witte et al., 202115), add primary antibody to the drug solution: for anti-Wg use at a 1:20 dilution for detection of Wg, and anti-GFP for detection of green fluorescent protein (GFP) tagged proteins, use at a 1:40 dilution.
- Incubate samples at room temperature (RT) for 90 min in the dark.
NOTE: The Uptake assay is optional and can easily be excluded from the protocol if not needed. Also, other chemical compounds can be used depending on the experimental question. It is recommended to titrate the compound and find the best concentration for each individual application. Refer to the Table of Materials for detailed information on the chemicals and materials used in this study.
- Sample fixation
- Remove the staining solution from step 1.3 promptly after incubation time.
- (Optional) Rinse the samples twice with 200 µL of SchM+.
- For proper removal of the primary antibody of the uptake assay, wash the tissue for 5 min with the acid buffer at room temperature (RT).
- Wash quickly 3× for 3 min with SchM+.
- Fix the samples in 4% formaldehyde in SchM+ for 30 min at RT.
- Primary antibody incubation
NOTE: If an additional primary antibody is required alongside the antibody used in the uptake assay, it should be applied at this stage and processed according to standard immunohistochemistry staining procedures.- Block the tissue with 4% normal goat serum in 1× PBS-T for at least 30 min at RT under gentle agitation.
- Remove blocking solution.
- Add primary antibody solution in 1× PBS at desired concentration (examples: anti-wg at 1:200, anti-dlg1 at 1:50 or anti-GFP at 1:200, or any other required antibody)
- Incubate samples at 4 °C overnight under gentle agitation.
- (Optional) Perform primary antibody incubation for at least 1.5 h at RT under gentle shaking.
- NOTE: Refer to the Table of Materials for detailed information on the chemicals and materials used in this study.
- Secondary antibody incubation
- Remove primary antibody solution.
NOTE: Used primary antibody solution in 1× PBS can be reused several times when stored in a fresh 1.5 mL reaction tube at 4 °C. - Wash tissue 3× 10 min in 1× PBS-T under gentle shaking.
Add desired secondary antibodies at 1:200 dilution in 1× PBS-T with 1:2000 Hoechst33342 nuclear counter staining. Secondary antibodies for STED include chicken anti-mouse Alexa Fluor 594, goat anti-rabbit Alexa Fluor 594, goat anti-rabbit STAR635P, and goat anti-mouse STAR635P Refer to the Table of Materials for detailed information on the chemicals and materials used in this study. - Incubate in secondary antibody for overnight at 4 °C (Optional: incubate at least 1.5 h under gentle shaking at RT).
- Wash the tissue the next day 3× 10 min in 1× PBS-T under gentle agitation. The samples are now ready to be mounted for STED imaging. See the whole workflow Figure 1.
NOTE: Microscope optics are typically designed for 23 °C operation, unless other conditions are required. Temperature stability is critical, as fluctuations cause thermal drift and can affect laser timing. A stable room temperature of 20–23 °C (≤ ±±1 °C fluctuations) is recommended16., with 21.5–22 °C often compensating for microscope-generated heat. All microscope components should reach thermal equilibrium before imaging. Stage-top incubators provide accurate sample temperature control, but enclosures can trap heat and increase drift. Active cooling improves stability. In this study, a custom-built incubator (EMBL Heidelberg) maintained a temperature of 21.5 ±± 0.05 °C, minimizing thermal drift and ensuring stable 3D STED performance.
- Remove primary antibody solution.
2. Sample preparation for 3D STED super-resolution nanoscopy and imaging
- Equipment and material preparations:
- Set the microscope.
- Ensure to use an appropriate microscope for the experiment. Here, the Leica Stellaris 8 STED Falcon microscope was used.
- Use an appropriate objective. Here, HC PL APO 86x/1.20 W motCORR STED white objective was used.
- To allow proper imaging, turn on the whole microscope setup at least 2 h prior to imaging (see NOTE after step 1.6.4).
- Prepare poly-L-lysine coated dishes.
- Prepare poly-L-lysine solution with 0.6% poly-L-lysine, 0.002% Photo Flo in dH2O. Aliquot the solution and store it for the long term at -20 °C. After thawing, keep at 4 °C and reuse up to 10 times.
- Add 200 µL of poly-L-lysine solution to 1.5H glass coverslip bottom of µ-dish (∅35 mm)
- Place the dishes vertically tilted for drying.
- After poly-L-lysine solution has completely dried, repeat coating once more.
- Carefully add nail polish spacers at 2 sides of the coverslip glass bottom
- After mounting, cover the samples with 1.5H round (∅12 mm) coverslips (see Figure 2).
- Set the microscope.
- Mounting setup for 3D STED
- NOTE: For 3D STED nanoscopy (see the NOTE after step 2.2.12), it is essential to match the refraction indices between the STED objective and the mounting medium (Example here: water objective and 1× PBS mounting medium).
- Place samples in a small Petri dish filled with 1× PBS.
- Add 15 µL of 1× PBS in a droplet onto the previously prepared poly-L-lysine coated dish.
- Dissect off the wing imaginal discs of the remaining larval tissue and place them in a 15 µL 1× PBS droplet.
- Make sure wing discs are attached to the coated coverslip and not floating.
- Do not press discs down with any force; let them sink down to the cover slip as gently as possible. For correct orientation, ensure that the wing discs are mounted with the peripodal membrane facing down toward the coverslip.
- After mounting, cover the samples with 1.5H round (∅12 mm) coverslips.
- Make sure that the edges of the cover slip are on the previously applied nail polish spacers to avoid squishing of the sample.
- Seal the cover slip with nail polish on all sides to avoid evaporation of mounting medium.
- Keep the dishes in the dark until final imaging.
- Adjust the sample temperature to the temperature of the incubation chamber of the microscope by placing the sample in the incubation chamber at least 30 min prior to imaging in the microscope.
- To prevent any sample movement, stabilize the dish in the microscopy holder with a pressure-sensitive adhesive (e.g., Blu Tack).
NOTE: The terms 2D STED and 3D STED describe the type of resolution enhancement, not whether a single image or a z-stack is acquired12,17. 2D STED improves only the lateral (x,y) resolution, typically to <50 nm, while the axial (z) resolution remains similar to that of confocal microscopy (~600 nm). It is comparatively robust and generally tolerates imperfect refractive index matching between the sample and the objective immersion medium12. 3D STED enhances both lateral and axial resolution, with a particularly strong improvement along the z-axis. By optimizing the fluorophore and STED depletion conditions, an almost isotropic resolution of ~100-120 nm can be achieved in biological samples17,18. However, the 3D STED depletion pattern is highly sensitive to spherical aberrations. Successful imaging, therefore, requires careful refractive index matching and precise adjustment of the objective correction collar to the actual coverslip thickness.
- Nanoscopy requirements and setup
- Turn all needed microscope devices on as required by the manufacturer’s instructions.
- Do not turn on the laser keys yet.
- Set the temperature of the incubation chamber of the microscope to 22–23 °C at least 1.5 h prior to imaging.
- Place the sample in the microscope chamber as well and allow it to adjust to the temperature for at least 30 min.
- Turn the computer on and open the software LAS X (Version 4.9.0).
- Select STED imaging in the opening window and boot up the software
- When the software is loaded, turn the safety keys for both lasers when their lights are showing a green color.
- Go to the Acquire tab and select the appropriate STED objective (HC PL APO 86x/1.20 W motCORR STED).
- Go to the Configuration tab and click on the button for Laser configuration.
- Click on all laser sliders to turn them ON.
- Go to the Configuration tab and click on the button for STED.
- Click Align beams.
- Repeat alignment of the beams after 30 min and 2 h of imaging to ensure an optimal alignment – repeat afterward if required, e.g., when a drop in resolution or higher background is spotted
- Align the correction collar (motorized) of the object to the coverslip thickness using the reflection signal of the coverslip surface:
- Go to the Acquire tab and start setting the motCORR value.
- Create a new channel for GFP fluorescence in confocal mode and focus on the cells of the specimen.
- Click on the Live button and move the sample to a position where no sample is located.
- Stop live imaging.
- Make sure that only the HyDS detector is used for this channel.
- Set the Notch filter configuration to Reflection.
- Click on the Orientation button and select xzy Orientation.
- Reduce the fast live imaging speed to 100 Hz if the sample appears unstable or exhibits z-axis movement.
- Start live imaging by clicking on the Fast Live button.
- Find the cover slip of the sample, which will show up as a line
- Adjust the motCORR value until the signal of this line is as sharp and narrow as possible
NOTE: With a 1.5H coverslip, the value is typically found in the range of 48–56%. - Now start selecting the channels for imaging in the Acquire tab.
- Refer to Table 1 for the settings for Alexa Fluor 594 and STAR635P detection in STED mode.
- Imaging
- Select the imaging area via the eyepieces at the microscope.
- Rotate the sample carefully to align the DV boundary vertically (Figure 2).
- Close the shutter at the microscope and switch to confocal imaging, operating the microscope via the computer.
- Click Fast Live button, adjust the focus, and check the orientation of the DV boundary.
- Stop live imaging.
- (Optional) Take an overview image in the xyz orientation in confocal mode (Set STED laser to 0% in both channels) for later reference at this stage. Turn the STED laser ON after imaging the overview image
- Select xzy orientation and adjust the appearing line to the exact area for orthogonal imaging.
- Click on the Fast Live button and adjust focus if necessary.
- Adjust the x-position of the sample by using the z-Wheel at the microscope.
- Make sure that STED lasers are turned on for both channels and all settings are correct.
- Click Start Experiment.
- Intensity per pixel (detector in photon counting mode) is between 50 and 300 detected photons; this also depends on the laser power, pixel dwell time, and number of line accumulations applied. If the fluorescent lifetime measurements (FLIM) module (Falcon) is accessible, confirm that less than one photon per laser pulse is detected.
- Adjust values as required for the individual sample.
- Challenges for STED nanoscopy
- To visualize a specific morphological area in 3D STED, turn and orient the sample at the microscope to align the tissue precisely with the required axis before flipping from the XY view to the XZ view. Achieve this freedom by mounting on round dishes which can be moved according to experimental requirements (Figure 2).
- During xz-scanning, the sample is physically moved along the z-axis, which initially caused the dish to slightly move in xy due to the oscillations along the vertical axis. To prevent any movement of the dishes, fix the dish on the microscopy sample holder with mounting putty (Blu Tack). This allowed free rotation, while preventing vertical (z-axis) movement.
- To prevent evaporation of the mounting medium and drying of the tissue, coverslips were sealed with nail polish.
- To avoid sample drifting due to temperature differences between the sample and the microscope, bring the samples to the microscope incubation chamber at least 30 min prior to imaging and allow for their adjustment to the microscope temperature16.
- For secondary antibody selection, follow the steps below:
- A wide range of fluorophores is suitable for STED imaging, but only a subset combines favorable photophysical and spectral properties for two-color STED using a single depletion laser (here, 775 nm). Use one STED depletion wavelength for both fluorophores to ensure intrinsic chromatic alignment and eliminate the need for chromatic shift correction by defining both channels with the same STED depletion pattern.
- Common fluorophore pairs include STAR RED/STAR635P, ATTO 647N/ATTO 643, combined with Alexa Fluor 594, STAR 580, or STAR ORANGE18,19. Here, the widely adopted combination of Alexa Fluor 594 and STAR635P was used. While their emission spectra partially overlap, acquire the fluorophores in line-by-line mode using a narrow detection window for Alexa Fluor 594 to minimize crosstalk (see Table 1). As this reduces the detection efficiency of Alexa Fluor 594, assign the brighter immunostaining to this channel.
Results
To establish suitable imaging conditions for 3D STED nanoscopy in wing imaginal discs, we first performed standard immunofluorescence staining of Wg and the apical membrane-associated protein Dlp. Wg was detected using Alexa Fluor 594, whereas Dlp was labeled with STAR635P, two fluorophores compatible with STED nanoscopy (Figure 3). Images were acquired both without STED depletion to obtain confocal-quality images and with STED depletion for super-resolution imaging using the settings described in step 2.3 (Figure 3).
Direct comparison of the same tissue region imaged under confocal and STED conditions as xz-sections demonstrated the substantial increase in spatial resolution provided by 3D STED nanoscopy (Figure 3A–D′). Structures that appeared as elongated signals in confocal images (Figure 3A,A′, and Figure C,C′) were resolved into multiple distinct puncta in STED mode (Figure 3B,B′, and Figure D,D′). This improvement was observed in both the Alexa Fluor 594 and STAR635P channels and was used to optimize staining and imaging parameters to achieve the highest possible signal quality and isotropic resolution in intact wing disc tissue.
Next, we combined the Wg Uptake assay15 with pharmacological inhibition to investigate Wg trafficking at the apical membrane and its recycling through clathrin-dependent endocytosis. We used an endogenously tagged Wg::GFP fly line20, enabling detection of extracellular Wg::GFP with anti-GFP antibody while preserving compatibility with additional mouse-derived antibodies.
Wing imaginal discs were treated with Dynasore 2-24, a dynamin inhibitor targeting clathrin and dynamin-dependent endocytosis21,22, and subsequently subjected to the Wg Uptake assay. Extracellular Wg::GFP was labeled with anti-GFP antibody to monitor internalization, while anti-Dlg1 staining was used to visualize tissue morphology. Wg was detected with Alexa Fluor 594 and imaged in STED mode, whereas Dlg1 was labeled with STAR635P (Figure 4). DMSO-treated control discs showed progressive internalization of Wg::GFP throughout the Uptake assay, with endocytosed signal detected to a depth of approximately 14 µm (Figure 4A,A′). The experiment was independently repeated twice following the protocols described in sections 1 and 2 (Figure 4B,C). In the first replicate, treatment with 5 µM Dynasore2-24 completely abolished Wg Uptake (n = 4; Figure 4B,B′). In the second replicate, Wg internalization was reduced but not eliminated (n = 4; Figure 4C,C′), with the maximum penetration depth decreased to approximately 5 µm.
Such variability is commonly observed in pharmacological inhibition experiments and likely reflects differences in inhibitor efficacy or timing. Incomplete inhibition, limited tissue penetration of the inhibitor, recovery of endocytosis during the assay, or delays introduced by the acid wash and fixation steps may all contribute to residual Wg internalization. Nevertheless, both experiments consistently showed a marked reduction in Wg Uptake and penetration depth compared with the DMSO controls, demonstrating successful inhibition of endocytosis. These findings also emphasize that precise timing throughout the protocol is critical for reproducible results.
Residual membrane-associated signal after acid stripping was occasionally observed and likely represents Wg::GFP molecules that had already entered early endocytic pits and were therefore inaccessible to antibody removal23,24,25.
Together, these experiments demonstrate that combining the Wg Uptake assay with pharmacological perturbation and 3D STED nanoscopy enables visualization of membrane trafficking dynamics in intact wing imaginal discs. They further identify key parameters for successful implementation of the protocol, including appropriate fluorophore and antibody combinations, optimized inhibitor treatment, strict timing of the Uptake assay, and immediate sample mounting before imaging.
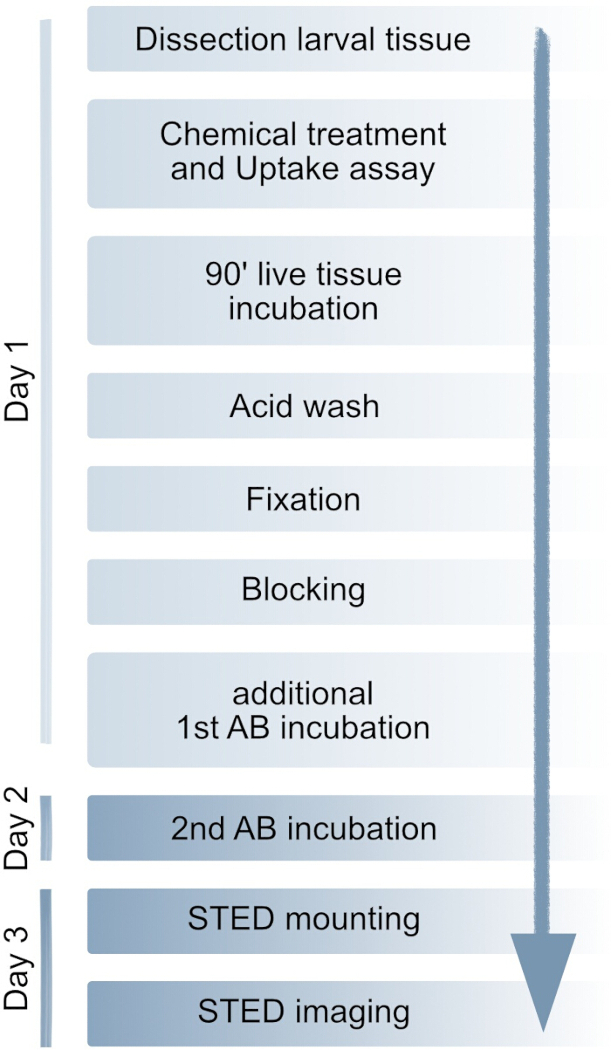
Figure 1: Method workflow. The complete protocol can be completed within 3 days. Optionally, secondary antibody incubation may be performed on the same day. Detailed procedures are provided in the Protocol section. AB: antibody. Please click here to view a larger version of this figure.
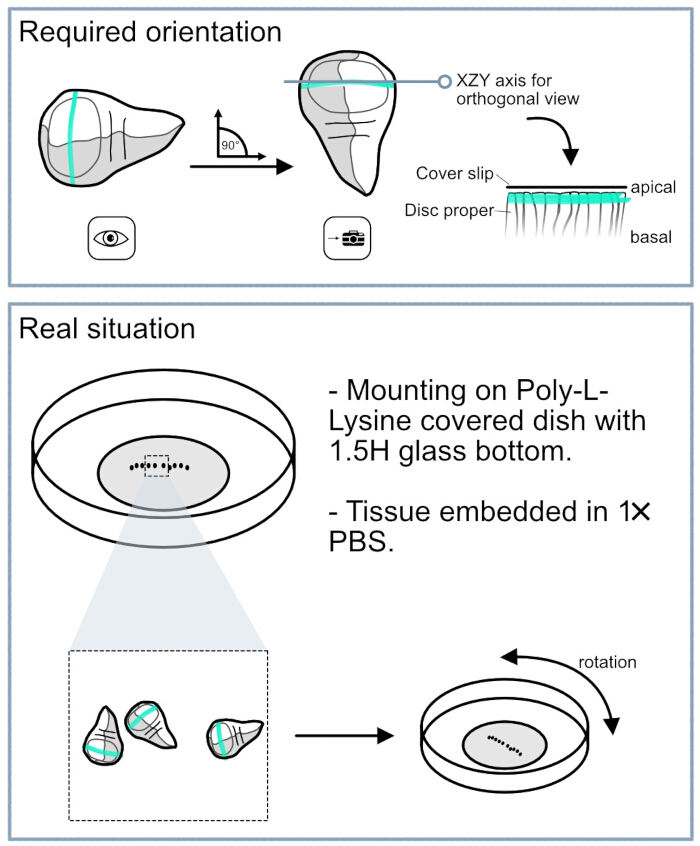
Figure 2: Challenges in mounting Drosophila wing discs for 3D STED. In the top panel, the required orientation of the wing discs is illustrated. For analysis of Wg-secreting cells, it is essential that the DV boundary is aligned perfectly vertically in the eyepiece view. This alignment enables the camera view to be rotated into the orthogonal plane, allowing accurate targeting of the desired cell population. The bottom panel shows the practical setup used for handling wing discs during imaging. Wing discs were mounted in round Petri dishes with a 1.5H glass coverslip bottom. The coverslip surface was coated with poly-L-lysine to facilitate attachment of the tissue. The circular dish design allows rotation within the microscope holder, enabling precise vertical alignment of the DV boundary as required for imaging. Please click here to view a larger version of this figure.
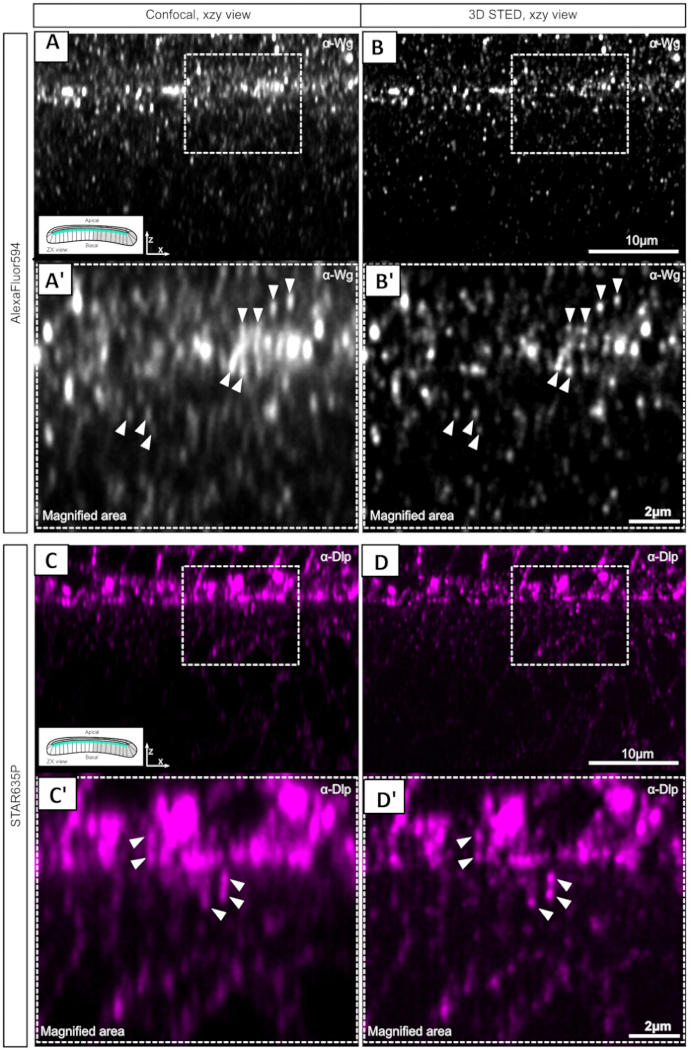
Figure 3: Comparison of confocal and 3D STED imaging at the DV boundary of Drosophila wing discs. (A) Confocal image of Wg-secreting cells at the DV boundary shown in the XZ plane. Anti-Wg staining was detected using Alexa Fluor 594. (A’) Magnified view of the indicated region showing elongated signals (arrowheads) in the apical membrane region. (B,B’) The same region imaged by 3D STED nanoscopy. The Alexa Fluor 594 signal is shown. Compared with confocal imaging, 3D STED resolves the elongated signals into distinct puncta and reveals multiple individual signals (arrowheads). (C) Confocal image of the STAR635P channel from the same specimen shown in A and B. As an example, Dlp was detected using a STAR635P-conjugated secondary antibody, highlighting the apical membrane. (C’) Magnified view showing elongated signals in the confocal image. (D) 3D STED image of the same region shown in C. (D’) Magnified view demonstrating that the broad, elongated signals observed by confocal microscopy are resolved into distinct puncta by 3D STED imaging. Please click here to view a larger version of this figure.
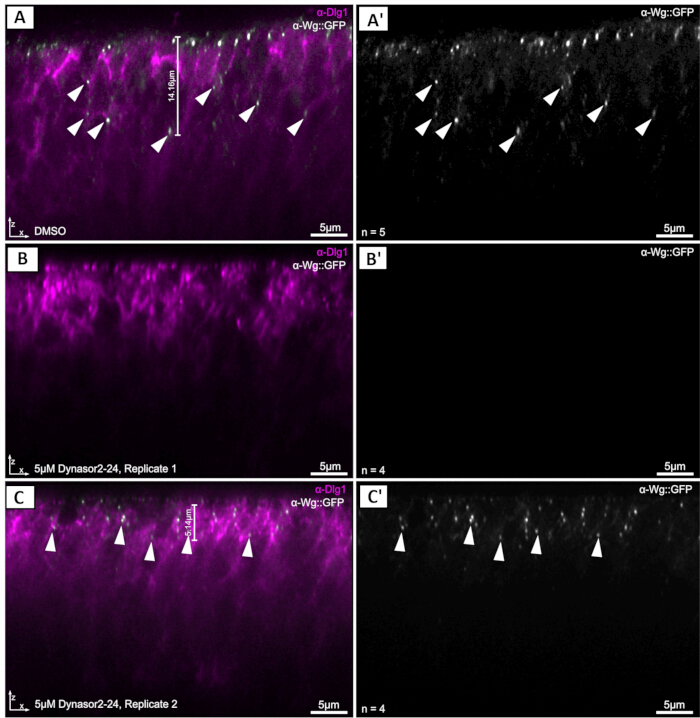
Figure 4: Combining chemical inhibition with the Wg Uptake assay in Drosophila wing imaginal discs visualized by 3D STED. (A,A’) Representative DMSO-treated control disc (n = 5). Extracellular Wg::GFP (grey) is efficiently labelled, and internalized Wg::GFP is detected intracellularly (arrowheads). Dlg1 (magenta) marks tissue morphology and the apical region of the disc proper. (B,B’) Representative sample from replicate 1 treated with 5 µM Dynasore2-24 to inhibit clathrin and dynamin-dependent endocytosis (n = 4). Wg::GFP signal is abolished following the Uptake assay. (C,C’) Representative sample from replicate 2 treated with 5 µM Dynasore2-24 (n = 4). Residual Wg::GFP signal remains detectable near the apical surface (arrowheads), but the intracellular signal is restricted to the first approximately 5 µm of the tissue, compared with approximately 14 µm in DMSO-treated controls (measurement bars in A and C). Dlg1 (magenta) serves as a morphological reference. Please click here to view a larger version of this figure.
| Settings | Alexa Fluor 594 channel | STAR635P channel |
| Objective | 86x/1.2 HC PL APO CS2 (water) | 86x/1.2 HC PL APO CS2 (water) |
| Pixel Size | 37 nm × 37 nm | 37 nm × 37 nm |
| Zoom | 1.2 | 1.2 |
| Detection window | 3072 × 1536 pixel | 3072 × 1536 pixel |
| Line average | 1 | 1 |
| Line accumulation | 16 | 16 |
| Scan Speed | 100–200 | 100–200 |
| Pinhole size | 70 μm | 70 μm |
| Excitation laser line | 580 nm | 638 nm |
| Excitation laser line intensity | 4%–10% (depends on sample) | 8%–10% (depends on sample) |
| Detector | HyD X2, 595–625 nm | HyD X4, 650–740 nm |
| Tau gating excitation laser | 0.5–8 ns | 0.5–8 ns |
| Depletion laser line | 775 nm | 775 nm |
| Depletion laser power | 65-75% (depends on sample) | 65-75% (depends on sample) |
| Lifetime-Based image post-processing (τ-STED) | τ-Strength: 10 | τ-Strength: 10 |
| τ-Background Suppression: active | τ-Background Suppression: active | |
| Smoothening: 0 | Smoothening: 0 |
Table 1: Detailed microscope settings for fluorophores at a STELLARIS SP8 microscope. We have provided our used settings for the fluorophores Alexa Fluor 594 and Star635P.
Discussion
The visualization of membrane trafficking and signaling dynamics within intact tissues remains technically challenging, particularly in highly polarized epithelial cells such as those found in the Drosophila wing imaginal disc. The narrow, columnar morphology of these cells limits the information that can be obtained using conventional confocal microscopy, especially when analyzing protein localization along the apical-basal axis. In this protocol, we addressed these limitations by combining 3D STED11,12 nanoscopy with antibody-based uptake assays and pharmacological perturbations. Together, these approaches enable the visualization of dynamic protein trafficking events within their native tissue environment at a spatial resolution that is not achievable using standard confocal imaging.
A major advantage of the workflow is the use of 3D STED nanoscopy to investigate membrane-associated processes in whole tissues. Direct comparison of confocal and STED imaging demonstrated that elongated signals observed by confocal microscopy could be resolved into distinct puncta by 3D STED imaging (Figure 3), substantially improving the visualization of proteins at the apical membrane. This increased resolution is particularly valuable for analyzing secretion, endocytosis, and intracellular trafficking pathways, where the accurate localization of individual vesicles and membrane-associated protein complexes is essential. Furthermore, the ability to acquire orthogonal views allows protein organization and trafficking to be examined along the apical-basal axis of epithelial cells.
The integration of pharmacological perturbations with the uptake assay further expands the experimental possibilities of the method. Whereas the uptake assay selectively labels proteins that have undergone secretion and subsequent re-internalization within a defined time window, pharmacological treatments enable the perturbation of specific trafficking pathways. The combination of these approaches therefore provides direct insight into how cellular processes influence protein trafficking dynamics in vivo. As demonstrated, visualizing uptaken Wg::GFP under inhibition of clathrin-dependent endocytosis resulted in a loss of the internalized signal of the labeled protein at the apical membrane and/or a reduction in the intracellular Uptake signal, illustrating how the workflow can be used to investigate trafficking mechanisms within their physiological tissue context. More broadly, this approach complements classical genetic strategies and further strengthens the utility of Drosophila as a model system for mechanistic studies of signaling pathways.
Several factors are critical for the successful implementation of the protocol. First, the choice of primary antibodies is crucial, as robust and specific labeling is required for reliable signal detection. However, the limited availability of validated antibodies against endogenous Drosophila proteins remains a major constraint. In this protocol, this necessitated the use of an endogenously tagged Wg::GFP line, as many commonly used Drosophila antibodies are raised in mouse, limiting multiplex immunolabeling. Although fluorescent dyes can provide an alternative for labeling cellular structures such as membranes, mitochondria, or other organelles, most commercially available dyes have been optimized for cultured cells and are difficult to apply efficiently to intact Drosophila tissues.
In addition, secondary antibodies and fluorophores must be carefully evaluated for compatibility with STED nanoscopy, as not all fluorophores provide sufficient signal intensity, photostability, or depletion efficiency under STED imaging conditions19,26. The results presented here further highlight the importance of sample preparation and tissue handling. Similarly, pharmacological treatments must be optimized carefully, as excessive drug concentrations can compromise tissue integrity and generate imaging artifacts that obscure biological signals. Accurate tissue orientation is equally important, since precise alignment of the dorsoventral boundary is required to obtain orthogonal views and reproducibly image the desired cell populations (Figure 2).
Several modifications can be introduced to adapt the workflow to different experimental requirements: The duration of the Uptake assay can be adjusted to balance sufficient protein labeling with preservation of tissue integrity. Likewise, inhibitor concentrations may require titration depending on the tissue type, developmental stage, or signaling pathway under investigation. The protocol is also compatible with a variety of staining approaches, including standard immunofluorescence, extracellular immunofluorescence, and fluorophore-based labeling strategies, provided that the selected fluorophores are suitable for STED nanoscopy. Although the present workflow focuses on two-color imaging, additional fluorophores and imaging configurations could further expand its applicability.
While this protocol was developed using Drosophila wing imaginal discs and the Wg/Wnt signaling pathway as a model system, the approach is not limited to these applications. The workflow can readily be adapted to other Drosophila tissues and is likely transferable to other insect models with comparable tissue dimensions and optical properties. More generally, the combination of Uptake assays, pharmacological perturbations, and 3D STED nanoscopy provides a versatile framework for investigating membrane organization, protein trafficking, secretion, and signaling dynamics in vivo. This capability is likely to be valuable not only for fundamental studies of developmental signaling pathways but also for biomedical research aimed at understanding trafficking defects associated with disease. By enabling direct visualization of dynamic protein populations at subcellular resolution within intact tissues, the method provides a powerful platform for studying the cellular mechanisms that regulate signaling in complex biological systems.
Disclosures
The authors declare no competing interests.
Acknowledgements
M.B. and M.H. are supported by the Deutsche Forschungsgemeinschaft Collaborative Research Center CRC/SFB1324 (project number 331351713) on Mechanisms and Functions of Wnt signaling. We would like to thank the DKFZ light microscopy core facility (LMCF) for its expertise and support.
Materials
| Name | Company | Catalog Number | Comments |
|---|---|---|---|
| 0.2 mL PCR reaction tubes | Biozym | 711068 | |
| 1.5 mL reaction tube | Sarstedt | 72.706.700 | |
| 1.5H glass coverslip bottom of μ-Dish, 35 mm | Ibidi | #81158 | |
| 1.5H round (12 mm) coverslips | Marienfeld | none | |
| 12-well glass staining plate | Marienfeld | CET6.20 | |
| 37% Formaldehyde | Merck | F8775 | |
| anti-dlg1 | DSHB | 4F3 | |
| anti-dlp | DSHB | 13G8 | |
| anti-GFP | Invitrogen | A11122 | |
| anti-mouse Alexa Fluor 594 | Invitrogen | A21201 | |
| anti-mouse STAR635P | Abberior | ST635P-1001 | |
| anti-rabbit Alexa Fluor 594 | Invitrogen | A11012 | |
| anti-rabbit STAR635P | Abberior | ST635P-1002 | |
| anti-Wg | DSHB | 4D4 | |
| Blu Tack | Bostik | 30811745 | Pressure-sensitive adhesive |
| DMSO | VWR | SIAL472301 | |
| Dumont 5 forceps | Dumaont | No. 5 | |
| Dynasor2-24 | MCE | HY-13863 | |
| FBS | Sigma-Aldrich | F7524 | |
| Glycine | Gerbu | 10.231.000 | |
| Leica Stellaris 8 STED Falcon microscope | Leica Microsystems | N/A | |
| Nail polish | essence | N/A | |
| Normal Goat serum | Cell Signalling | 5425S | |
| Objective: HC PL APO 86x/1.20 W motCORR STED white objective | Leica Microsystems | N/A | |
| PBS Tablets | Life technologies | 18912014 | |
| Photo Flo | Kodak | N/A | |
| Poly-L-Lysine | Sigma-Aldrich | P1524 | |
| Schneider's insect medium | Sigma | S0146 | |
| Triton-X100 | Sigma-Aldrich | T9284 |
References
- Giansanti MG, Frappaolo A, Piergentili R. Drosophila melanogaster: How and why it became a model organism. Int J Mol Sci. 2025;26(15):7485.
- Tolwinski NS. Introduction: Drosophila—A model system for developmental biology. J Dev Biol. 2017;5(3):9.
- Perrimon N, Pitsouli C, Shilo BZ. Signaling mechanisms controlling cell fate and embryonic patterning. Cold Spring Harb Perspect Biol. 2012;4(8):a005975.
- Grobe K, Guerrero I. Dally-like is unlike Dally in assisting Wingless spread. Dev Cell. 2020;54(5):572-573.
- Han C, Yan D, Belenkaya TY, Lin X. Drosophila glypicans Dally and Dally-like shape the extracellular Wingless morphogen gradient in the wing disc. Development. 2005;132(4):667-679.
- Khare N, Baumgartner S. Dally-like protein, a new Drosophila glypican with expression overlapping with wingless. Mech Dev. 2000;99(1):199-202.
- McGough IJ, et al. Glypicans shield the Wnt lipid moiety to enable signalling at a distance. Nature. 2020;585(7823):85-90.
- Beckett K, et al. Drosophila S2 cells secrete wingless on exosome-like vesicles but the wingless gradient forms independently of exosomes. Traffic. 2013;14(1):82-96.
- Gross JC. Extracellular WNTs: Trafficking, exosomes, and ligand–receptor interaction. Handb Exp Pharmacol. 2021;269:29-43.
- Gross JC, Chaudhary V, Bartscherer K, Boutros M. Active Wnt proteins are secreted on exosomes. Nat Cell Biol. 2012;14(10):1036-1045.
- Eggeling C, Willig KI, Sahl SJ, Hell SW. Lens-based fluorescence nanoscopy. Q Rev Biophys. 2015;48(2):178-243.
- Sahl SJ, Hell SW, Jakobs S. Fluorescence nanoscopy in cell biology. Nat Rev Mol Cell Biol. 2017;18(11):685-701.
- Wu Z, Xu X, Xi P. Stimulated emission depletion microscopy for biological imaging in four dimensions: A review. Microsc Res Tech. 2021;84(9):1947-1958.
- Jiang N, et al. Superresolution imaging of Drosophila tissues using expansion microscopy. Mol Biol Cell. 2018;29(12):1413-1421.
- Witte L, Linnemannstöns K, Honemann-Capito M, Gross JC. Visualization and quantitation of Wg trafficking in the Drosophila wing imaginal epithelium. Bio Protoc. 2021;11(11):e4040.
- Zimmermann T. Setting up a light microscopy core facility: Facility design. J Microsc. 2024;294(3):255-267.
- Hell SW. Microscopy and its focal switch. Nat Methods. 2009;6(1):24-32.
- Bückers J, et al. Simultaneous multi-lifetime multi-color STED imaging for colocalization analyses. Opt Express. 2011;19(4):3130-3143.
- Jeong S, Widengren J, Lee JC. Fluorescent probes for STED optical nanoscopy. Nanomaterials (Basel). 2022;12(1):21.
- Port F, Chen HM, Lee T, Bullock SL. Optimized CRISPR/Cas tools for efficient germline and somatic genome engineering in Drosophila. Proc Natl Acad Sci U S A. 2014;111(29):E2967-E2976.
- Preta G, Cronin JG, Sheldon IM. Dynasore - not just a dynamin inhibitor. Cell Commun Signal. 2015;13(1):24.
- Yamada H, et al. Dynasore, a dynamin inhibitor, suppresses lamellipodia formation and cancer cell invasion by destabilizing actin filaments. Biochem Biophys Res Commun. 2009;390(4):1142-1148.
- Brunt L, Scholpp S. The function of endocytosis in Wnt signaling. Cell Mol Life Sci. 2018;75(5):785-795.
- Fabrowski P, et al. Tubular endocytosis drives remodelling of the apical surface during epithelial morphogenesis in Drosophila. Nat Commun. 2013;4(1):2244.
- Fischer JA, Eun SH, Doolan BT. Endocytosis, endosome trafficking, and the regulation of Drosophila development. Annu Rev Cell Dev Biol. 2006;22:181-206.
- Klar TA, et al. Fluorescence microscopy with diffraction resolution barrier broken by stimulated emission. Proc Natl Acad Sci U S A. 2000;97(15):8206-8210.