This study establishes a simplified multicellular in vitro blood-tumor barrier (BTB) model combining Transwell co-culture and 3D tumor spheroids, providing a physiologically relevant platform for studying breast cancer brain metastasis and screening targeted therapies.
Method Article
A Cell Culture Insert-Based Protocol for Constructing a Simplified Multicellular In Vitro Blood-Tumor Barrier Model of Breast Cancer Brain Metastasis
* These authors contributed equally
In This Article
Summary
Abstract
Effective treatments for breast cancer brain metastases (BCBM) remain limited, largely because the blood–tumor barrier (BTB) restricts the entry of many chemotherapeutic and targeted agents into metastatic lesions within the central nervous system. To model selected features of this complex microenvironment in vitro, this study presents a standardized protocol for constructing a simplified multicellular three-dimensional BTB model. The method comprises three core steps. First, a blood–brain barrier (BBB) compartment is constructed using cell culture inserts with a 0.4 μm pore size. Human brain microvascular endothelial cells (HBMECs) are seeded on the basal side of the porous membrane, and 1 day later, human astrocytes (HA) and human microglial HMC3 cells (HMC3) are seeded on the apical side.Using SK-BR-3 cells as an example, breast cancer cells are cultured by the hanging drop method to form uniform, regularly shaped 3D tumor spheroids after 3 days of culture. The spheroids are then transferred to the apical side of a basement membrane matrix–coated porous membrane, which provides physical separation while allowing chemical communication between the barrier cells and tumor spheroids during co-culture. This platform enables precise control of the experimental timeline and produces astrocytic morphological and marker changes consistent with a peritumoral reactive response while allowing assessment of endothelial barrier integrity and paracellular permeability.
Introduction
Brain metastasis is a common complication in the late stages of various malignant solid tumors, including breast cancer and lung cancer1,2. Its prognosis is extremely poor, and treatment options are limited1,2. In the healthy central nervous system, the blood–brain barrier (BBB) is a highly specialized and dynamic interface formed primarily by tightly connected brain microvascular endothelial cells, while its integrity and function are supported by the vascular basement membrane and coordinated interactions with pericytes, astrocytes, neurons, microglia, oligodendrocyte-lineage cells, and other components of the neurovascular unit3. Through tight junctions between endothelial cells and the assistance of peripheral glial cells, it strictly restricts the entry of exogenous substances into the central nervous system4. Once breast cancer cells have spread and settled in the brain, brain metastatic lesions expand, local hypoxia increases, inflammatory signals intensify, and the neurovascular unit (NVU) remodels, gradually reconstructing the blood–tumor barrier (BTB)5. Although the local permeability of the BTB is higher than that of the BBB, differences in permeability to molecules of different sizes, coupled with uneven blood perfusion, lead to poor drug accumulation in brain tumors6. Therefore, understanding BTB biology and developing delivery strategies that can cross this barrier have become important priorities in neuro-oncology.
To date, the characteristics and transformation mechanisms of the BTB have only been partially described, and effective drug options for breast cancer brain metastasis (BCBM) remain limited in clinical practice. One challenge is the limited availability of clinical samples derived from brain metastases, together with the limited availability and incomplete functional characterization of existing BTB models. In vivo animal models, particularly mouse models7,8, remain widely used in BTB research. However, these models have limitations, including species differences, low throughput, and challenges in standardization and reproducibility, which can hinder mechanistic studies and drug development9,10. In addition, current in vitro BTB models commonly use co-cultures of tumor cells and barrier-associated cells in cell culture insert systems or microfluidic chips.
These existing models often lack the three-dimensional structure of tumors and are therefore limited in reproducing spatial features relevant to brain metastases, including cell-density gradients, hypoxic/necrotic regions, restricted molecular diffusion, and heterogeneous cellular distribution11,12. To introduce a defined three-dimensional tumor component, we employed a spheroid model that is simple, reproducible, and compatible with screening applications. Building on this, we developed a simplified multicellular human in vitro BBB compartment and integrated it with tumor spheroids to construct a simplified BTB model (Figure 1A) that captures selected structural and cellular features of the brain-metastatic microenvironment. The model is easy to operate, supports quantitative barrier measurements, and enables visualization of spatial changes in tumor-associated astrocytic and microglial populations.
This protocol details the critical steps from cell preparation and seeding to tumor-spheroid generation, basement membrane matrix overlay, matched-control preparation, and spheroid transfer, providing a standardized workflow for constructing this simplified BTB model.
Protocol
This study was conducted in accordance with the principles of the Declaration of Helsinki and was approved by the Ethics Committee of The Second Hospital of Dalian Medical University (Approval No. JW2026-019-01). All patient-related data were anonymized prior to analysis. The research tools used in this protocol are listed in the Table of Materials.
1. Preparation of the blood–brain barrier (BBB) model
- General requirements
- Perform all operations in a sterile laminar-flow cabinet and strictly follow aseptic technique.
- Use 12-well cell culture inserts with PET membranes having a pore size of 0.4 µm and an effective membrane area of 1.12 cm2.
- Collagen type I coating
- Add 1–2 mL of collagen type I coating solution to each culture flask or dish and distribute it evenly over the bottom surface.
- Add 200 µL and 800 µL of coating solution to the apical and basal sides of each cell culture insert, respectively. Gently agitate the plate to ensure complete membrane contact while avoiding bubbles beneath the membrane.
- Incubate the coated vessels and inserts at 37 °C with 5% CO₂ for 1 h. Remove the coating solution and wash twice with PBS.
- Maintain the coated flasks, dishes, and cell culture inserts at 37 °C with 5% CO₂ and use them within 3 days. Rinse once with PBS immediately before use.
- Coat HBMEC and HA culture vessels with collagen type I before cell culture. HMC3-RFP cells do not require collagen type I coating.
- Preparation of the collagen type I coating solution
- Dissolve 60 µL of glacial acetic acid in 50 mL of ultrapure water and cool the solution at 4 °C.
CAUTION: Glacial acetic acid is corrosive. Handle it in a chemical fume hood while wearing appropriate personal protective equipment, including gloves, a lab coat, and eye protection. Dispose of acetic acid waste according to institutional chemical-waste procedures. - Filter the solution through a 0.22 µm syringe filter, add 500 µL of collagen type I (9.45 mg/mL), mix thoroughly, and store at 4 °C until use.
- Dissolve 60 µL of glacial acetic acid in 50 mL of ultrapure water and cool the solution at 4 °C.
- Cell preparation
- Culture HBMEC, HA, and HMC3-RFP cells until they reach 80%–90% confluence before use.
CAUTION: Human-derived cell lines and human tissue–associated materials should be handled as potentially biohazardous. Follow institutional biosafety procedures and wear appropriate personal protective equipment. Dispose of contaminated culture materials as biohazardous waste.
- Culture HBMEC, HA, and HMC3-RFP cells until they reach 80%–90% confluence before use.
- Seeding HBMECs on Day 0
- Detach HBMECs using recombinant trypsin-like protease (1×), centrifuge the cells, and resuspend the pellet to obtain a single-cell suspension.
- Determine the cell density and adjust the suspension so that 120 µL contains 1.5 × 10⁵ HBMECs for each cell culture insert.
- Invert the plate and dispense 120 µL of the HBMEC suspension onto the basal side of the porous membrane. Avoid air-bubble formation during seeding (Figure 1B).
- Cover the wells, keep the 12-well plate inverted, and incubate for 6 h.
- Return the plate to the upright position, add 200 µL and 800 µL of ECM complete culture medium to the upper and lower chambers, respectively, and continue incubation.
- Seeding HA and HMC3-RFP cells on Day 1
- Detach HA cells with recombinant trypsin-like protease (1×) and HMC3-RFP cells with 0.25% trypsin-EDTA. Centrifuge and resuspend the two cell types separately.
- Determine the cell densities and combine 2.0 × 10⁵ HA cells with 4.0 × 10³ HMC3-RFP cells for each cell culture insert.
- Centrifuge the mixed cells, discard the supernatant, and resuspend the pellet in 200 µL of mixed complete medium (AM complete medium: MEM complete medium = 5:1). Add the 200 µL suspension evenly to the upper chamber while avoiding air bubbles (Figure 1B).
- Add 800 µL of ECM complete culture medium to the lower chamber, maintain the plate upright in the incubator, and change the medium daily.
2. Preparation of three-dimensional tumor spheroids
- Preparation of SK-BR-3 cells
- Culture SK-BR-3 cells until they reach 80%–90% confluence before proceeding to spheroid formation.
- Detach SK-BR-3 cells with 0.25% trypsin-EDTA, centrifuge the cells, and resuspend the pellet to obtain a single-cell suspension.
- Determine the cell density and adjust the suspension so that each 30 µL droplet contains 2 × 10⁴ cells.
- Formation of hanging drops
- Invert a 10 cm cell-culture dish and dispense 30 µL droplets of the cell suspension onto the dish lid. Place approximately 20 droplets on each lid.
- Replace the bottom of the dish and quickly invert the assembled dish (Figure 1B). Prepare the droplets again if they drip from the lid or lose their shape.
- Spheroid culture
- Add 5 mL of PBS to the dish and place it in the incubator. Do not disturb the dish during the first 2 days of culture.
- For long-term culture, add 10 µL of complete culture medium to each droplet every 2 days.
- Add medium from the edge of each droplet with the pipette tip and avoid contacting the tumor spheroids.
3. Preparation of the simplified blood–tumor barrier (BTB) model
- Preparation of materials
- Coat the required cell-culture vessels and cell culture inserts (PET membrane, 0.4 µm pore size) with collagen type I and maintain them in the incubator until use.
- Cut the ends of 200 µL pipette tips with scissors and sterilize the modified tips by autoclaving.
- Model establishment
- Day 0–1: Construct the BBB model and prepare tumor spheroids as described above.
- Day 2: Thaw the basement membrane matrix on ice. Remove the culture medium from both chambers and wash both chambers with PBS.
- Add 800 µL of ECM complete medium to the lower chamber and 30 µL of thawed basement membrane matrix to the upper chamber. Spread the basement membrane matrix evenly over the porous membrane.
- Incubate the plate at 37 °C for 20 min, then add 200 µL of mixed complete medium (AM:MEM = 5:1) slowly along the sidewall of the upper chamber. Return the plate to the incubator (Figure 1B).
- Keep the basement membrane matrix on ice and work rapidly. Use a pre-cooled pipette tip when aspirating the basement membrane matrix.
- Matched spheroid-free/basement membrane matrix control
- Prepare control inserts using the same basement membrane matrix volume (30 µL), medium composition, washing steps, incubation times, and daily medium-change schedule as the BTB condition, but omit tumor spheroid transfer on Day 3. Thus, the matched control differs from the BTB condition by the presence or absence of tumor spheroids rather than by basement membrane matrix exposure or handling.
- Transfer of tumor spheroids on Day 3
- Examine the tumor spheroids under an upright microscope and confirm that they are regularly shaped and have formed compact spheroids.
- Aspirate the tumor spheroids into 1.5 mL microcentrifuge tubes using a cut-off pipette tip and wash them twice with PBS. Handle the spheroids gently to avoid disruption.
- Replace the medium in the lower chamber and remove the culture medium from the upper chamber.
- Transfer five tumor spheroids into each upper chamber using a cut-off pipette tip.
- Add 200 µL of mixed complete culture medium (AM:MEM = 5:1) to the upper chamber and gently shake the plate to prevent spheroids from contacting or merging (Figure 1B).
- Maintain the plate in the incubator and change the medium daily.
- Sample collection
- Collect samples on Day 7 for subsequent experiments, or adjust the collection time according to the experimental requirements.
4. Transendothelial electrical resistance (TEER) measurement
- Electrode preparation
- Fully charge the TEER meter and immerse the chopstick electrodes in 75% ethanol for 15 min.
CAUTION: Ethanol is flammable. Keep 75% ethanol away from open flames, sparks, and other ignition sources, and handle it in accordance with institutional chemical-safety procedures. - Expose the biosafety cabinet to ultraviolet light for 30 min for sterilization. Do not directly expose the electrodes to ultraviolet irradiation.
- Remove the electrodes from ethanol, equilibrate them in PBS for 15 min, and dry them under sterile conditions.
- Fully charge the TEER meter and immerse the chopstick electrodes in 75% ethanol for 15 min.
- Equilibration of cell culture inserts
- Remove the 12-well plate containing the cell culture inserts from the incubator and allow it to stand at room temperature for 15 min before measurement.
- Resistance measurement
- Prepare a cell-free blank cell culture insert with 200 µL and 800 µL of the same complete culture medium in the upper and lower chambers, respectively.
- Insert the chopstick electrodes gently along the edge of the cell culture insert without touching the porous membrane or the well bottom.
- Rinse the electrodes with PBS and dry them. Measure each cell-containing insert using the same procedure and record the resistance as R₍measured₎.
- TEER calculation
- Calculate the transendothelial electrical resistance (TEER) value using the following formula13:
TEER (Ω·cm²) = (R(measured) − R(blank) × S (1.1) - R(measured) is the resistance across the porous membrane containing the cell layer (Ω); R(blank) is the resistance across a cell-free porous membrane (Ω); and S is the effective membrane area (cm2). The effective membrane area used in this study is 1.12 cm2.
- Calculate the transendothelial electrical resistance (TEER) value using the following formula13:
5. FITC-dextran paracellular permeability assay (apical-to-basal direction)
- Preparation of FITC-dextran
- Prepare a 2 mg/mL FITC-dextran (4 kDa) working solution before the experiment and protect it from light.
- Interpretation of assay direction
- Interpret the present assay as an apical-to-basal paracellular barrier-integrity readout because HBMECs are attached to the basal face of the membrane, whereas astrocytes, microglia, and tumor spheroids occupy the apical compartment.
NOTE: For studies intended to mimic systemic exposure, introduce FITC-dextran or a test compound into the lower/basal endothelial-facing compartment and collect samples from the upper/apical compartment using a separately validated sampling scheme and Papp calculation.
- Interpret the present assay as an apical-to-basal paracellular barrier-integrity readout because HBMECs are attached to the basal face of the membrane, whereas astrocytes, microglia, and tumor spheroids occupy the apical compartment.
- Washing and equilibration
- Remove all culture medium from both chambers. Add 400 µL and 1 mL of prewarmed glucose-free DMEM basal medium to the upper and lower chambers, respectively, gently wash once, and discard the medium.
- Add 400 µL and 1 mL of fresh prewarmed glucose-free DMEM basal medium to the upper and lower chambers, respectively. Equilibrate at 37 °C with 5% CO₂ for 15 min and then aspirate all liquid.
- Permeability measurement
- Add 200 µL of 2 mg/mL FITC-dextran working solution to the apical side and 800 µL of glucose-free DMEM basal medium to the lower chamber. Incubate at 37 °C with 5% CO₂ for 30 min in the dark.
- Collect 100 µL of medium from the lower chamber of each experimental insert after 30 min. Transfer three aliquots from each insert to a black 96-well plate and protect them from light.
- Preparation of the FITC-dextran standard curve
- Prepare FITC-dextran standards at 0, 0.5, 1.0, and 1.5 mg/mL. Add 100 µL of each standard to a black 96-well plate in triplicate and protect the plate from light.
- Fluorescence measurement and Papp calculation
- Measure fluorescence intensity using a multifunctional microplate reader at an excitation wavelength of 492 nm and an emission wavelength of 520 nm. Record the data and calculate the apparent permeability coefficient (Papp) using the following equations14.
- First, linearly fit the concentrations of the FITC-dextran standard solutions (C) against the corresponding fluorescence intensities (A) to generate a standard curve:
A = kC + b (1.2) - Here, k represents the slope of the standard curve, and b represents the intercept.
- Next, substitute the fluorescence intensity of the sample (At) measured at time t into the standard curve equation to obtain the FITC-dextran concentration (Ca) on the basolateral side at time t. Then substitute Ca into the following formula to calculate Papp (cm/s):
- Papp = (Ca × Va)/(t × S × C0) (1.3)
- Here, Va is the total basolateral volume (mL); t is the permeation time (s); S is the effective area of the porous membrane (cm2); and C₀ is the initial concentration on the apical side.
6. Immunofluorescence staining
- Fixation, washing, and permeabilization
- Remove all culture medium from the cell culture inserts, wash twice with PBS, and aspirate all residual liquid.
- Add 200 µL and 800 µL of 4% paraformaldehyde to the upper and lower chambers, respectively, and fix the cells overnight at 4 °C.
CAUTION: Paraformaldehyde is hazardous and should be handled in a certified chemical fume hood while wearing gloves, a lab coat, and eye protection. Collect paraformaldehyde waste separately and dispose of it according to institutional hazardous-waste procedures. - Remove the paraformaldehyde and add 200 µL and 800 µL of PBS to the upper and lower chambers, respectively. Wash on a shaker three times for 5 min each.
- Add 200 µL and 800 µL of 0.5% nonionic surfactant to the upper and lower chambers, respectively, and permeabilize for 10 min at room temperature.
- Remove the nonionic surfactant solution and wash with PBS three times for 5 min each.
- Membrane excision and blocking
- Invert the cell culture inserts onto the lid of a cell-culture dish, excise the porous membranes carefully along the edge with a scalpel, and transfer them to a 24-well plate.
- Add 200 µL of 3% BSA in PBS to cover each membrane and block for 90 min at room temperature. If necessary, cut the membranes into smaller pieces for separate staining.
- Primary antibody incubation
- Dilute the primary antibodies with standard antibody diluent and add enough solution to completely cover each membrane.
- Add ultrapure water to surrounding empty wells to reduce evaporation and incubate the samples overnight at 4 °C. Use samples without specific primary antibody as negative controls.
- Remove the primary antibody solution on the following day and wash the membranes with 1 mL of PBS on a shaker three times for 10 min each.
- Secondary antibody and DAPI staining
- Dilute the secondary antibodies with fluorescence antibody diluent under light-protected conditions, cover the membranes completely, and incubate for 90 min at room temperature. Wash with PBS three times for 10 min each while protected from light.
- Add ready-to-use DAPI staining solution to cover the membranes and incubate for 15 min at room temperature. Wash with PBS three times for 10 min each while protected from light.
- Clearing, mounting, and imaging
- Add an appropriate volume of 3D cell-culture clearing reagent to cover the membranes and incubate for 15 min at room temperature under light-protected conditions.
- Transfer the membranes onto glass slides with ophthalmic forceps, add antifade mounting medium, and mount the samples under light-protected conditions. Observe and image the samples using a confocal laser-scanning microscope.
7. Statistical reporting
- For the functional comparisons, n = 3 denotes three independent biological replicates per condition, and each biological replicate was treated as the experimental unit. Individual data points for all three biological replicates. Data are presented as mean ± SD. Perform comparisons using two-tailed unpaired Student’s t-tests, with exact t and p values.
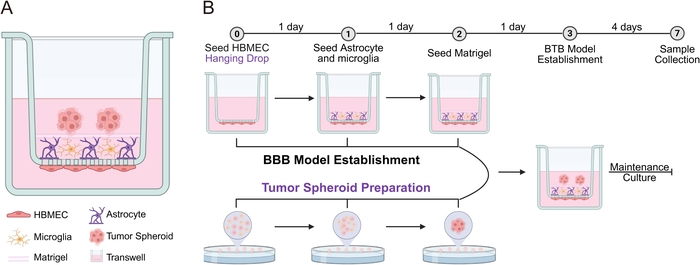
Figure 1: Schematic illustration and construction workflow of the BTB model. (A) HBMECs were seeded on the basal side of the porous cell culture insert membrane, whereas HA cells and HMC3-RFP cells were distributed on the apical side. A layer of basement membrane matrix was used to separate the tumor spheroids from the barrier-cell compartment. For the matched spheroid-free control, the same basement membrane matrix overlay and handling were used, but tumor spheroids were omitted. (B) The circled numbers at the top indicate the corresponding days of culture. BBB construction and tumor spheroid preparation were performed simultaneously. After a layer of basement membrane matrix was added to the upper surface of the cell culture insert, tumor spheroids were transferred into the upper chamber using a cut-off pipette tip. The BTB model was then maintained in culture for up to 1 week before sample collection. Samples can normally be collected on Day 7 for subsequent experiments. Please click here to view a larger version of this figure.
Results
In the matched spheroid-free BBB control overlaid with the same amount of basement membrane matrix, HMC3-RFP signals were distributed relatively broadly across the apical cell layer (Figure 2). In the BTB condition, endpoint images showed HMC3-RFP signals mainly in regions not covered by tumor spheroids, with reduced signal beneath the spheroids and in immediately adjacent regions (Figure 2). These data demonstrate a spatial association between the presence of tumor spheroids and the endpoint distribution of HMC3-RFP cells. Because baseline HMC3-RFP distribution before spheroid introduction and longitudinal cell tracking were not assessed, the present data do not establish active microglial migration, repulsion, or tumor-driven exclusion.
Astrocytes also showed differences in marker signal and morphology in the BTB condition (Figure 2). Compared with the matched spheroid-free/basement membrane matrix control, representative images suggested stronger GFAP fluorescence in both peri-spheroid and distal regions. Astrocytes at the spheroid margin displayed enlarged cell bodies, thicker and elongated processes, and processes oriented toward the spheroid edge (Figure 2). These endpoint features are consistent with a reactive astrocyte-like phenotype, but they do not by themselves establish a specific reactive-astrogliosis program or its underlying mechanism. Morphologically similar peritumoral astrocytic structures were observed in human breast cancer brain-metastasis tissue sections, where immunofluorescence staining showed features consistent with peritumoral reactive astrogliosis (Figure 3A). To further characterize AQP4-associated astrocytic features, AQP4 immunofluorescence staining was performed in the matched spheroid-free BBB model and in the distal and peri-spheroid regions of the BTB model (Figure 3B). Representative images of the BBB model, the distal region of the BTB model, and the peri-spheroid region adjacent to the tumor spheroids are shown in the first, second, and third rows, respectively (Figure 3B). Within the BTB model, peri-spheroid astrocytes showed morphological differences compared with distal astrocytes. Taken together, the GFAP/AQP4 and morphological observations support tumor-spheroid-associated astrocytic remodeling within this model; the resemblance to patient tissue should be interpreted as phenotypic similarity rather than evidence that the model fully reproduces human peritumoral astrogliosis.
To evaluate tumor-spheroid-associated changes in endothelial junctional organization, we performed immunofluorescence staining of the tight-junction protein ZO-1 in the basal HBMEC layer of the simplified BBB and BTB models, using matched spheroid-free and spheroid-containing conditions overlaid with equal amounts of basement membrane matrix. Confocal imaging was focused on the region corresponding to the tumor spheroids (Figure 4A). In the matched spheroid-free control, ZO-1 signals between HBMECs showed a relatively continuous, linear distribution with clearly defined intercellular borders. In the BTB condition, ZO-1 fluorescence in regions corresponding to tumor spheroids appeared sparser, with focal disruption and discontinuity (Figure 4A). These endpoint images are consistent with local loss of tight-junction organization. However, without additional BTB-specific molecular markers or mechanistic perturbation experiments, the present data cannot distinguish specific BTB remodeling from nonspecific tumor-associated endothelial injury or barrier disruption.
At the functional level, TEER measurement and FITC-dextran permeability assays were performed simultaneously on Day 7 in the matched spheroid-free/basement membrane matrix control and the spheroid-containing BTB condition (Figure 4B). Individual values from all three independent biological replicates are displayed as scatter points in Figure 4B, with summary data presented as mean ± SD. The TEER value of the BTB condition (106.0 ± 9.5255 Ω·cm2, n = 3 independent biological replicates) was lower than that of the matched control (168.0 ± 5.1325 Ω·cm2, n = 3 independent biological replicates). Consistently, the apparent permeability coefficient (Papp) measured in the apical-to-basal FITC-dextran assay was higher in the BTB condition (5.851 ± 1.2080 × 10⁻3 cm/s, n = 3 independent biological replicates) than in the matched control (2.656 ± 1.0937 × 10⁻3 cm/s, n = 3 independent biological replicates). Two-tailed unpaired Student’s t-tests showed statistically significant differences [TEER: t(4) = 9.920, p = 0.0006; Papp: t(4) = 3.395, p = 0.0274] (Figure 4B). Within this experimental configuration, the concordant reduction in electrical resistance and increase in FITC-dextran permeability demonstrate reduced barrier integrity in the presence of tumor spheroids. These measurements alone do not establish a specific BBB-to-BTB remodeling mechanism, and the apical-to-basal FITC-dextran assay should not be interpreted as a physiological blood-to-tumor drug-delivery experiment.
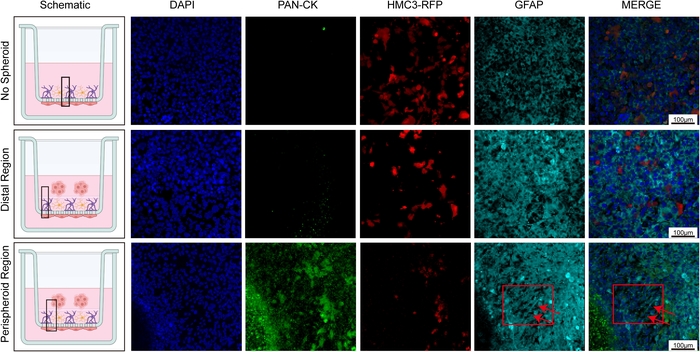
Figure 2: Immunofluorescence staining in the BTB model. Representative immunofluorescence images of Pan-CK and GFAP staining in the apical cell layers of the matched spheroid-free BBB control and BTB model, both overlaid with equal amounts of basement membrane matrix, with the HMC3-RFP signal also shown. The first column presents schematic illustrations, and the black square indicates the viewing area for confocal imaging. The first row shows the matched control without a spheroid (No Spheroid); the second row shows regions distal to the tumor spheroids in the BTB model (Distal Region); and the third row shows regions adjacent to the tumor spheroids in the BTB model (Peri-spheroid Region). Arrows indicate regions showing astrocytic morphological features consistent with a reactive phenotype. Cell nuclei were counterstained with DAPI (blue), tumor cells were labeled with pan-cytokeratin (Pan-CK; green), RFP-expressing microglia are shown in red, and GFAP staining is shown in cyan. Scale bar = 100 µm. Please click here to view a larger version of this figure.
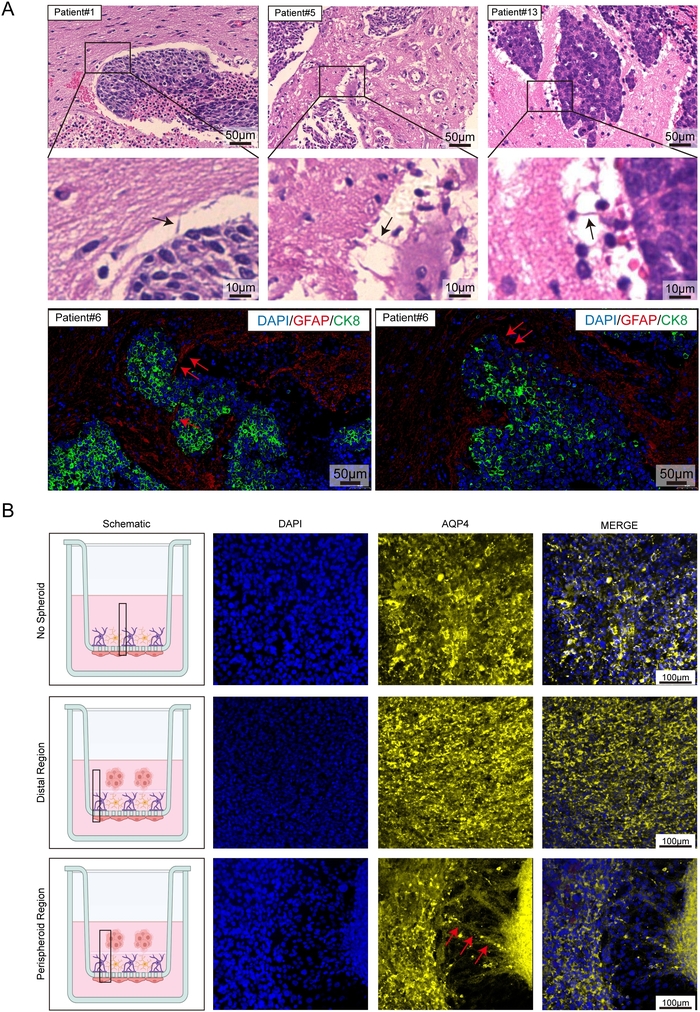
Figure 3: Immunofluorescence staining reveals morphological features consistent with peritumoral reactive astrogliosis in the BTB model. (A) Brain tissue sections from patients with breast cancer brain metastases were subjected to H&E staining. Astrocytic structures at the interface between tumor tissue and brain parenchyma or blood vessels showed morphological features consistent with peritumoral reactive astrogliosis. Black arrows indicate representative regions. Immunofluorescence staining further showed astrocytic morphological features consistent with a reactive phenotype; the red arrow highlights a representative region. Scale bars: 50 µm for the H&E-stained images in the first row, 10 µm for the H&E-stained images in the second row, and 50 µm for the immunofluorescence images in the third row. (B) AQP4 immunofluorescence staining was performed in the matched spheroid-free BBB model and in the distal and peri-spheroid regions of the BTB model. The first row shows representative images of the BBB model, the second row shows representative images of the distal region of the BTB model, and the third row shows representative images of the peri-spheroid region adjacent to the tumor spheroids. Arrows indicate astrocytic morphological changes in the peri-spheroid region. Nuclei were stained with DAPI and are shown in blue, while AQP4 is shown in yellow. Scale bar = 100 µm. Please click here to view a larger version of this figure.
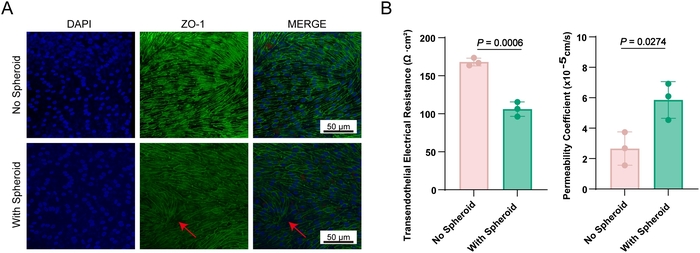
Figure 4: Functional characterization of the BTB model. (A) Immunofluorescence staining of ZO-1 in the basal endothelial cell layer of the BBB and BTB models overlaid with an equal amount of basement membrane matrix. The first column shows schematic diagrams, with black boxes indicating the regions selected for confocal imaging. The first row shows representative images of the basal cell layer in the BBB model without tumor spheroids (No Spheroid), and the second row shows representative images of the basal cell layer in the BTB model with tumor spheroids (With Spheroid). The red arrow highlights a region with sparse ZO-1 fluorescence and focal discontinuities. Nuclei were stained with DAPI and are shown in blue, while ZO-1 is shown in green. Scale bar = 50 µm. (B) TEER values and FITC-dextran (4 kDa) apparent permeability coefficients (Papp) of the matched spheroid-free BBB control (No Spheroid) and the BTB condition (With Spheroid), both overlaid with an equal amount of basement membrane matrix. n = 3 independent biological replicates per condition. Individual data points for all three biological replicates are shown, and summary data are presented as mean ± SD. FITC-dextran Papp values were obtained in the apical-to-basal direction. Please click here to view a larger version of this figure.
Discussion
A spheroid model was used to introduce a three-dimensional tumor component that provides spatial organization and diffusion constraints not captured by conventional two-dimensional tumor-cell culture. Its simplicity and reproducibility also make it compatible with screening-oriented workflows. The spheroids were combined with a three-cell human barrier compartment containing brain microvascular endothelial cells, astrocytes, and microglia to construct a simplified multicellular human in vitro BTB model. The system is easy to operate, compatible with multi-well culture and quantitative barrier measurements (Figure 1), and allows visualization of cell morphology and spatial distribution by immunofluorescence staining. The observed GFAP/AQP4-associated astrocytic changes and their morphological resemblance to peritumoral astrocytes in breast cancer brain-metastasis tissue support the model’s relevance for studying selected tumor–glial–endothelial interactions5, although these findings do not establish equivalence to the full human BTB.
The hanging-drop method was used to generate tumor spheroids, which were co-cultured with human brain microvascular endothelial cells, human astrocytes, and human microglia to establish a simplified multicellular human in vitro BTB platform. Under the conditions tested, tumor spheroids were associated with reduced TEER, increased apical-to-basal FITC-dextran permeability, altered ZO-1 organization, and astrocytic marker/morphological changes. TEER and permeability measurements are established approaches for evaluating barrier integrity in in vitro barrier systems13,14. These findings demonstrate tumor-spheroid-associated barrier impairment and glial remodeling within this defined system. However, this BTB platform does not establish complete BBB-to-BTB transformation, active microglial migration, or a specific molecular mechanism of BTB remodeling. The platform is therefore best viewed as a tractable experimental model for hypothesis generation and controlled studies of tumor–glial–endothelial interactions, with directionally appropriate transport assays required when modeling systemic drug delivery.
This simplified model has several important limitations. First, it does not contain the full neurovascular unit or brain–tumor microenvironment. Pericytes, neurons, a physiologically complete basement membrane/extracellular matrix, and circulating immune cells are absent. Pericytes are important regulators of neurovascular and barrier function15,16,17, but their incorporation into a standardized human in vitro model remains challenging because of the limited availability and batch-to-batch variability of primary human pericytes. Therefore, this model should not be described as a complete human BTB, but rather as a simplified experimental platform. Second, the current study uses SK-BR-3 as a single breast cancer cell line. The observed phenotypes therefore cannot be generalized to BCBM biology as a whole. Validation with additional breast cancer subtypes, brain-tropic models, and patient-derived BCBM spheroids or organoids will be important for establishing generalizability and patient relevance. Third, the current HMC3-RFP data are endpoint observations and do not resolve whether the spatial pattern results from active migration, differential survival, or pre-existing distribution. Longitudinal live-cell imaging would be required to distinguish these possibilities. Fourth, the ZO-1, TEER, and FITC-dextran data establish barrier impairment but do not distinguish BTB-specific remodeling from nonspecific endothelial injury; additional molecular characterization and mechanistic controls are needed. Fifth, because HBMECs are seeded on the basal face of the membrane in this configuration, the reported apical-to-basal FITC-dextran assay is a barrier-integrity readout rather than a physiological blood-to-tumor transport assay. Systemic-delivery studies should introduce tracer or drug into the lower/basal endothelial-facing compartment and validate transport toward the upper/apical tumor compartment. Finally, the current functional measurements were based on three independent biological replicates per condition. Although this design distinguishes biological from technical replication, increasing the number of independent biological replicates would further strengthen the assessment of reproducibility. Incorporating these refinements, including pericytes and patient-derived material, could progressively increase the physiological and translational relevance of the platform.
Disclosures
The authors have no conflicts of interest to disclose.
Acknowledgements
This work was supported by the Educational Reform Project of Liaoning Province (JG24DB110), the Life and Health Guidance Plan Project of Dalian (2025ZDJH01PT101), the 1+X Program of the Second Hospital of Dalian Medical University (2024LCJSYL07), and the United Foundation of the Dalian Institute of Chemical Physics, Chinese Academy of Sciences, and Dalian Medical University (DMU-2&DICP UN202509).
Materials
| Name | Company | Catalog Number | Comments |
|---|---|---|---|
| 0.25% Trypsin-EDTA (1×) (detach HMC3-RFP cells) | NCM Biotech | C100C1 | Used to detach HMC3-RFP cells during cell preparation. |
| 1.5 mL centrifuge tubes | Jet Biofil | CFT001015 | Used to collect, wash, and handle tumor spheroids. |
| 12-well cell culture plate | Jet Biofil | TCP011012 | Used to hold 12-well cell culture inserts during BBB/BTB model construction. |
| 3D cell culture clearing reagent | Thermo Fisher | V11326 | Used to clear stained cell culture membranes before mounting and confocal imaging. |
| Alexa Fluor 488-labeled anti-rabbit secondary antibody | Proteintech | RGAR002 | Fluorescent secondary antibody used for immunofluorescence detection of rabbit primary antibodies. |
| Alexa Fluor 647-labeled anti-mouse secondary antibody | Proteintech | RGAM005 | Fluorescent secondary antibody used for immunofluorescence detection of mouse primary antibodies. |
| Antibody diluent | Solarbio | A1800 | Used to dilute primary antibodies for immunofluorescence staining. |
| Anti-fade mounting medium | Solarbio | S2100 | Used to mount stained membranes and reduce fluorescence fading during imaging. |
| Astrocyte Growth Supplement (AGS) | ScienCell | 1852 | Supplement used for culture of human astrocytes. |
| Astrocyte Medium (AM) | ScienCell | 1801 | Culture medium used for human astrocytes and as a component of the mixed upper-chamber medium. |
| Cell culture dish | Servicebio | CCD-100 | Used for routine cell culture and hanging-drop tumor spheroid preparation. |
| Collagen Type I | Corning | 354249 | Used to coat culture vessels and cell culture inserts before cell seeding. |
| Coverslips | Citotest | 10212450C | Used for mounting and microscopy preparation. |
| DAPI staining solution | Servicebio | G1012-10ML | Used for nuclear counterstaining during immunofluorescence staining. |
| DMEM basic (1×) | Gibco | C11995500BT | Used as basal medium in the FITC-dextran permeability assay. |
| Endothelial Cell Growth Supplement (ECGS) | ScienCell | 1052 | Supplement used for culture of human brain microvascular endothelial cells. |
| Endothelial Cell Medium (ECM) | ScienCell | 1001 | Culture medium used for HBMECs and the lower chamber of the BBB/BTB model. |
| Fetal Bovine Serum (FBS) | Gibco | A5669701 | Serum supplement used in complete cell culture media. |
| FITC-labeled Dextran (MW 4,000) | Beyotime | ST2930-50mg | Fluorescent tracer used to assess paracellular permeability and calculate Papp. |
| Fluorescent antibody diluent | Solarbio | A1840 | Used to dilute fluorescent secondary antibodies for immunofluorescence staining. |
| Glacial acetic acid | Sigma | 27225 | Used to prepare the collagen type I coating solution. |
| HA | Human astrocyte | NA | Astrocytic component for assessing tumor-associated morphological and marker responses |
| HBMEC | Human brain microvascular endothelial cells | NA | BBB/BTB endothelial barrier component |
| HMC3-RFP | RFP-labeled human microglial cell line HMC3 | NA | Microglial component for fluorescence tracking |
| Matrigel | Corning | 354230 | Basement membrane matrix used as an overlay to separate tumor spheroids from the barrier-cell compartment. |
| MEM (with NEAA) Complete Medium (10) | Procell System | PM150410B | Medium used as a component of the mixed upper-chamber culture medium. |
| Microscope slides | Citotest | 188105 | Used to mount excised stained membranes for confocal imaging. |
| Mouse anti-human GFAP antibody | EMD Millipore | MAB360-25μL | Primary antibody used to detect GFAP in astrocytes by immunofluorescence. |
| Paraformaldehyde | Servicebio | G1101-500ML | Used to fix cells before immunofluorescence staining. |
| PBS phosphate-buffered saline powder | Servicebio | G0002-2L | Used for washing, equilibration, and preparation steps throughout the protocol. |
| Penicillin-Streptomycin Solution (P/S) | Servicebio | G4003-100ML | Antibiotic supplement used in complete cell culture media. |
| Pipette | Eppendorf | 3123000250 | Used for liquid handling throughout cell culture and assay procedures. |
| Pipette tips | MWM Bio | 800201 | Used for routine liquid handling; modified cut-off tips are used for tumor spheroid transfer. |
| Rabbit anti-human PAN-CK polyclonal antibody | MedChemExpress | HY-P81164 | Primary antibody used to identify tumor cells by immunofluorescence. |
| Rabbit anti-human ZO-1 antibody | Proteintech | 21773-1-AP | Primary antibody used to assess endothelial tight-junction organization by immunofluorescence. |
| SK-BR-3 | Human breast cancer cell line | NA | Tumor spheroid component for BTB construction |
| Tissue Culture Plate Insert (0.4 μm, PET membrane), 12-well plates | Jet Biofil | TCS016012 | Porous cell culture insert used to construct the BBB/BTB co-culture model. |
| Transepithelial Electrical Resistance (TEER) Meter | Millicell | ERS-2 | Used to measure electrical resistance across the cell culture insert as a barrier-integrity readout. |
| TrypLE Express (1×) (detach HBMECs and HA cells) | Gibco | 12605-010 | Used to detach HBMECs and HA cells during cell preparation. |
References
- Park M, et al. Breast cancer metastasis: mechanisms and therapeutic implications. Int J Mol Sci. 2022;23(12):6806. doi:10.3390/ijms23126806.
- Wang R, et al. The clinicopathological features and survival outcomes of patients with different metastatic sites in stage IV breast cancer. BMC Cancer. 2019;19(1):1091. doi:10.1186/s12885-019-6311-z.
- McConnell HL, Mishra A. Cells of the blood-brain barrier: an overview of the neurovascular unit in health and disease. Methods Mol Biol. 2022;2492:3–24.
- Dong X. Current strategies for brain drug delivery. Theranostics. 2018;8(6):1481–1493.
- Gril B, et al. Reactive astrocytic S1P3 signaling modulates the blood-tumor barrier in brain metastases. Nat Commun. 2018;9(1):2705. doi:10.1038/s41467-018-05030-w.
- Pitz MW, Desai A, Grossman SA, Blakeley JO. Tissue concentration of systemically administered antineoplastic agents in human brain tumors. J Neurooncol. 2011;104(3):629–638.
- Adkins CE, et al. Characterization of passive permeability at the blood-tumor barrier in five preclinical models of brain metastases of breast cancer. Clin Exp Metastasis. 2016;33(4):373–383.
- Lockman PR, et al. Heterogeneous blood-tumor barrier permeability determines drug efficacy in experimental brain metastases of breast cancer. Clin Cancer Res. 2010;16(23):5664–5678.
- Song H-T, et al. Rat model of metastatic breast cancer monitored by MRI at 3 tesla and bioluminescence imaging with histological correlation. J Transl Med. 2009;7:88. doi:10.1186/1479-5876-7-88.
- Miarka L, Valiente M. Animal models of brain metastasis. Neurooncol Adv. 2021;3(Suppl 5):v144–v156.
- Kim J-H, et al. Inflammatory mammary carcinoma with metastasis to the brain and distant organs in a spayed Shih Tzu dog. J Vet Diagn Invest. 2011;23(5):1079–1082.
- Wiese DA, Thaiwong T, Yuzbasiyan-Gurkan V, Kiupel M. Feline mammary basal-like adenocarcinomas: a potential model for human triple-negative breast cancer (TNBC) with basal-like subtype. BMC Cancer. 2013;13:403. doi:10.1186/1471-2407-13-403.
- Srinivasan B, et al. TEER measurement techniques for in vitro barrier model systems. J Lab Autom. 2015;20(2):107–126.
- Harding IC, et al. Developing a transwell millifluidic device for studying blood-brain barrier endothelium. Lab Chip. 2022;22(23):4603–4620.
- Liu X, et al. The role of neurovascular unit damage in the occurrence and development of Alzheimer’s disease. Rev Neurosci. 2019;30(5):477–484.
- Nikolakopoulou AM, et al. Pericyte loss leads to circulatory failure and pleiotrophin depletion causing neuron loss. Nat Neurosci. 2019;22(7):1089–1098.
- Bell RD, et al. Pericytes control key neurovascular functions and neuronal phenotype in the adult brain and during brain aging. Neuron. 2010;68(3):409–427.
Reprints and Permissions
This article has been published
Video Coming Soon