This cross-sectional study identifies extracellular water and trunk reactance, measured via bioelectrical impedance analysis, as independently associated with the dampness constitution. These quantifiable parameters suggest differences in body fluid status and trunk bioelectrical properties.
Research Article
Identification of Dampness Constitution Based on Bioimpedance Analysis: Independent Associations Between Extracellular Fluid and Trunk Reactance
75 views
⸱
September 11th, 2026
In This Article
Summary
Abstract
This study aimed to identify objective bioelectrical impedance analysis (BIA) parameters independently associated with the dampness constitution (phlegm-dampness and damp-heat constitutions) in Traditional Chinese Medicine (TCM), thereby providing candidate indicators for its objective identification. In this cross-sectional study, 232 participants (129 with the Harmonious constitution and 103 with the dampness constitution) were consecutively recruited from a community-based health screening program. Whole-body and segmental fluid distribution, bioelectrical parameters, and grip strength were measured. Core features were identified using Least Absolute Shrinkage and Selection Operator (LASSO) regression, and their independent associations with the dampness constitution were assessed using multivariable logistic regression; sex-stratified and sensitivity analyses (Winsorization and additional adjustment for waist-to-hip ratio or abdominal circumference) were also performed. LASSO identified five core features: left lower limb phase angle (PA_LL), trunk reactance (Reactance_TR), extracellular water (ECW), body fat percentage (PBF), and mean grip strength. In the multivariable model, ECW (OR = 1.307, 95% CI: 1.046–1.649, p = 0.021) and Reactance_TR (OR = 2.163, 95% CI: 1.124–4.267, p = 0.023) were independently and positively associated with the dampness constitution. In sex-stratified analyses, both associations were statistically significant in men (ECW: OR = 1.407, p = 0.038; Reactance_TR: OR = 2.764, p = 0.030) but not in women. Formal interaction testing did not support a statistically significant sex difference (sex × ECW: p = 0.573; sex × Reactance_TR: p = 0.605), suggesting that the apparent sex difference may reflect lower statistical power in the smaller female subgroup. The associations remained stable in all sensitivity analyses. In conclusion, ECW and Reactance_TR are two core BIA indices independently associated with the dampness constitution, suggesting trunk fluid retention and altered bioelectrical properties in affected individuals. These parameters constitute preliminary candidate indicators for the objective identification of the dampness constitution and require validation in independent populations.
Introduction
According to the theory of constitutional medicine in Traditional Chinese Medicine, an individual’s constitution constitutes the internal context for the onset, progression, and outcome of disease1. Among these, dampness constitutions (phlegm-damp and damp-heat constitutions) are common types of constitutional imbalance encountered in clinical practice2 and are significantly associated with an increased risk of adverse health outcomes such as metabolic disorders, frailty, and cardiovascular and metabolic diseases3,4. However, the current assessment of dampness constitutions primarily relies on questionnaire evaluations or the clinical judgment of TCM practitioners5, while the ability of BIA parameters to accurately determine an individual’s constitution remains to be verified.
BIA may provide potential indicators for effectively identifying body composition types. Previous studies have shown that body fluid distribution parameters derived from BIA, together with cell membrane function parameters, can go beyond traditional measures of muscle mass to more sensitively reflect the body’s functional status and long-term prognosis. For example, a BIA-derived extracellular water to intracellular water ratio (ECW/ICW) has been shown to be independently associated with all-cause mortality and adverse clinical outcomes6,7. An elevated extracellular water to total body water ratio (ECW/TBW) is also closely associated with lower limb functional decline and reduced muscle strength8. Furthermore, phase angle (PhA) and reactance (Xc), as markers of cell membrane integrity and body cell mass, offer unique advantages in monitoring early functional decline, malnutrition, and inflammatory states8,9,10. Of particular note is that local body fluid parameters can predict functional performance in specific regions more accurately than systemic indicators11,12, and that the direct use of raw parameters such as Xc may reflect changes in muscle function more directly than muscle mass estimated via equations13. These studies provide a solid theoretical basis for developing BIA-based methods to assess the dampness constitution.
Regarding constitutional typing, previous studies have attempted to correlate BIA parameters with TCM constitutions. Serum proteomics analysis has revealed differential expression of immune- and inflammation-related proteins in individuals with the dampness constitution2. Furthermore, the BIA-derived ECW/TBW ratio measured by BIA has been shown to be closely associated with functional decline and volume overload14, and an increase in BIA-derived extracellular water may be accompanied by elevated levels of inflammation15. Abnormalities in fluid metabolism and inflammatory states constitute key pathological mechanisms underlying the ‘viscous and turbid’ characteristics of the dampness constitution. However, studies have not systematically evaluated multidimensional BIA parameters specifically in relation to the dampness constitution, and the potential value of segmental raw electrical parameters remains largely unexplored. Therefore, investigating the independent association between multidimensional BIA parameters and the dampness constitution is expected to provide a new dimension for the objective identification of this constitution.
In summary, this study utilized a LASSO regression system to identify core BIA indicators independently associated with the dampness constitution and assessed the independent contribution of these selected indicators via multivariate logistic regression. Furthermore, sensitivity analyses were performed to explore potential differences in the associations between sexes. This provides a theoretical basis and candidate indicators for developing BIA-based measures that effectively identify the dampness constitution.
Protocol
This study was reviewed and approved by the Ethics Committee of the Shanghai Pudong New Area Beicai Community Health Service Center (approval no. 20250425AR; approved April 25, 2025). All participants provided written informed consent prior to inclusion.
Research design and study population
This cross-sectional study aimed to identify objective indicators associated with the dampness constitutions (Phlegm-Dampness and Damp-Heat) using BIA. Participants were recruited from a community-based health screening program conducted at the Beicai Community Health Service Center (Pudong New Area, Shanghai) between July 1, 2025, and January 5, 2026. All individuals who completed both the TCM constitution assessment and the BIA measurement during this period were enrolled consecutively. Participants with missing data on any key variable were excluded. A total of 232 participants were ultimately included, comprising 129 in the Harmonious constitution group and 103 in the dampness constitution group.
Diagnostic criteria for dampness constitution
Constitution assessment was carried out using a patented portable smart mirror for traditional Chinese medicine (TCM) constitution analysis (Hi-Face22; Chinese utility model patent No. ZL 2021 2 1286496.5), which applies the standardized nine-constitution classification framework of TCM and generates a quantified constitution diagnosis from facial features and built-in questionnaire responses. Participants identified as having the phlegm-damp or damp-heat constitution as the predominant type were included in the dampness constitution group; those meeting the criteria for the harmonious constitution and showing no other constitutional imbalance were included in the control group2. To our knowledge, peer-reviewed validation of this device against an independent reference standard (e.g., expert TCM assessment or a validated questionnaire) has not been published; this is acknowledged as a limitation.
BIA and body composition measurement
BIA measurements were performed using a multifrequency, eight-point tactile electrode segmental bioelectrical impedance analyzer (InBody 770, see Table of Materials), in strict accordance with the manufacturer's standard operating procedures. The device applies alternating currents at multiple frequencies (1, 5, 50, 250, 500, and 1,000 kHz) and is phase-sensitive, directly measuring resistance (R), reactance (Xc), and phase angle (PhA) for the whole body and five segments (right arm, left arm, trunk, right leg, left leg) via tetrapolar electrode configurations. Trunk resistance, reactance, and phase angle were measured between the right hand and right foot electrodes and recorded at 50 kHz. It should be noted that BIA devices directly measure bioelectrical parameters that are affected by body fluid and electrolyte status; the reported fluid volumes and body composition values are estimates derived from the device's prediction equations. Prior to measurement, subjects were required to fast for at least 2 h, avoid strenuous exercise for 12 h, and empty their bladders. During measurement, subjects stood barefoot on the foot electrodes and held the hand electrodes with both hands. The following body composition parameters were recorded: Total Body Water (TBW), Intracellular Water (ICW), Extracellular Water (ECW), ECW/TBW ratio (numerical value and percentage), TBW/Fat-Free Mass (TBW/FFM) ratio, Percentage of Body Fat (PBF), Body Fat Mass (BFM), Visceral Fat Area (VFA), Fat Mass Index (FMI), Obesity level, Skeletal muscle mass (SMM), Lean body mass (SLM), Fat-free mass (FFM), Body cell mass (BCM), Protein, Upper arm circumference (AMC), Basal metabolic rate (BMR). The following segmental bioelectrical parameters were recorded: Whole-body phase angle (PA_Whole), right upper limb phase angle (PA_RA), left upper limb phase angle (PA_LA), trunk phase angle (PA_TR), right lower limb phase angle (PA_RL), left lower limb phase angle (PA_LL), trunk impedance (Impedance_TR), trunk reactance (Reactance_TR). Simultaneously, the following anthropometric parameters were measured: height, weight, Body Mass Index (BMI), waist-to-hip ratio (WHR), abdominal circumference, and left and right calf circumferences.
Grip strength measurement
Grip strength was measured with a digital handgrip dynamometer (see Table of Materials). After two maximum isometric contractions on each hand, alternating between the left and right hands with a one-minute rest between contractions, the mean of the two trials of the dominant hand was calculated and used for analysis (Mean_Grip)
Statistical analysis
The overall analytical framework LASSO-based feature screening followed by multivariable logistic regression, with sex-stratified and sensitivity analyses) was defined a priori. However, the specific features entering the final model were determined by data-driven LASSO selection, and the sex-stratified and sensitivity analyses should be regarded as exploratory. No missing values were present for any of the variables included in the analysis. Continuous variables that followed a normal distribution were expressed as mean ± standard deviation; those that did not follow a normal distribution were expressed as median (interquartile range); categorical variables were expressed as frequency (percentage). Comparisons between groups were performed using the independent samples t-test, the Mann-Whitney U test, or the chi-squared test, with P < 0.05 considered statistically significant.
Subsequently, BIA features were screened using LASSO regression; the optimal penalty parameter λ was determined via 10-fold cross-validation, and features with non-zero coefficients at the λ that minimized the cross-validation error (λ.min) were selected. The model's discriminatory power was assessed using the area under the receiver operating characteristic curve (AUC). The 10-fold cross-validation procedure was used solely to select the LASSO penalty parameter λ and did not serve as validation of the final model; internal validation of the final model was performed using bootstrap optimism correction (1,000 resamples) and 5-fold cross-validation, and multicollinearity was assessed using the variance inflation factor (VIF), with values below five considered acceptable. Model calibration was assessed using the Hosmer–Lemeshow goodness-of-fit test and the bootstrap-corrected calibration slope. The clinical net benefit was evaluated using decision curve analysis (DCA). DCA was performed over the full threshold probability range of 0–1.0, with net benefit expressed relative to the 'treat all' and 'treat none' reference strategies. The clinical decision scenario was whether to recommend further assessment or intervention for the dampness constitution among community screening participants.
Subsequently, the features identified via LASSO screening, along with age and sex, were incorporated into a multivariable logistic regression model to assess the independent association of each indicator with the dampness constitution, yielding odds ratios (ORs) and 95% confidence intervals (CIs).
Subgroup analyses were conducted by sex to assess the stability of the associations. Sensitivity analyses included: (1) applying 1% and 99% Winsorization to continuous variables; and (2) additional adjustment for waist-to-hip ratio or abdominal circumference. All statistical analyses were performed using R version 4.5.2.
Results
Baseline characteristics
This study included 232 participants, comprising 129 (55.6%) in the Harmonious constitution group and 103 (44.4%) in the dampness constitution group (Table 1). There were no statistically significant differences between the two groups in terms of age, sex, or grip strength (P > 0.05). However, significant differences were observed between the dampness constitution group and the Harmonious constitution group in body composition indicators. The dampness constitution group exhibited significantly higher values for TBW (p = 0.024), ICW (p = 0.033), and ECW (p = 0.015) compared with the Harmonious constitution group, indicating that individuals with the dampness constitution have a higher fluid content. Concurrently, the dampness constitution group exhibited significant increases in SMM (p = 0.032), SLM (p = 0.028), FFM (p = 0.026), and BCM (p = 0.033), suggesting a greater abundance of lean body mass. In addition, Protein (p = 0.032) and upper-arm muscle circumference (AMC; p = 0.044) were significantly higher in the dampness constitution group than in the harmonious constitution group. Furthermore, the BMR of the dampness constitution group was significantly elevated (p = 0.026), consistent with their higher levels of lean body mass. Regarding fat distribution, although there were no significant differences between the two groups in terms of PBF and BMI, the VFA (p = 0.048) and abdominal circumference (p = 0.044) in the dampness constitution group were both significantly higher than those in the Harmonious constitution group, suggesting a characteristic tendency towards central fat distribution in the dampness constitution. It is worth noting that although ECW differed significantly between the two groups, the ECW/TBW ratio showed no statistically significant difference (p = 0.228), suggesting that the overall proportional structure of body fluid distribution was relatively stable. In the unadjusted descriptive comparison, no significant differences were found between the two groups regarding total and segmental bioimpedance and reactance values (e.g., Reactance_TR: 3.30 [3.00, 3.60] vs 3.30 [2.90, 3.70], p = 0.711). Notably, such univariate comparisons and the multivariable regression address different questions: a parameter may become significant after adjustment for covariates.
Feature selection and evaluation of predictive models based on LASSO regression
The cross-validation error curve and coefficient path plot for the LASSO regression are shown in Figure 1A,B. Under the λ.min criterion, the model ultimately identified five core features with non-zero regression coefficients (Table 2). The LASSO regression coefficients for each feature are as follows: PA_LL (coefficient = −0.315), Reactance_TR (coefficient = 0.291), ECW (coefficient = 0.185), PBF (coefficient = 0.018), and Mean_Grip (coefficient = 0.002). The predictive model constructed from these features yielded a receiver operating characteristic (ROC) curve with an area under the curve (AUC) of 0.657 (95% confidence interval: 0.587–0.727), indicating moderate discriminative power (Figure 2A). After bootstrap optimism correction (B = 1,000), the AUC was 0.607, and 5-fold cross-validation yielded an AUC of 0.585, suggesting a modest degree of overfitting optimism (Supplementary Table 1). Model calibration was adequate according to the Hosmer–Lemeshow test (χ2 = 8.882, df = 8, p = 0.352), although the bootstrap-corrected calibration slope of 0.696 suggested some optimism (Supplementary Table 1). VIF values for all predictors in the final model ranged from 1.55 to 3.77, indicating no problematic multicollinearity (Supplementary Table 2). In the decision curve analysis (Figure 2B), the model's net benefit curve lay above the 'treat none' reference line for threshold probabilities up to approximately 0.55, but remained below the 'treat all' reference line across the entire evaluated threshold probability range (0–1.0); above approximately 0.6, the model's net benefit fell below zero. These results indicate that the model's clinical utility is limited within this sample.
Factors independently associated with the dampness constitution: ECW and Reactance_TR
To further identify independent factors associated with the dampness constitution, this study incorporated the five core features identified by LASSO regression (ECW, PBF, PA_LL, Reactance_TR, and Mean_Grip), along with age and sex, into a multivariate logistic regression model. The results showed that ECW and Reactance_TR were independently associated with the dampness constitution (Table 3). Specifically, for every one litre increase in ECW, the odds of being classified as having the dampness constitution increased by 30.7% (OR = 1.307, 95% CI: 1.046–1.649, p = 0.021). Expressed per one standard deviation of ECW (2.14 L), the odds ratio was 1.774 (95% CI: 1.100–2.916). Reactance_TR also demonstrated a significant independent positive association (OR = 2.163, 95% CI: 1.124–4.267, p = 0.023). In contrast, PBF, PA_LL, and Mean_Grip did not reach statistical significance after adjusting for covariates (P > 0.05).
Sex-stratified analyses of independently associated factors
To investigate the stability of the aforementioned association indicators across sex subgroups, this study conducted multivariate logistic regression analyses stratified by sex. In the male subgroup, the independent associations of ECW and Reactance_TR were maintained. Specifically, the odds of the dampness constitution in men increased by 40.7% per one-unit increase in ECW (OR = 1.407, 95% CI: 1.030–1.974, p = 0.038); the OR for Reactance_TR was as high as 2.764 (95% CI: 1.140–7.255, p = 0.030). In contrast, PBF, PA_LL, and Mean_Grip remained non-statistically significant in the male subgroup (p > 0.05) (Table 4).
In the female subgroup, the associations were not statistically significant. Specifically, the effect of ECW was attenuated and no longer significant (OR = 1.353, 95% CI: 0.940–1.979, p = 0.108), the OR for Reactance_TR fell to 1.666 (95% CI: 0.578–4.960, p = 0.348), with neither reaching the statistical threshold. PBF, PA_LL, and Mean_Grip were also non-significant in the female subgroup (p > 0.05) (Table 5). However, formal interaction testing did not support a statistically significant difference between sexes (sex × ECW: OR = 1.127, 95% CI: 0.744–1.716, p = 0.573; sex × Reactance_TR: OR = 1.353, 95% CI: 0.428–4.282, p = 0.605), indicating that the apparent sex difference may reflect the smaller female subgroup and reduced statistical power rather than a true difference in the associations (Supplementary Table 3).
To assess the robustness of the above associations, this study conducted a sensitivity analysis. Following Winsorization, ECW still maintained an independent positive association with the dampness constitution (OR = 1.331, 95% CI: 1.055–1.694, p = 0.018), and the effect of Reactance_TR also remained statistically significant (OR = 2.321, 95% CI: 1.182–4.682, p = 0.016). In the winsorized analysis, PBF and PA_LL showed borderline P values (0.053 and 0.056) with effect estimates of OR = 1.054 (95% CI: 1.000–1.113) and OR = 0.592 (95% CI: 0.342–1.006), respectively (Table 6); after additional adjustment for waist-to-hip ratio, both reached nominal significance (PBF: OR = 1.086, 95% CI: 1.005–1.178, p = 0.040; PA_LL: OR = 0.574, 95% CI: 0.335–0.964, p = 0.039; Supplementary Table 4). These less stable results should be interpreted with caution. Furthermore, the independent associations of ECW and Reactance_TR remained statistically significant after additional adjustment for waist-to-hip ratio or abdominal circumference in separate sensitivity analyses (Supplementary Tables 4 and 5). Taken together, the three sensitivity analyses showed that the independent associations of ECW and Reactance_TR remained statistically significant across all settings, with no change in direction or loss of significance after Winsorization of continuous variables or adjustment for additional potential confounding factors.
Data Availability:
All raw data and analyzed datasets generated during this study are publicly available in the Zenodo repository at https://doi.org/10.5281/zenodo.21187319.
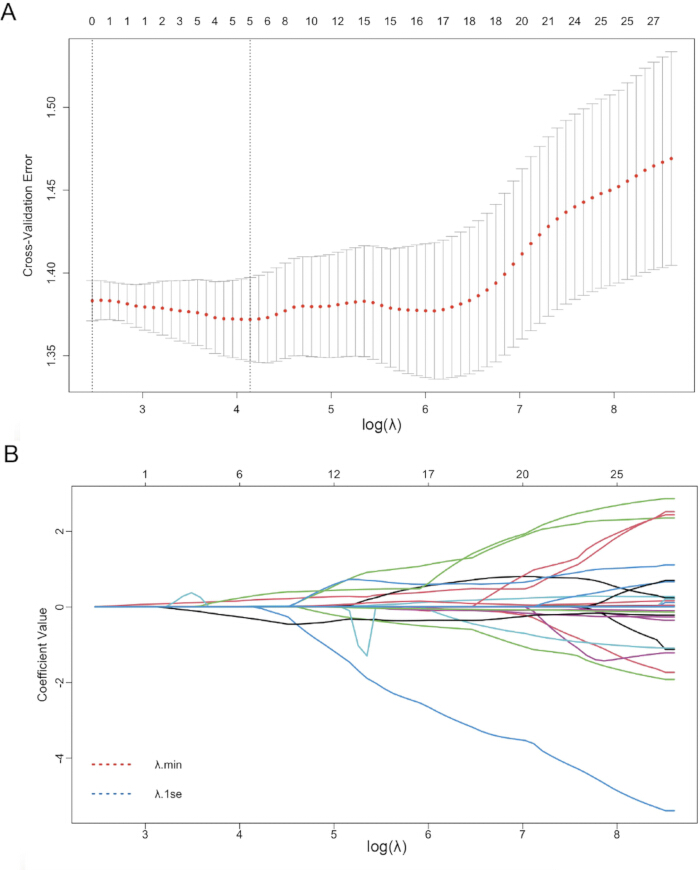
Figure 1: Feature selection process for the LASSO regression model. (A) Error curves for the LASSO regression model based on 10-fold cross-validation. The x-axis represents the log(λ) values, and the y-axis represents the cross-validation error; vertical error bars represent the standard error of the cross-validation error (binomial deviance) across the 10 folds; the two vertical dotted lines indicate λ.min (the λ value corresponding to the minimum cross-validation error) and λ.1se (the λ value corresponding to the simplest model within one standard error of λ.min); features were selected using λ.min. (B) Coefficient path diagram of the LASSO regression model. The x-axis represents log(λ) values, and the y-axis represents the regression coefficients of each feature; as λ increases, the coefficients of irrelevant variables are gradually shrunk to 0, ultimately selecting five features with non-zero coefficient values under the λ.min criterion. Please click here to view a larger version of this figure.
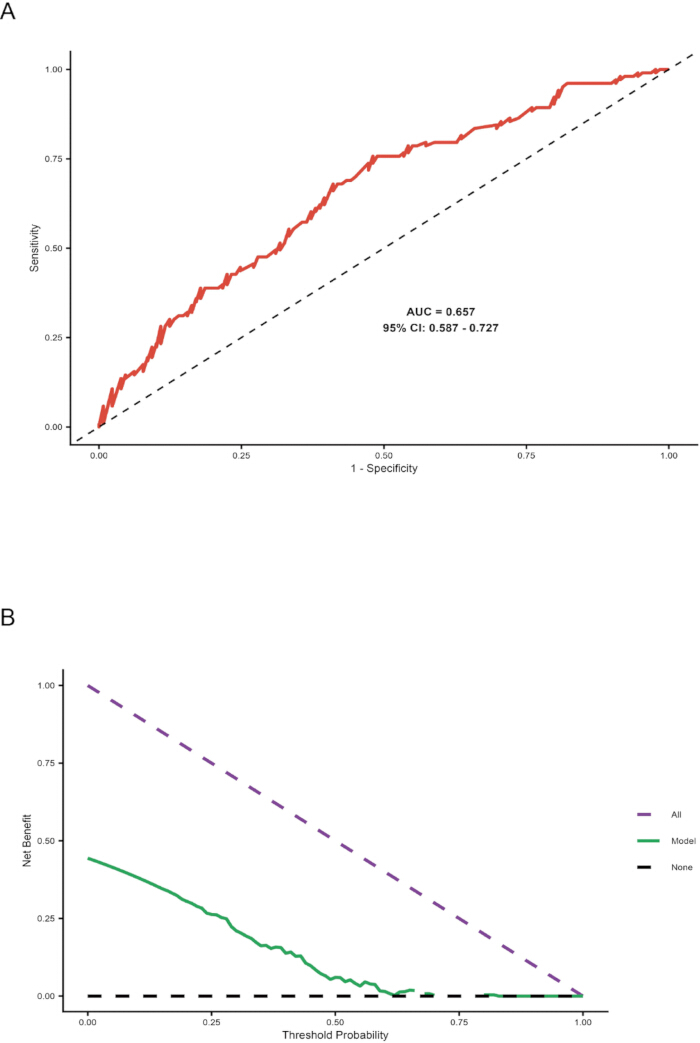
Figure 2: Assessment of the predictive model’s discriminatory power and clinical utility. (A) ROC curve. The model’s AUC was 0.657 (95% CI: 0.587–0.727). (B) DCA over the threshold probability range 0–1.0. The purple dashed line and the black dashed line represent the 'treat all' and 'treat none' reference strategies, respectively, and the green solid line represents the model. The model's net benefit curve lay above the 'treat none' reference line for threshold probabilities up to approximately 0.55 and fell below zero above approximately 0.6; it remained below the 'treat all' reference line throughout the entire range. Please click here to view a larger version of this figure.
Table 1: Baseline characteristics of the study population stratified by constitution. Demographic, anthropometric, body composition, bioelectrical, and grip-strength characteristics are compared between participants with the Harmonious constitution and those with the dampness constitution. Data are presented as mean ± standard deviation, median [interquartile range], or n (%), as appropriate. Abbreviations: TBW = total body water; ICW = intracellular water; ECW = extracellular water; PBF = percentage of body fat; BFM = body fat mass; VFA = visceral fat area; FMI = fat mass index; SMM = skeletal muscle mass; SLM = soft lean mass; FFM = fat-free mass; BCM = body cell mass; AMC = arm muscle circumference; BMR = basal metabolic rate; BMI = body mass index; WHR = waist-to-hip ratio; AC = abdominal circumference; PA = phase angle; IQR = interquartile range. Please click here to download this file.
Table 2: Key features selected by LASSO regression and their regression coefficients. Five features with non-zero coefficients were selected using the λ.min criterion in the LASSO regression analysis. Abbreviations: LASSO = least absolute shrinkage and selection operator; PA_LL = left lower limb phase angle; Reactance_TR = trunk reactance; ECW = extracellular water; PBF = percentage of body fat; Mean_Grip = mean grip strength. Please click here to download this file.
Table 3: Multivariable logistic regression analysis of factors associated with the dampness constitution. The associations of the LASSO-selected features with the dampness constitution were evaluated after adjustment for age and sex. Abbreviations: OR = odds ratio; CI = confidence interval; ECW = extracellular water; PBF = percentage of body fat; PA_LL = left lower limb phase angle; Reactance_TR = trunk reactance; Mean_Grip = mean grip strength. Please click here to download this file.
Table 4: Multivariable logistic regression analysis of factors associated with the dampness constitution in men. Associations between the selected features and the dampness constitution were evaluated in the male subgroup after adjustment for age.
Abbreviations: OR = odds ratio; CI = confidence interval; ECW = extracellular water; PBF = percentage of body fat; PA_LL = left lower limb phase angle; Reactance_TR = trunk reactance; Mean_Grip = mean grip strength. Please click here to download this file.
Table 5: Multivariable logistic regression analysis of factors associated with the dampness constitution in women. Associations between the selected features and the dampness constitution were evaluated in the female subgroup after adjustment for age.
Abbreviations: OR = odds ratio; CI = confidence interval; ECW = extracellular water; PBF = percentage of body fat; PA_LL = left lower limb phase angle; Reactance_TR = trunk reactance; Mean_Grip = mean grip strength. Please click here to download this file.
Table 6: Multivariable logistic regression analysis following Winsorization. Sensitivity analysis evaluated factors associated with the dampness constitution after applying 1% and 99% Winsorization to continuous variables. Abbreviations: OR = odds ratio; CI = confidence interval; ECW = extracellular water; PBF = percentage of body fat; PA_LL = left lower limb phase angle; Reactance_TR = trunk reactance; Mean_Grip = mean grip strength. Please click here to download this file.
Supplementary Table 1: Internal validation and calibration of the final multivariable logistic regression model. Model performance was evaluated using apparent and optimism-corrected discrimination, 5-fold cross-validation, goodness-of-fit testing, and bootstrap calibration. The ECW association per one standard deviation is also reported.
Abbreviations: AUC, area under the receiver operating characteristic curve; CI = confidence interval; ECW, extracellular water; OR, odds ratio; df, degrees of freedom.Please click here to download this file.
Supplementary Table 2: Variance inflation factors for predictors in the final multivariable logistic regression model. Variance inflation factors were calculated to assess multicollinearity among predictors included in the final model.
Abbreviations: VIF = variance inflation factor; ECW = extracellular water; PBF = percentage of body fat; PA_LL = left lower limb phase angle; Reactance_TR = trunk reactance; Mean_Grip = mean grip strength.Please click here to download this file.
Supplementary Table 3: Interaction of sex with extracellular water and trunk reactance for the dampness constitution. Interaction terms were evaluated to determine whether the associations of extracellular water and trunk reactance with the dampness constitution differed by sex.
Abbreviations: ECW = extracellular water; OR = odds ratio; CI = confidence interval; LRT = likelihood ratio test; Reactance_TR = trunk reactance.Please click here to download this file.
Supplementary Table 4: Multivariable logistic regression analysis after adjustment for waist-to-hip ratio. Sensitivity analysis evaluated the associations of the selected features with the dampness constitution after additional adjustment for waist-to-hip ratio.
Abbreviations: OR = odds ratio; CI = confidence interval; ECW = extracellular water; PBF = percentage of body fat; PA_LL = left lower limb phase angle; Reactance_TR = trunk reactance; Mean_Grip = mean grip strength; WHR = waist-to-hip ratio.Please click here to download this file.
Supplementary Table 5: Multivariable logistic regression analysis after adjustment for abdominal circumference. Sensitivity analysis evaluated the associations of the selected features with the dampness constitution after additional adjustment for abdominal circumference.
Abbreviations: OR = odds ratio; CI = confidence interval; ECW = extracellular water; PBF = percentage of body fat; PA_LL = left lower limb phase angle; Reactance_TR = trunk reactance; Mean_Grip = mean grip strength.Please click here to download this file.
Discussion
This study investigated the potential identification of the dampness constitution in Traditional Chinese Medicine using BIA parameters. Through systematic screening and correlation analysis, ECW and Reactance_TR were identified as core indicators independently associated with the dampness constitution. These associations remained stable across all sensitivity analyses. In sex-stratified analyses, they were statistically significant in men but not in women, and formal interaction testing did not support a statistically significant sex difference, providing key candidate indicators and a theoretical basis for a BIA-based constitution identification approach.
The key finding of this study is that ECW was independently associated with the dampness constitution, which is highly consistent with existing pathophysiological understanding. Elevated ECW levels directly reflect abnormalities in the body’s fluid metabolism and potential fluid retention, which precisely correspond to the characteristics of dampness being heavy, turbid and viscous8. Our results extend the application of BIA parameters from the traditional field of functional decline to the identification of TCM constitutions. Previous studies have confirmed that in patients with chronic inflammatory diseases such as rheumatoid arthritis, the BIA-derived ECW ratio is significantly elevated, and this state of volume overload is insensitive to short-term anti-inflammatory treatment, reflecting the pathological characteristics of dampness being viscous and tenacious, with a protracted and difficult-to-cure course15. This study also observed a similar association in a relatively healthy community population, suggesting that ECW may serve as a sensitive, early biophysical biomarker for detecting the subclinical state of dampness. It should be noted that BIA-derived fluid-volume and body-composition estimates, including those of the InBody 770, may show inconsistent agreement with reference methods (e.g., dilution methods or DXA) across populations, particularly in individuals with disease-related localized fluid accumulation; the present population was relatively healthy community-dwelling adults, and these estimates should be interpreted accordingly.
More importantly, this study identified that the association between Reactance_TR and dampness constitution, among numerous BIA parameters, is independent of ECW. An apparent discrepancy should be noted: trunk reactance showed virtually no between-group difference in the unadjusted comparison (p = 0.711), yet was independently associated with the dampness constitution in the multivariable model. This is not a statistical inconsistency—univariate comparisons and multivariable regression address different questions, and the adjusted association emerged after controlling for age, sex, and other body-composition variables; VIF values were all below five, indicating that multicollinearity did not materially influence the estimate. Reactance reflects the capacitive properties of cell membranes and depends on tissue electrical properties, measurement frequency, segment geometry, and tissue composition; it is not a direct measurement of cell membrane integrity16,17,18. The InBody device reports reactance values in a series-equivalent circuit model, and the physiological interpretation of series Xc measurements depends on the equivalent circuit configuration19,20. The positive association of trunk reactance with the dampness constitution should therefore be regarded as a statistical association with a plausible—but not established—physiological hypothesis, such as altered trunk tissue electrical properties or fluid distribution, rather than direct evidence of impaired cell membrane function. Just as ECW/ICW in the thighs most accurately reflects lower limb function12, the association of a trunk-specific electrical parameter may provide a basis for further investigation of whether segmental bioelectrical characteristics relate to the traditional concept of ‘dampness obstructing the middle jiao’11,13. These findings strongly resonate with the research philosophy of ‘looking not only at the whole body, but also at specific segments’11, and fill the gap in existing research where trunk segment parameters are commonly overlooked21. Furthermore, Xc (an indicator independent of hydration status that directly reflects cellular health) effectively avoids overestimating muscle mass when using conventional BIA equations under conditions of fluid imbalance22, thereby ensuring the accuracy of physical constitution assessment. In contrast, no independent association was observed for phase angle, which is consistent with its composite nature: although PhA is widely regarded as a marker of systemic cellular health and prognosis21,23, its independent associations often attenuate after adjustment for confounders, whereas segmental raw parameters such as Xc and ECW may capture more specific bioelectrical and fluid dimensions24,25.
In sex-stratified analyses, the associations of ECW and Reactance_TR with the dampness constitution were statistically significant in men but not in women. However, formal interaction testing did not support a statistically significant sex difference (sex × ECW: p = 0.573; sex × Reactance_TR: p = 0.605), and the apparent difference may reflect the smaller female subgroup and reduced statistical power. Sex-related differences in the bioelectrical basis of the dampness constitution, therefore, remain an open question; the previously reported sex differences in the determinants of phase angle and body-fluid parameters suggest that this question warrants investigation in adequately powered studies26,27.
Furthermore, this study has several limitations. First, the cross-sectional design precludes causal or temporal inferences; the reported associations should be interpreted as odds/associations, not risks. Second, the outcome was defined by the classification of a commercial device (Hi-Face22) whose validity against an independent reference standard has not been established; the identified parameters are therefore correlates of the device-derived classification, and classification error may have influenced the results; constitution could be determined in the future by combining more objective biochemical or omics 'gold standards'. Third, features were selected from a relatively large number of BIA parameters using data-driven LASSO regression on the same dataset used for model estimation; although internal validation was performed (bootstrap optimism correction and 5-fold cross-validation), yielding a corrected AUC of 0.607, the reported measures of association and discrimination may still be optimistically biased, and no external validation was conducted. Fourth, the sample size, particularly in the sex-stratified analyses, was limited and was not based on a formal a priori power calculation; the null findings in women may reflect insufficient power rather than a true absence of association. Finally, all BIA-based estimates of fluid and body composition rely on predictive equations and are affected by fluid and electrolyte status; physiological interpretations should be made with caution.
This study found that, among the BIA parameters evaluated, total ECW and Reactance_TR were independently associated with the dampness constitution, and these associations remained consistent across sensitivity analyses. These findings suggest that body fluid status and segmental bioelectrical properties may provide candidate quantitative measures relevant to the dampness constitution. Further studies with larger, independent populations and externally validated constitution assessments are required to confirm these associations and determine their potential utility in BIA-based constitution assessment.
Disclosures
No artificial intelligence tools were used in the preparation of the manuscript, figures, or data analysis.
Acknowledgements
We thank the participants and medical staff at the Beicai Community Health Service Center for their invaluable support during data collection. This work was supported by the Characteristic Special Disease Construction Project of Pudong New Area Health System for Obesity (Grant No. PWZzb2025-03), approved by the Pudong New Area Health Commission of Shanghai, and the Standardization Project of Traditional Chinese Medicine of Shanghai for Standardized Integrated Chinese and Western Medicine Diagnosis and Treatment Scheme for Prevention and Treatment of Metabolic Syndrome (Grant No. 2025BZ025), jointly approved by the Shanghai Municipal Health Commission and the Shanghai Municipal Administration of Traditional Chinese Medicine.
Materials
| Name | Company | Catalog Number | Comments |
|---|---|---|---|
| Digital grip strength meter | ANTA | EH101 | N/A |
| Hi-Face22 smart mirror | Beijing Xima Medical Technology Co., Ltd. | ZL202121286496.5 | N/A |
| InBody 770 body composition analyzer | InBody Co., Ltd. | 770 | N/A |
| R statistical software (version 4.5.2) | R Foundation for Statistical Computing | https://www.r-project.org/ | RRID:SCR_001905 |
References
- Wu Y, et al. Prevalence of traditional Chinese medicine body constitutions in a large community-based study in Hangzhou, China. Chin Med. 2025;20.
- Tan F, et al. Differences in serum proteins in traditional Chinese medicine constitutional population: analysis and verification. J Leukoc Biol. 2020;108:547-57.
- Ma X, et al. Traditional Chinese medicine constitution is associated with the frailty status of older adults: a cross-sectional study in the community. Evid Based Complement Alternat Med. 2022;2022.
- Chen R, et al. Traditional Chinese medicine constitution and cardiometabolic multimorbidity: a nationwide cross-sectional study in older adults. Front Public Health. 2026;14.
- Fu C, et al. Identification and classification of traditional Chinese medicine syndrome types among senior patients with vascular mild cognitive impairment using latent tree analysis. J Integr Med. 2017;15:186-200.
- Ohashi Y, et al. The associations of malnutrition and aging with fluid volume imbalance between intra- and extracellular water in patients with chronic kidney disease. J Nutr Health Aging. 2015;19:986-93.
- Iwasaka C, et al. Association between the appendicular extracellular-to-intracellular water ratio and all-cause mortality: a 10-year longitudinal study. J Gerontol A Biol Sci Med Sci. 2024;79.
- Noritake K, et al. Associations of muscle quality indices (phase angle, ECW/TBW, and echo intensity) with physical performance in community-dwelling older women. Nutrition. 2026;147.
- Kato M, et al. Bioimpedance phase angle is independently associated with myosteatosis: the Shizuoka study. Clin Nutr. 2023;42:793-9.
- Zouridakis A, et al. Correlation of bioelectrical impedance analysis phase angle with changes in oxidative stress on end-stage renal disease patients, before, during, and after dialysis. Ren Fail. 2016;38:738-43.
- Asano Y, Tsuji T, Okura T. Segmental extracellular-to-intracellular water resistance ratio and physical function in older adults. Exp Gerontol. 2023;181.
- Yamada Y, et al. The extracellular to intracellular water ratio in upper legs is negatively associated with skeletal muscle strength and gait speed in older people. J Gerontol A Biol Sci Med Sci. 2017;72:293-8.
- Kolodziej M, Ignasiak Z. Changes in the bioelectrical impedance parameters estimating appendicular skeletal muscle mass in healthy older persons. Aging Clin Exp Res. 2020;32:1939-45.
- Tanaka S, et al. Higher extracellular water-to-total body water ratio more strongly reflects the locomotive syndrome risk and frailty than sarcopenia. Arch Gerontol Geriatr. 2020;88.
- Straub R, et al. Increased extracellular water measured by bioimpedance and by increased serum levels of atrial natriuretic peptide in RA patients-signs of volume overload. Clin Rheumatol. 2017;36:1041-51.
- Freitas S, et al. The impact of 2 weeks of detraining on phase angle, BIVA patterns, and muscle strength in trained older adults. Exp Gerontol. 2021;144.
- Kolodziej M, Ignasiak Z, Ignasiak T. Annual changes in appendicular skeletal muscle mass and quality in adults over 50 y of age, assessed using bioelectrical impedance analysis. Nutrition. 2021;90.
- Nescolarde L, Talluri A, Yanguas J, Lukaski H. Phase angle in localized bioimpedance measurements to assess and monitor muscle injury. Rev Endocr Metab Disord. 2023;24:415-28.
- Nescolarde L, et al. Relationship between bioimpedance vector displacement and renal function after a marathon in non-elite runners. Front Physiol. 2020;11:352.
- Lukaski HC, Talluri A. Phase angle as an index of physiological status: validating bioelectrical assessments of hydration and cell mass in health and disease. Rev Endocr Metab Disord. 2023;24:371-9.
- Wang Y, et al. Phase angle as a predictor of mortality in elderly patients with multimorbidity: a matched case-control study. PeerJ. 2024;12.
- Hamada R, et al. Evaluation of skeletal muscle indicators following allogeneic hematopoietic stem cell transplantation: verification of skeletal muscle mass adjustment. Support Care Cancer. 2026;34.
- Diniz N, et al. Relevance of standardized phase angle and bioelectrical impedance vectors in hospitalized older patients: a cohort study. Nutr Clin Pract. 2026;41:245-54.
- Lai T, et al. Elevated extracellular water to total body water ratio and low phase angle in relation to muscle function in middle-aged and older adults. J Int Soc Sports Nutr. 2025;22.
- Luo X, Cai B, Jin W. The prevalence rate of adult sarcopenic obesity and correlation of appendicular skeletal muscle mass index with body mass index, percent body fat, waist-hip ratio, basal metabolic rate, and visceral fat area. Metab Syndr Relat Disord. 2023;21:48-56.
- Jirku J, Krízová J. Phase angle in bioelectrical impedance: new perspectives in health and body composition assessment. Physiol Res. 2025;74:1007-19.
- Ferreira G, et al. Phase angle and its determinants among adolescents: influence of body composition and physical fitness level. Sci Rep. 2024;14.