This systematic review and meta-analysis of 14 comparative studies and 9,802 patients shows that intra-wound vancomycin powder is associated with lower odds of surgical site infection after spinal surgery (odds ratio 0.55; 95% confidence interval 0.44 to 0.70).
Research Article
Intra-wound Vancomycin Powder for Surgical Site Infection Prophylaxis in Spinal Surgery: A Systematic Review and Meta-analysis
In This Article
Summary
Abstract
Surgical site infection remains a consequential complication of spinal surgery despite intravenous antibiotic prophylaxis, maintenance of normothermia, glycemic control, and meticulous surgical technique. Applying vancomycin powder directly into the wound before closure achieves high local drug concentrations with minimal systemic absorption and was hypothesized to lower surgical site infection rates compared with standard intravenous prophylaxis alone. Five databases were searched through May 2026 for comparative studies of patients undergoing spinal surgery in which one group received intra-wound vancomycin powder at wound closure and a concurrent control group did not. Of 2,765 records, 700 remained after duplicate removal, 96 full texts were assessed, and 14 studies met all eligibility criteria, comprising 9,802 patients: 4,516 received vancomycin powder and 5,286 served as controls. Four studies were randomized trials and ten were nonrandomized cohorts. Odds ratios were pooled using the Mantel-Haenszel fixed-effect method, with random-effects estimates reported alongside. Risk of bias was assessed using the Cochrane Risk of Bias 2 (RoB 2) tool and Risk Of Bias In Non-randomized Studies - of Interventions (ROBINS-I), and certainty using Grading of Recommendations Assessment, Development and Evaluation (GRADE). Vancomycin powder was associated with lower odds of overall surgical site infection (odds ratio 0.55; 95% confidence interval 0.44 to 0.70), deep infection (0.50; 0.37 to 0.68), and superficial infection (0.55; 0.32 to 0.93). The direction of effect persisted across seven sensitivity analyses and a leave-one-out analysis, with no funnel plot asymmetry detected. However, the association was driven by nonrandomized studies; when restricted to the four randomized trials, it was no longer statistically significant (0.73; 0.45 to 1.18). Intra-wound vancomycin powder is therefore associated with fewer surgical site infections in spinal surgery, but the evidence is of moderate certainty, and adequately powered randomized trials remain necessary.
Introduction
Surgical site infection (SSI) is among the most burdensome complications of spinal surgery. Reported incidence ranges from approximately 1% after simple decompression to nearly 12% after instrumented fusion for trauma or deformity, and every episode carries a disproportionate clinical and economic cost through prolonged hospitalization, repeated debridement, extended intravenous antibiotic therapy, implant removal, delayed rehabilitation, and excess mortality1,2,3,4. Staphylococcus aureus, including methicillin-resistant strains, is the organism most frequently recovered from spinal SSI, and 15% to 25% of healthy adults are persistent asymptomatic nasal carriers whose own colonizing strain can contaminate the operative field3,5,6. Established preventive measures, namely a first- or second-generation cephalosporin given within 60 min of incision, normothermia, glycemic control, restricted operating room traffic, and meticulous technique, have reduced but not eliminated this risk, which is why adjunctive strategies continue to be sought1,7.
Topical antibiotic prophylaxis is one such strategy. Vancomycin powder placed in the wound bed immediately before closure is inexpensive, requires no special equipment, and produces wound concentrations far above the minimum inhibitory concentration for staphylococci while serum levels remain low, so the systemic toxicity that limits intravenous vancomycin is largely avoided8,9. Local delivery of antibiotics to the operative site has a long history in orthopedic and reconstructive surgery, and the approach is attractive here because standard cephalosporin prophylaxis fails to cover a substantial share of the organisms that ultimately cause SSI1,10,11,12. Reported doses range from 1 g to 2 g, or 1 g per 10 cm of incision13,14.
The evidence base is nevertheless inconsistent. Several cohort studies report marked reductions in infection8,15, whereas randomized trials have found no difference, and one randomized trial reported a shift toward Gram-negative organisms among the infections that still occurred16,17. Potential harms have also been raised: the acidic pH of reconstituted vancomycin may irritate local tissue, aseptic wound complications such as delayed healing and skin erosion have been described, osteoblast toxicity has been demonstrated in vitro, and selection of resistant organisms remains a theoretical concern18,19,20. The balance of benefit and harm is therefore not settled.
Previous syntheses do not resolve this uncertainty. The meta-analyses of Gande et al.21 and Bakhsheshian et al.22 were dominated by retrospective series, pooled spinal and non-spinal procedures, predated most of the randomized evidence, and did not separate the randomized from the nonrandomized signal. The present review addresses that gap in four ways. First, eligibility was restricted strictly to spinal procedures, and studies of arthroplasty, orthopedic trauma, and mixed neurosurgical cohorts were excluded rather than pooled. Second, four randomized trials published up to 2023 were included, allowing the randomized evidence to be analyzed separately from the observational evidence. Third, every included study was appraised with the design-appropriate instrument, the Cochrane Risk of Bias 2 (RoB 2) tool or Risk Of Bias In Non-randomized Studies - of Interventions (ROBINS-I), and the pooled estimate was stress-tested in seven prespecified sensitivity analyses and a leave-one-out analysis. Fourth, the full extracted dataset and the analysis code are released so that every reported figure can be recomputed. The objective was to estimate the effect of intra-wound vancomycin powder, compared with standard perioperative intravenous prophylaxis alone, on overall, deep, and superficial SSI in spinal surgery. The hypothesis was that vancomycin powder lowers the odds of SSI. The comparator was defined as patients undergoing spinal surgery who received standard perioperative intravenous prophylaxis according to institutional protocol and no intra-wound or topical antibiotic of any kind.
Protocol
Institutional review board approval and informed consent are not applicable to this study because it is a systematic review and meta-analysis of previously published aggregate data and involves no human participants, animals, or identifiable individual-level information. The review was not prospectively registered, and no separate review protocol was prepared. Because the review was not prospectively registered and no separate protocol was prepared, there were no registration- or protocol-based amendments to report.
An overview of the study workflow is shown in Figure 1.
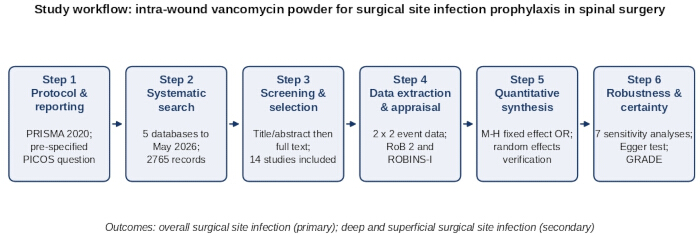
Figure 1: Overall workflow of the systematic review and meta-analysis. The diagram summarizes the six sequential stages of the study, from protocol and reporting standards through the systematic search, two-pass screening, duplicate data extraction and design-specific risk-of-bias appraisal, quantitative synthesis, and robustness and certainty assessment. The primary outcome was overall surgical site infection, and the secondary outcomes were deep and superficial surgical site infection. Abbreviations: GRADE, Grading of Recommendations Assessment, Development and Evaluation; M–H, Mantel–Haenszel; OR, odds ratio; RoB 2, Cochrane Risk of Bias 2 tool; ROBINS-I, Risk Of Bias In Non-randomized Studies - of Interventions.Please click here to view a larger version of this figure.
Protocol and reporting
Conduct and report the review in accordance with the Preferred Reporting Items for Systematic Reviews and Meta-Analyses (PRISMA) 2020 statement for systematic reviews and, for the nonrandomized component, the Meta-analysis Of Observational Studies in Epidemiology (MOOSE) recommendations23,24. Record the location of every PRISMA item in the completed checklist provided as Supplementary File 1. Define the review question in population, intervention, comparison, outcome, and study design (PICOS) terms before searching: population, patients undergoing any spinal surgical procedure; intervention, intra-wound vancomycin powder applied at wound closure; comparison, a concurrent control group receiving no intra-wound antibiotic; outcome, SSI; study design, comparative studies only.
Eligibility criteria
Include a study when all of the following criteria are met: the population underwent a spinal surgical procedure for any indication, including instrumented fusion, deformity correction, trauma, tumor, and degenerative disease; the intervention was intra-wound vancomycin powder applied at closure at any dose and by any method; a concurrent control group received no intra-wound vancomycin but otherwise identical perioperative care, including standard intravenous prophylaxis; the number of SSI events was reported for both arms, overall or by depth; and the design was comparative, that is, a randomized controlled trial or a prospective or retrospective cohort with a control group.
Exclude a study when the population did not undergo spinal surgery, when the design was noncomparative, such as a case series or single-arm study, when no SSI outcome was reported, when the cohort overlapped with that of a larger included study, or when the publication was a review, case report, letter, or duplicate. Apply the population criterion strictly: studies of arthroplasty, orthopedic trauma, or mixed neurosurgical cohorts are ineligible even when they evaluate the same intervention, and studies reporting a spinal subgroup that cannot be extracted separately are also ineligible. The studies excluded on these grounds are named, with reasons, in Supplementary File 2.
Information sources and search strategy
Search PubMed, Embase, Cochrane CENTRAL, Ovid MEDLINE, and Google Scholar from inception through May 2026, applying no lower date limit. Apply human and English-language limits to PubMed, Embase, and Ovid MEDLINE; apply no language or date limit to Cochrane CENTRAL; screen the first 200 Google Scholar records by relevance ranking. Build each strategy from controlled vocabulary and free-text terms for three concepts: intra-wound or topical vancomycin; spinal surgery; and surgical site infection. Combine synonyms within each concept with OR and the three concepts with AND. The complete search string executed in each database, together with the search date, limits applied, and number of records retrieved, is provided in Table 1. Export all records to reference management software, remove duplicates automatically, and then verify the deduplication manually. Record the per-database yield and every screening decision in the log provided as Supplementary File 3.
Table 1: Database search strategies. The table lists the complete search strategy as executed for each of the five databases, the search date, the limits and field tags applied, and the number of records retrieved. The strategies combine controlled vocabulary and free-text terms for intra-wound or topical vancomycin, spinal surgery, and surgical site infection. A total of 2,765 records were identified. Abbreviations: CENTRAL, Cochrane Central Register of Controlled Trials; exp, exploded term; MeSH, Medical Subject Headings; mp, multipurpose field; SSI, surgical site infection; tiab, title and abstract. Please click here to download this Table.
Study selection
Because this is a single-author review, one reviewer screened all records at every stage; no second reviewer was available, and this is acknowledged as a limitation. To reduce single-reviewer error, screen in two passes. In the first pass, assess the title and abstract of each unique record against the eligibility criteria and retrieve the full text of every record that is potentially eligible or uncertain. In the second pass, performed after an interval of at least 14 days and blinded to the first-pass decision, reassess every retrieved full text independently of the earlier judgment. Where the two passes disagree, resolve the discrepancy by returning to the primary report and documenting the final decision and its reason in Supplementary File 3. Two selection decisions and four event counts were amended in this way. Document the flow of records in a PRISMA 2020 diagram (Figure 2).
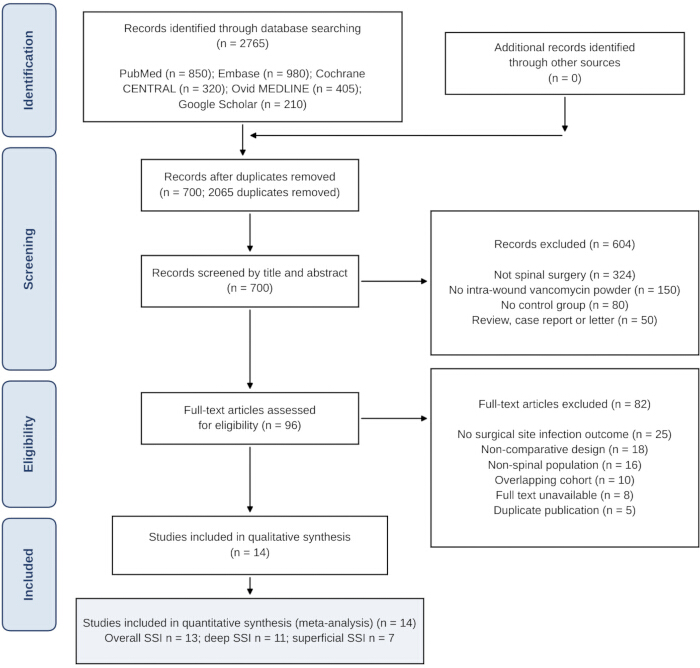
Figure 2: PRISMA 2020 flow diagram of study identification, screening, and inclusion. The diagram traces 2,765 records from five databases through removal of 2,065 duplicates, title and abstract screening of 700 records with 604 exclusions, and full-text assessment of 96 articles with 82 exclusions, resulting in 14 studies included in the qualitative and quantitative syntheses. Reasons for exclusion are itemized at each stage, and the number of studies contributing to each outcome is provided in the final box. Abbreviations: PRISMA, Preferred Reporting Items for Systematic Reviews and Meta-Analyses; SSI, surgical site infection; n, number of records or studies. Please click here to view a larger version of this figure.
Data extraction and verification
Extract data using a standardized form adapted from the Cochrane Consumers and Communication Review Group template and piloted on three randomly chosen studies before full extraction25. Record first author, year, country, design, sample size per arm, type of spinal procedure, vancomycin dose, application method, follow-up duration, the SSI definition used, and the number of overall, deep, and superficial SSI events in each arm. Extract every study twice, with the second extraction performed at least 14 days after the first and blinded to it, and reconcile any discrepancy against the primary report. When required data are missing, contact the corresponding author of the primary study by email up to twice over four weeks; if no reply is received, use the data as published, apply no imputation, and record the gap in the risk-of-bias assessment. The complete extracted dataset is provided as Supplementary File 4.
Outcome definitions and harmonization
Define the primary outcome as overall SSI, that is, any infection at the surgical incision meeting the Centers for Disease Control and Prevention/National Healthcare Safety Network (CDC/NHSN) criteria26. Define superficial SSI as infection confined to the skin or subcutaneous tissue within 30 days and deep SSI as infection involving fascial or muscle layers within 90 days, or within 1 year where an implant remains in situ. Treat overall SSI as the composite of the two.
Harmonize divergent definitions as follows. Accept any widely used definition, including CDC/NHSN, the ASEPSIS wound scoring system, or documented local surveillance criteria, and record which was used. Classify each definition as consistent with CDC/NHSN or as institutional, and test the influence of the latter in a sensitivity analysis. Where a study did not separate deep from superficial infection, count it only toward overall SSI. Where a study used a follow-up window shorter than the criteria above, retain it, record the shorter window, and acknowledge possible underascertainment.
Risk of bias assessment
Assess randomized trials with the Cochrane RoB 2 tool across five domains, namely the randomization process, deviations from intended interventions, missing outcome data, measurement of the outcome, and selection of the reported result, judging each as low risk, some concerns, or high risk and assigning an overall judgment using the RoB 2 algorithm27. Assess nonrandomized studies with ROBINS-I across seven domains, namely confounding, selection of participants, classification of interventions, deviations from intended interventions, missing data, measurement of outcomes, and selection of the reported result, rating each as low, moderate, serious, or critical28. Report domain-level judgments with supporting annotations and display them graphically as a traffic-light plot produced with a risk-of-bias visualization package29. Verify that the category counts sum exactly to the number of included studies. Do not use risk of bias to weight the analysis; use it instead to inform the exclusion-based sensitivity analysis and the GRADE certainty rating.
Statistical synthesis
Pool dichotomous data as odds ratios (OR) with 95% confidence intervals (CI) using the Mantel–Haenszel method30. Add a continuity correction of 0.5 to each cell of any study with a zero cell rather than discarding it, and test the influence of that correction in a sensitivity analysis. Quantify heterogeneity using the Cochran Q statistic and the I-squared index31.
Report both models for every outcome rather than selecting one on the basis of an I-squared threshold. Prespecify the Mantel–Haenszel fixed-effect model as the primary analysis and report the DerSimonian–Laird random-effects estimate alongside it32, because the Q statistic approached significance for two of the three outcomes and because clinical diversity is expected among predominantly nonrandomized studies. Regard a finding as robust only when both models agree in direction and statistical significance. Set two-tailed statistical significance at P < 0.05. Perform the primary analyses in dedicated meta-analysis software and verify every pooled estimate, heterogeneity statistic, and bias test independently in general-purpose statistical software; version and supplier details are provided in the Table of Materials, and the analysis code is provided as Supplementary File 5, with its output log provided as Supplementary File 6.
Sensitivity and subgroup analyses
Prespecify seven sensitivity analyses for the primary outcome: restriction to randomized trials; restriction to nonrandomized studies; exclusion of zero-event studies; exclusion of studies at serious risk of bias; exclusion of studies with baseline imbalance or with univariable findings not confirmed in a reported multivariable model; exclusion of studies not using CDC/NHSN definitions; and exclusion of the single largest study. Add a leave-one-out analysis in which each study is omitted in turn. Consider the pooled estimate robust only if the direction and statistical significance are preserved throughout. Plan subgroup analyses by vancomycin dose, surgical indication, use of instrumentation, and patient risk factors, and report them as not performed where the primary studies do not report outcomes stratified by those variables.
Publication bias and certainty of evidence
Assess small-study effects for the primary outcome by visual inspection of a funnel plot of log OR against its standard error and by the Egger linear regression test, treating P < 0.05 as evidence of asymmetry33. Rate the certainty of evidence for each outcome using the GRADE approach, downgrading for risk of bias, inconsistency, indirectness, imprecision, and publication bias34.
Results
Study selection
The search returned 2,765 records. Removal of 2,065 duplicates left 700 unique records, of which 604 were excluded at title and abstract screening. Of the 96 full texts assessed, 82 were excluded, most often because no SSI outcome was reported (n = 25), the design was noncomparative (n = 18), or the population was not spinal (n = 16). Fourteen studies published between 2011 and 2023 met every criterion and were included (Figure 2). The studies excluded at full text that readers are most likely to expect, including four arthroplasty or orthopedic trauma studies and one mixed neurosurgical study, are listed with reasons in Supplementary File 2.
Characteristics of the included studies
The 14 studies comprised 9,802 patients, of whom 4,516 received intra-wound vancomycin powder and 5,286 served as controls, with individual sample sizes ranging from 78 to 2,802 (Table 2). Four were randomized controlled trials16,17,35,36 and ten were nonrandomized cohorts, seven retrospective15,37,38,39,40,41,42 and three prospective observational18,43,44. All 14 studies evaluated spinal procedures only. The dose was 1 g in six studies, 1–2 g in five, and 1 g per 10 cm of incision in three; the powder was applied over the fascia, muscle, and subcutaneous tissue while avoiding the dura and bone graft in seven studies and directly over the exposed tissue in the remainder. Complication data could be extracted from only two studies: Tubaki et al. assessed adverse events and attributed none to vancomycin, and Sonbol et al. reported postoperative wound dehiscence. The remaining twelve studies did not report complication data, which is not equivalent to an affirmative report that no complications occurred.
Table 2: Characteristics of the 14 included studies. For each study, the table provides the first author and year, country, total sample size and number of patients in the vancomycin powder and control groups, study design, type of spinal surgery, vancomycin dose, vancomycin-related complications, and method of powder application. The 14 studies included 9,802 patients, comprising 4,516 who received intra-wound vancomycin powder and 5,286 controls. In the vancomycin-related complications column, “Assessed; none attributed to vancomycin” and “Assessed; wound dehiscence reported” indicate that the study reported complication data, whereas “Not reported” indicates that complication data were neither assessed nor reported in the primary study and does not represent an affirmative report that no complications occurred. Abbreviations: g, gram; N, total number of patients; n, number of patients. Please click here to download this Table.
Overall surgical site infection
Thirteen studies reported overall SSI in 9,644 patients; Adhikari et al. reported deep infection only and did not contribute39. Overall SSI occurred in 112 of 4,428 patients given vancomycin powder and 225 of 5,216 controls. The pooled odds were lower with vancomycin powder (OR 0.55; 95% CI 0.44 to 0.70; P < 0.001), with moderate heterogeneity (Q = 20.62, df = 12, P = 0.06; I2 = 42%), as shown in Figure 3. The random-effects estimate was concordant (OR 0.58; 95% CI 0.41 to 0.84; P = 0.003).
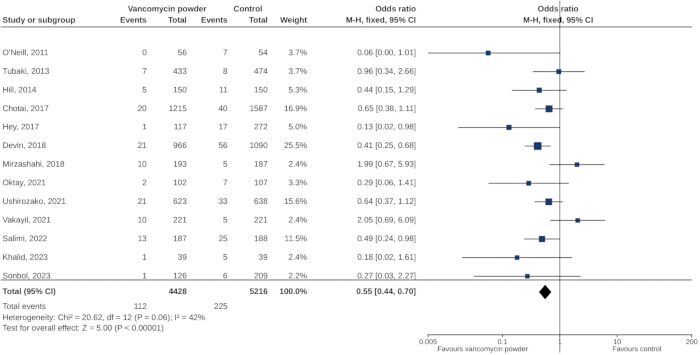
Figure 3: Forest plot of intra-wound vancomycin powder versus control for overall surgical site infection. Each row represents one study and shows the event counts, group sizes, Mantel–Haenszel weight, and odds ratio with 95% confidence interval. The square represents the study-specific point estimate, with its size proportional to the study weight, and the horizontal line represents the 95% confidence interval. The diamond represents the pooled fixed-effect estimate, and an odds ratio below 1 favors vancomycin powder. Heterogeneity statistics and the test for overall effect are shown below the plot. Abbreviations: CI, confidence interval; df, degrees of freedom; I2, inconsistency index; M–H, Mantel–Haenszel. Please click here to view a larger version of this figure.
Deep and superficial surgical site infection
Eleven studies reported deep SSI in 9,009 patients, with events in 60 of 4,158 treated patients and 139 of 4,851 controls, giving an OR of 0.50 (95% CI 0.37 to 0.68; P < 0.001), with moderate heterogeneity (Q = 18.56, df = 10, P = 0.05; I2 = 46%) and a concordant random-effects estimate (OR 0.54; 95% CI 0.32 to 0.91; P = 0.020), as shown in Figure 4. Seven studies reported superficial SSI in 3,551 patients, with events in 20 of 1,668 treated patients and 41 of 1,883 controls, giving an OR of 0.55 (95% CI 0.32 to 0.93; P = 0.027), with no observed heterogeneity (Q = 1.98, df = 6, P = 0.92; I2 = 0%), as shown in Figure 5. For this outcome, the random-effects estimate was of similar magnitude but did not reach statistical significance (OR 0.58; 95% CI 0.34 to 1.00; P = 0.051), so the superficial-infection result was the least secure of the three.
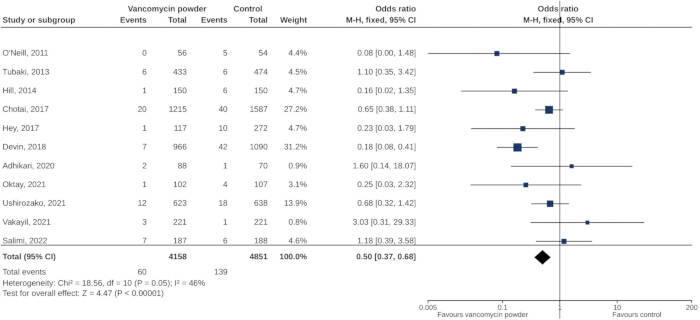
Figure 4: Forest plot of intra-wound vancomycin powder versus control for deep surgical site infection. Each row represents one study and shows the event counts, group sizes, Mantel–Haenszel weight, and odds ratio with 95% confidence interval. The square represents the study-specific point estimate, with its size proportional to the study weight, and the horizontal line represents the 95% confidence interval. The diamond represents the pooled fixed-effect estimate, and an odds ratio below 1 favors vancomycin powder. Heterogeneity statistics and the test for overall effect are shown below the plot. Abbreviations: CI, confidence interval; df, degrees of freedom; I2, inconsistency index; M–H, Mantel–Haenszel. Please click here to view a larger version of this figure.
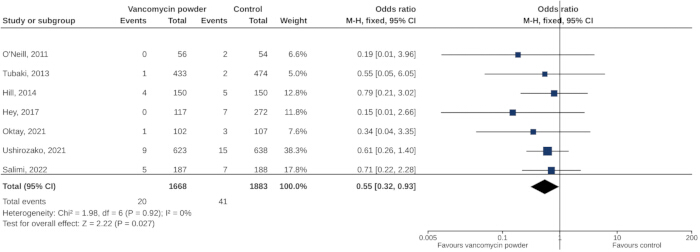
Figure 5: Forest plot of intra-wound vancomycin powder versus control for superficial surgical site infection. Each row represents one study and shows the event counts, group sizes, Mantel–Haenszel weight, and odds ratio with 95% confidence interval. The square represents the study-specific point estimate, with its size proportional to the study weight, and the horizontal line represents the 95% confidence interval. The diamond represents the pooled fixed-effect estimate, and an odds ratio below 1 favors vancomycin powder. Heterogeneity statistics and the test for overall effect are shown below the plot. Abbreviations: CI, confidence interval; df, degrees of freedom; I2, inconsistency index; M–H, Mantel–Haenszel. Please click here to view a larger version of this figure.
Risk of bias
Domain-level judgments for all 14 studies are given in Table 3 and displayed in Figure 6A,B. Of the four randomized trials, one was at low risk overall16 and three raised some concerns17,35,36, as detailed in Table 3. Of the ten nonrandomized studies, nine were at moderate risk and one at serious risk38, the latter because the groups differed substantially at baseline and no multivariable adjustment was reported. No study was rated critical. The category counts sum to 14, the total number of included studies.
Table 3: Domain-level risk-of-bias assessment for the 14 included studies. The upper section reports the four randomized controlled trials assessed across the five RoB 2 domains, and the lower section reports the ten nonrandomized studies assessed across the seven ROBINS-I domains. The overall judgment is provided in the final column. The four randomized trials comprised one study at low risk and three with some concerns; the ten nonrandomized studies comprised nine at moderate risk and one at serious risk. The lettered annotations indicate the reasons for judgments other than low risk: (a) blinding of outcome assessors was not described and the surgical site infection definition was not explicitly aligned with CDC/NHSN criteria, so ascertainment of the outcome could have been influenced by knowledge of the assigned intervention; (b) allocation concealment not described; (c) no published protocol or trial registration identified; (d) residual confounding, with no adjustment for diabetes, body mass index, or smoking status; (e) baseline imbalance between groups in procedure type, surgical level, or operative duration; (f) serious confounding, with substantial baseline differences between groups and no reported multivariable adjustment; (g) findings of univariable analysis not confirmed in a reported multivariable model; and (h) historical control group drawn from a different calendar period. Abbreviations: CDC, Centers for Disease Control and Prevention; NHSN, National Healthcare Safety Network; RoB 2, Cochrane Risk of Bias 2 tool; ROBINS-I, Risk Of Bias In Non-randomized Studies - of Interventions. Please click here to download this Table.
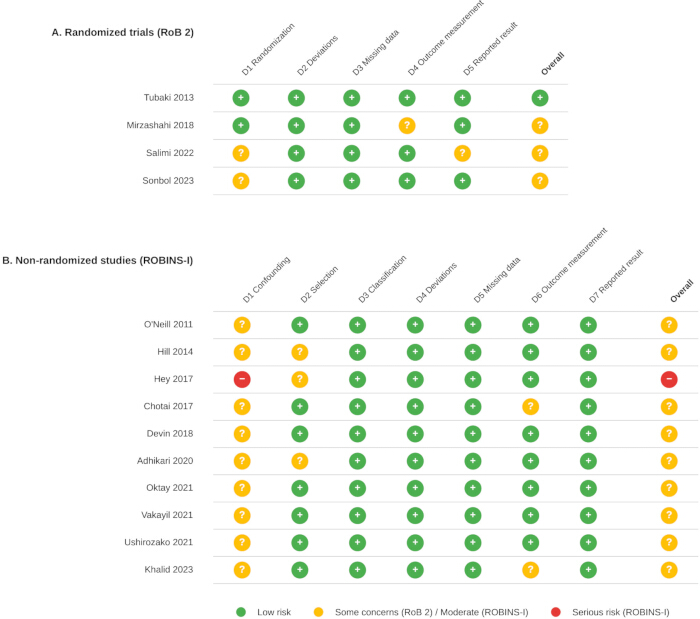
Figure 6: Risk-of-bias traffic-light plot for the 14 included studies.(A) The four randomized controlled trials were assessed using RoB 2 across five domains, with the overall judgment shown in the final column. (B) The ten nonrandomized studies were assessed using ROBINS-I across seven domains, with the overall judgment shown in the final column. Green indicates low risk, yellow indicates some concerns for RoB 2 or moderate risk for ROBINS-I, and red indicates serious risk for ROBINS-I. Supporting reasons for judgments other than low risk are provided in Table 3. Abbreviations: RoB 2, Cochrane Risk of Bias 2 tool; ROBINS-I, Risk Of Bias In Non-randomized Studies - of Interventions. Please click here to view a larger version of this figure.
Sensitivity, subgroup, and publication bias analyses
All seven sensitivity analyses are reported in full in Table 4. The pooled estimate was stable when zero-event studies were removed (OR 0.57; 95% CI 0.45 to 0.72), when the study at serious risk of bias was removed (OR 0.58; 95% CI 0.45 to 0.73), when the two studies with baseline imbalance or unconfirmed univariable findings were removed (OR 0.54; 95% CI 0.41 to 0.70), when studies without explicit CDC/NHSN definitions were removed (OR 0.53; 95% CI 0.41 to 0.69), and when the largest study was removed (OR 0.53; 95% CI 0.41 to 0.69). In the leave-one-out analysis, the pooled OR ranged from 0.52 (95% CI 0.41 to 0.66) to 0.60 (95% CI 0.46 to 0.78) and remained statistically significant throughout.
Table 4: Pooled estimates, sensitivity analyses, and publication bias assessment. The table reports the number of studies and patients, event counts in each group, fixed-effect and random-effects odds ratios with 95% confidence intervals and P values, and heterogeneity statistics for the primary and secondary outcomes and the seven prespecified sensitivity analyses. The leave-one-out analysis reports the range of fixed-effect estimates obtained by sequentially omitting each study. The Egger regression test assesses small-study effects for the primary outcome. Abbreviations: CDC, Centers for Disease Control and Prevention; CI, confidence interval; df, degrees of freedom; I2, inconsistency index; k, number of studies; n, number of patients; NHSN, National Healthcare Safety Network; OR, odds ratio; SE, standard error. Please click here to download this Table.
One sensitivity analysis changed the statistical conclusion. Restricted to the four randomized trials, the association was no longer statistically significant (OR 0.73; 95% CI 0.45 to 1.18; P = 0.199; I2 = 46%), whereas the nine nonrandomized studies alone yielded an OR of 0.51 (95% CI 0.39 to 0.66; P < 0.001). The pooled association was therefore driven principally by the observational evidence.
Subgroup analyses by vancomycin dose, surgical indication, use of instrumentation, and patient-level risk factors such as diabetes, obesity, and smoking could not be performed because no included study reported SSI stratified by these variables. The funnel plot for overall SSI was symmetrical on visual inspection, and the Egger test showed no evidence of asymmetry (intercept −0.62, standard error 0.78; t = −0.79; df = 11; P = 0.44), as shown in Figure 7; with 13 studies, however, the power of this test is limited.
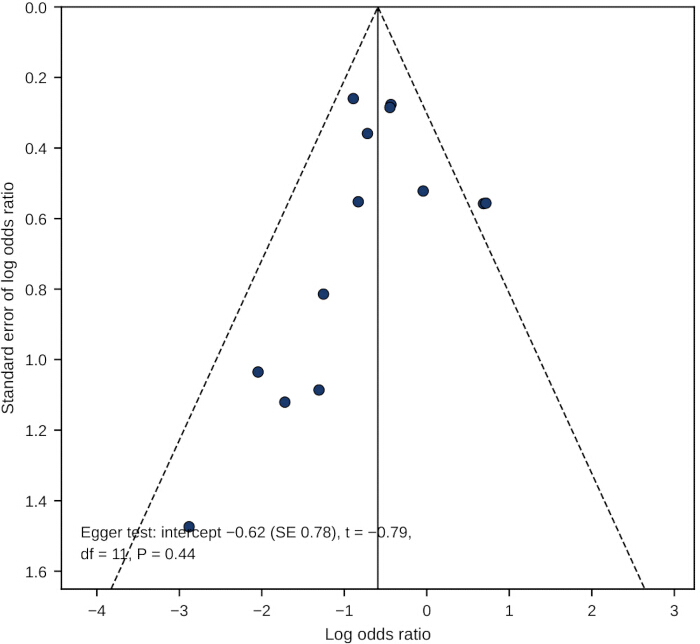
Figure 7: Funnel plot and Egger test for the primary outcome. Each point represents one of the 13 studies contributing to the analysis of overall surgical site infection and is plotted as the log odds ratio against its standard error. The solid vertical line represents the pooled estimate, and the dashed lines represent the pseudo 95% confidence limits. The Egger regression test is reported within the plot. Abbreviations: df, degrees of freedom; SE, standard error. Please click here to view a larger version of this figure.
The data presented above support three conclusions and no more. First, across 14 comparative studies and 9,802 patients, intra-wound vancomycin powder was associated with approximately 45% lower pooled odds of overall SSI after spinal surgery, with similar associations for deep and superficial infection. Second, the association remained statistically significant after exclusion of zero-event studies, the study at serious risk of bias, studies with divergent outcome definitions, and the largest study, and throughout the leave-one-out analysis; no funnel plot asymmetry was detected, although the power to detect asymmetry was limited. Third, the association rests principally on nonrandomized evidence because the randomized subset alone did not reach statistical significance; by GRADE, the certainty is moderate for overall and deep SSI, downgraded for risk of bias arising from the predominantly observational designs, and low for superficial SSI, downgraded additionally for imprecision. No claim about specific high-risk subgroups is supported by these data because no subgroup analysis could be performed.
Data Availability:
All materials underlying this systematic review and meta-analysis are provided with the article as supplementary files; no data are withheld, and no request to the author is required to obtain them. Supplementary File 1 contains the completed PRISMA 2020 checklist, indicating where each applicable reporting item is addressed in the manuscript. Supplementary File 2 contains selected studies excluded at full-text assessment and the reason for each exclusion, with the complete accounting of full-text exclusions provided in Supplementary File 3. Supplementary File 3 contains the search and screening log, including database-specific search yields and screening information. Supplementary File 4 contains the extracted study-level dataset for the 14 included studies, including data for the overall, deep, and superficial surgical site infection outcomes. Supplementary File 5 contains the R analysis code for the primary and secondary outcome analyses, sensitivity analyses, leave-one-out analysis, and publication-bias assessment. Supplementary File 6 contains the corresponding statistical analysis output log, including pooled estimates, heterogeneity statistics, sensitivity analyses, leave-one-out results, and the Egger regression test. Together, these supplementary materials provide the reporting documentation, screening records, extracted data, analysis code, and statistical output supporting the review. Correspondence regarding these materials should be addressed to Deng Xianjun (Dxj7018@wchscu.edu.cn).
Supplementary File 1: PRISMA 2020 checklist.
Completed PRISMA 2020 checklist indicating where each applicable reporting item is addressed in the manuscript. Please click here to download this file.
Supplementary File 2: Selected studies excluded at full-text assessment. Selected studies excluded at full-text assessment, with the reason for exclusion for each study. The complete accounting of full-text exclusions is provided in Supplementary File 3. Please click here to download this file.
Supplementary File 3: Search and screening log.
Search and screening log documenting database-specific search yields, deduplication, title and abstract screening, full-text assessment and exclusion categories, numbers of studies contributing to each outcome, and the duplicate verification pass. Please click here to download this file.
Supplementary File 4: Extracted study-level dataset.
Extracted study-level dataset for the 14 included studies, including study characteristics and data for the overall, deep, and superficial surgical site infection outcomes. Please click here to download this file.
Supplementary File 5: Statistical analysis code.
R code for the meta-analysis, including the primary and secondary outcome analyses, seven prespecified sensitivity analyses, leave-one-out analysis, forest and funnel plots, and publication-bias assessment. Please click here to download this file.
Supplementary File 6: Statistical analysis output log.
Statistical analysis output log reporting the pooled fixed-effect and random-effects estimates, heterogeneity statistics, seven sensitivity analyses, leave-one-out results, and Egger regression test for the analyses reported in the manuscript. Please click here to download this file.
Discussion
This meta-analysis of 14 comparative studies and 9,802 patients found that intra-wound vancomycin powder was associated with lower odds of overall surgical site infection after spinal surgery (OR 0.55; 95% CI 0.44 to 0.70), with comparable associations for deep (OR 0.50) and superficial (OR 0.55) infection. The direction and magnitude are consistent with the earlier syntheses of Gande et al.21 and Bakhsheshian et al.22, and with subsequent reviews45,46,47. What the present analysis adds is not a different effect estimate but a more defensible one: eligibility was restricted strictly to spinal procedures, so the arthroplasty and orthopedic trauma studies that diluted earlier reviews were excluded and named in Supplementary File 2, among them the orthopedic trauma cohort of Qadir et al.48, the overlapping cohort of Tafish et al.49, and the mixed neurosurgical trial of Morgan et al.50; four randomized trials published up to 2023 were included and analyzed separately; every study was appraised with the design-appropriate instrument; and the extracted dataset and analysis code were released so that every number reported here can be recomputed.
The most consequential finding is the discordance between designs. The nine nonrandomized studies alone gave an OR of 0.51 (95% CI 0.39 to 0.66), whereas the four randomized trials alone gave an OR of 0.73 (95% CI 0.45 to 1.18), which was not statistically significant. Two interpretations are possible. The randomized subset may simply be underpowered, since it contains 1,997 patients and 75 events, so a true effect of the observed size could plausibly be missed. Alternatively, the larger observational effect may partly reflect confounding by indication, selection bias, and incomplete covariate adjustment, all of which were flagged during the ROBINS-I appraisal. These explanations cannot be distinguished with the available data, and the appropriate conclusion is that the pooled association is driven by observational evidence and should be interpreted as moderate-certainty rather than definitive. This consideration also tempers any recommendation for routine use.
Two further limits on interpretation deserve emphasis. First, no claim about specific high-risk populations is supported here. Because no included study reported outcomes stratified by diabetes, body mass index, smoking status, instrumentation, fusion length, or surgical indication, none of the planned subgroup analyses could be performed, and any suggestion that the benefit is concentrated in high-risk patients remains a hypothesis rather than a finding of this review. Second, the evidence regarding safety is considerably weaker than the evidence regarding efficacy. Only two included studies reported any complication data, and none prospectively surveyed for vancomycin-resistant organisms, microbiological shift, local tissue toxicity, impaired wound healing, or systemic absorption, so no quantitative risk estimate can be derived. The concern is not hypothetical: one included randomized trial reported a higher proportion of Gram-negative organisms among the infections that occurred despite prophylaxis17, and vancomycin is a glycopeptide with no activity against Gram-negative bacteria or fungi and has also shown osteoblast toxicity in vitro19,20. Powder prophylaxis therefore neither replaces systemic prophylaxis nor removes the need for culture-guided treatment of established infection.
Several limitations constrain these results. The predominance of retrospective and observational designs leaves residual confounding possible despite formal appraisal and sensitivity analysis. SSI definitions and follow-up windows varied, from 30 days to 1 year, and three studies used institutional rather than CDC/NHSN criteria, although excluding them did not change the estimate. Dose and application method also varied, from 1 to 2 g and from placement over the fascia to direct application in the wound bed, and the data did not permit a dose-response analysis. English-language limits were applied to PubMed, Embase, and Ovid MEDLINE, while no language limit was applied to Cochrane CENTRAL; gray literature, trial registries, and preprints were not searched, and the Google Scholar search was limited to the first 200 records, so language and publication bias cannot be excluded even though the Egger test was negative. Screening and extraction were performed by a single reviewer, which two blinded passes mitigate but do not eliminate. Finally, these findings apply to spinal surgery only and should not be extrapolated to arthroplasty or other orthopedic procedures, where consensus guidance and evidence syntheses do not currently support routine topical vancomycin51,52,53. Nor do these findings support substituting systemic vancomycin for standard perioperative antibiotic prophylaxis1.
The method described here has applications beyond this clinical question. The two-pass blinded screening and extraction procedure, the design-matched appraisal using RoB 2 and ROBINS-I, the parallel reporting of fixed-effect and random-effects estimates in place of an I2 threshold rule, and the release of the extracted dataset with executable analysis code together form a template that a single-author or small-team evidence synthesis can follow to make its numbers auditable. The most critical steps are the second blinded pass, which corrected two selection decisions and four event counts in this review, and the prespecification of sensitivity analyses before the pooled estimate is seen. An alternative approach to the same question would be an individual participant data meta-analysis, which would permit the risk-stratified analyses that aggregate data cannot support, or a large pragmatic registry-based randomized trial.
Future work should therefore prioritize adequately powered multicenter randomized trials in strictly defined spinal populations, using CDC/NHSN definitions and a follow-up of at least 90 days for deep infection, comparing 1 g with 2 g dosing, prospectively monitoring resistance emergence and wound healing, and reporting outcomes stratified by diabetes, obesity, smoking, instrumentation, and revision status. Until such data exist, intra-wound vancomycin powder is reasonably regarded as a low-cost adjunct supported by moderate-certainty evidence in spinal surgery, whose use should be an individualized decision rather than a universal protocol and whose long-term microbiological consequences warrant surveillance.
Disclosures
Conflict of Interest:
The author declares no financial or nonfinancial conflicts of interest and no competing interests.
Author Contributions:
This is a single-author article. Deng Xianjun was responsible for conceptualization, methodology, the literature search, study screening and selection, data extraction and its blinded verification, risk-of-bias assessment, software and formal statistical analysis, data curation, visualization, writing of the original draft, and review and editing of the final manuscript, and approved the version submitted. As no co-author was available to duplicate the screening and extraction steps, these were performed twice by the single author in two blinded passes separated by at least 14 days, as described in the Protocol section, and this is acknowledged as a limitation in the Discussion.
Acknowledgements
A large language model-based tool was used solely for language editing and to check internal numerical consistency among the text, tables, and figures. It was not used to generate data, select or appraise studies, perform statistical analyses, or produce scientific content or conclusions. The author reviewed and verified all output and takes full responsibility for the integrity and accuracy of the manuscript.
Materials
| Name | Company | Catalog Number | Comments |
|---|---|---|---|
| Cochrane Risk of Bias 2 (RoB 2) tool | Cochrane | 2019 version (Sterne et al., BMJ 2019) | Not applicable |
| EndNote | Clarivate | Version 20 | RRID:SCR_014001 |
| Grading of Recommendations Assessment, Development and Evaluation (GRADE) | GRADE Working Group | GRADE approach of Guyatt et al., BMJ 2008; GRADE Handbook, 2013 update | Not applicable |
| meta R package | R package repository / CRAN | Version ≥6.0 | RRID:SCR_019055 |
| metafor R package | R package repository / CRAN | Version ≥4.0 | RRID:SCR_003450 |
| Microsoft Excel | Microsoft | Office 365 | RRID:SCR_016137 |
| R | R Foundation for Statistical Computing | Version 4.2.0 | RRID:SCR_001905 |
| Review Manager | Cochrane Collaboration | Version 5.3 | RRID:SCR_003581 |
| Risk Of Bias In Non-randomized Studies - of Interventions (ROBINS-I) | Cochrane | 2016 version (Sterne et al., BMJ 2016) | Not applicable |
| robvis | University of Bristol | Version 0.3.0 | Not applicable |
| Stata | StataCorp | SE 17.0 | RRID:SCR_012763 |
References
- Bratzler DW, et al. Clinical practice guidelines for antimicrobial prophylaxis in surgery. Am J Health Syst Pharm. 2013;70(3):195-283.
- Suleiman AS, et al. Impact of antibiotic-coated sutures on surgical site infections: a second-order meta-analysis. Int J Surg. 2024;110(1):507-519.
- Lu YA, Wang L, Tian HB, Jiang QH. Association between nasal colonization of Staphylococcus aureus and surgical site infections in spinal surgery patients: a systematic review and meta-analysis. Eur Rev Med Pharmacol Sci. 2023;27(1):417-425.
- Zhou J, et al. Incidence of surgical site infection after spine surgery: a systematic review and meta-analysis. Spine. 2020;45(3):208-216.
- Li GQ, et al. Epidemiology and outcomes of surgical site infections following orthopedic surgery. Am J Infect Control. 2013;41(12):1268-1271.
- Jarvis WR, et al. National prevalence of methicillin-resistant Staphylococcus aureus in inpatients at US health care facilities, 2006. Am J Infect Control. 2007;35(10):631-637.
- Rodriguez-Pardo D. Antibiotic prophylaxis in orthopaedic surgery: clinical practice guidelines or individualized prophylaxis? Enferm Infecc Microbiol Clin (Engl Ed). 2019;37(9):557-559.
- Sweet FA, Roh M, Sliva C. Intrawound application of vancomycin for prophylaxis in instrumented thoracolumbar fusions: efficacy, drug levels, and patient outcomes. Spine. 2011;36(24):2084-2088.
- Johnson JD, et al. Serum and wound vancomycin levels after intrawound administration in primary total joint arthroplasty. J Arthroplasty. 2017;32(3):924-928.
- Edelstein AI, et al. Intra-articular vancomycin powder eliminates methicillin-resistant Staphylococcus aureus in a rat model of a contaminated intra-articular implant. J Bone Joint Surg Am. 2017;99(3):232-238.
- Hanssen AD, Osmon DR, Patel R. Local antibiotic delivery systems: where are we and where are we going? Clin Orthop Relat Res. 2005;437:111-114.
- Beydoun AS, et al. Perioperative topical antisepsis and surgical site infection in patients undergoing upper aerodigestive tract reconstruction. JAMA Otolaryngol Head Neck Surg. 2022;148(6):547-554.
- Kang DG, Holekamp TF, Wagner SC, Lehman RA. Intrasite vancomycin powder for the prevention of surgical site infection in spine surgery: a systematic literature review. Spine J. 2015;15(4):762-770.
- Van Hal M, et al. Vancomycin powder regimen for prevention of surgical site infection in complex spine surgeries. Clin Spine Surg. 2017;30(8):E1062-E1065.
- O'Neill KR, et al. Reduced surgical site infections in patients undergoing posterior spinal stabilization of traumatic injuries using vancomycin powder. Spine J. 2011;11(7):641-646.
- Tubaki VR, Rajasekaran S, Shetty AP. Effects of using intravenous antibiotic only versus local intrawound vancomycin antibiotic powder application in addition to intravenous antibiotics on postoperative infection in spine surgery in 907 patients. Spine. 2013;38(25):2149-2155.
- Mirzashahi B, Chehrassan M, Mortazavi SMJ. Intrawound application of vancomycin changes the responsible germ in elective spine surgery without significant effect on the rate of infection: a randomized prospective study. Musculoskelet Surg. 2018;102(1):35-39.
- Chotai S, et al. Does intrawound vancomycin application during spine surgery create vancomycin-resistant organism? Neurosurgery. 2017;80(5):746-753.
- Nicolaou KC, Boddy CNC, Brase S, Winssinger N. Chemistry, biology, and medicine of the glycopeptide antibiotics. Angew Chem Int Ed Engl. 1999;38(15):2096-2152.
- Edin ML, et al. Effect of cefazolin and vancomycin on osteoblasts in vitro. Clin Orthop Relat Res. 1996;333:245-251.
- Gande A, et al. Selection pressures of vancomycin powder use in spine surgery: a meta-analysis. Spine J. 2019;19(6):1076-1084.
- Bakhsheshian J, et al. The use of vancomycin powder in modern spine surgery: systematic review and meta-analysis of the clinical evidence. World Neurosurg. 2015;83(5):816-823.
- Page MJ, et al. The PRISMA 2020 statement: an updated guideline for reporting systematic reviews. BMJ. 2021;372:n71.
- Stroup DF, et al. Meta-analysis of observational studies in epidemiology: a proposal for reporting. JAMA. 2000;283(15):2008-2012.
- Higgins JPT, et al. Cochrane Handbook for Systematic Reviews of Interventions. 2nd ed. Wiley; Chichester; 2019.
- Horan TC, Andrus M, Dudeck MA. CDC/NHSN surveillance definition of health care-associated infection and criteria for specific types of infections in the acute care setting. Am J Infect Control. 2008;36(5):309-332.
- Sterne JAC, et al. RoB 2: a revised tool for assessing risk of bias in randomised trials. BMJ. 2019;366:l4898.
- Sterne JA, et al. ROBINS-I: a tool for assessing risk of bias in non-randomised studies of interventions. BMJ. 2016;355:i4919.
- McGuinness LA, Higgins JPT. Risk-of-bias VISualization (robvis): an R package and Shiny web app for visualizing risk-of-bias assessments. Res Synth Methods. 2021;12(1):55-61.
- Mantel N, Haenszel W. Statistical aspects of the analysis of data from retrospective studies of disease. J Natl Cancer Inst. 1959;22(4):719-748.
- Higgins JP, Thompson SG, Deeks JJ, Altman DG. Measuring inconsistency in meta-analyses. BMJ. 2003;327(7414):557-560.
- DerSimonian R, Laird N. Meta-analysis in clinical trials. Control Clin Trials. 1986;7(3):177-188.
- Egger M, Davey Smith G, Schneider M, Minder C. Bias in meta-analysis detected by a simple, graphical test. BMJ. 1997;315(7109):629-634.
- Guyatt GH, et al. GRADE: an emerging consensus on rating quality of evidence and strength of recommendations. BMJ. 2008;336(7650):924-926.
- Salimi S, et al. Local vancomycin therapy to reduce surgical site infection in adult spine surgery: a randomized prospective study. Eur Spine J. 2022;31(2):454-460.
- Sonbol AM, Baabdullah AM, Mohamed MAA, Kassab FN. Intrawound low-dose vancomycin is superior to high-dose in controlling the risk of wound dehiscence in spine surgeries. Medicine (Baltimore). 2023;102(15):e33369.
- Hill BW, et al. The use of vancomycin powder reduces surgical reoperation in posterior instrumented and noninstrumented spinal surgery. Acta Neurochir (Wien). 2014;156(4):749-754.
- Hey HWD, et al. Is intraoperative local vancomycin powder the answer to surgical site infections in spine surgery? Spine. 2017;42(4):267-274.
- Adhikari P, et al. Does the application of topical intrawound vancomycin powder affect deep surgical site infection and the responsible organisms after spinal surgery?: A retrospective case series with a historical control group. Asian Spine J. 2020;14(1):72-78.
- Oktay K, et al. Efficacy of prophylactic application of vancomycin powder in preventing surgical site infections after instrumented spinal surgery: a retrospective analysis of patients with high-risk conditions. Acta Orthop Traumatol Turc. 2021;55(1):48-52.
- Vakayil V, et al. Intrawound vancomycin application after spinal surgery: a propensity score-matched cohort analysis. J Neurosurg Spine. 2021;34(5):788-798.
- Ushirozako H, et al. Impact of intrawound vancomycin powder on prevention of surgical site infection after posterior spinal surgery. J Neurosurg Spine. 2021;34(4):656-664.
- Devin CJ, et al. Intrawound vancomycin decreases the risk of surgical site infection after posterior spine surgery: a multicenter analysis. Spine. 2018;43(1):65-71.
- Khalid S, et al. Efficacy of prophylactic intrawound application of vancomycin powder in preventing surgical site infections in spinal instrumentation surgery. J Ayub Med Coll Abbottabad. 2023;35(2):228-232.
- Sathish M, Girinivasan C. Is use of topical vancomycin in pediatric spine surgeries a safe option in the prevention of surgical site infections? A meta-analysis and systematic review of the literature. Global Spine J. 2021;11(5):774-781.
- Luo H, et al. Intraoperative vancomycin powder to reduce surgical site infections after posterior spine surgery: a systematic review and meta-analysis. EFORT Open Rev. 2022;7(2):109-121.
- Lu L, et al. Efficacy of intrawound treatments to prevent surgical site infection after spine surgery: a systematic review and network meta-analysis. Pain Physician. 2021;24(6):E709-E720.
- Qadir R, et al. Vancomycin powder use in fractures at high risk of surgical site infection. J Orthop Trauma. 2021;35(1):23-28.
- Tafish RT, Alkhaldi AF, Bourghli A, Althunian TA. Effectiveness of topical vancomycin in the prevention of spinal surgical site infections: a retrospective cohort study. Antimicrob Resist Infect Control. 2021;10(1):136.
- Morgan E, et al. Efficacy of prophylactic use of intraoperative vancomycin powder in preventing surgical site infection in neurological surgeries in Irrua, Nigeria: a randomized controlled study. J Clin Neurosci. 2024;121:155-160.
- Zhu Z, et al. Intrawound vancomycin powder for prevention of surgical site infections in primary joint arthroplasty: an umbrella review of systematic reviews and meta-analyses. Int J Surg. 2025;111(5):3508-3524.
- Jennings JA, et al. 2023 International Consensus Meeting on musculoskeletal infection: summary from the treatment workgroup and consensus on treatment in preclinical models. J Orthop Res. 2024;42(3):500-511.
- Peng Z, et al. The application of topical vancomycin powder for the prevention of surgical site infections in primary total hip and knee arthroplasty: a meta-analysis. Orthop Traumatol Surg Res. 2021;107(4):102741.