This retrospective study combines blinded three-segment coronary remeasurement with timing-adjusted analysis of admission-available data in an infant-enriched Kawasaki disease cohort. It separates pretreatment associations from post-treatment outcomes, quantifies bootstrap optimism, and emphasizes that the model is internally validated only and cannot replace echocardiography.
Research Article
Pretreatment Coronary Artery Involvement in an Infant-Enriched Kawasaki Disease Cohort: Timing-Adjusted Analysis and Internal Model Validation
In This Article
Summary
Abstract
Coronary artery involvement (CAI) in Kawasaki disease (KD) is time-dependent, yet some published risk models combine pretreatment findings with variables that become known only after therapy. This retrospective single-center study examined admission-available factors associated with CAI present before intravenous immunoglobulin (IVIG) in an infant-enriched cohort and internally evaluated a timing-adjusted model. Children treated at Qingdao Women and Children's Hospital from January 2022 through December 2025 were eligible when pretreatment clinical data, laboratory measurements, and stored echocardiograms were available. Two pediatric cardiologists, blinded to clinical data and coronary classification, remeasured the left main coronary artery (LMCA), proximal left anterior descending artery (LAD), and proximal right coronary artery (RCA). Dallaire Z-scores were calculated, and CAI was defined as a maximum pretreatment Z-score of at least 2.0. The full model included age, illness day at echocardiography, C-reactive protein (CRP), erythrocyte sedimentation rate (ESR), platelet count, and extremity changes; complete/incomplete KD status and IVIG resistance were excluded from candidate predictors to reduce incorporation and temporal bias. Among 216 patients (median age, 5.7 months), 44 (20.4%) had pretreatment CAI. In the parsimonious model, CRP (adjusted odds ratio [aOR] per 10 mg/L, 1.151; 95% confidence interval [CI], 1.031–1.286), ESR (aOR per 10 mm/h, 1.158; 95% CI, 1.001–1.339), and illness day (aOR per day, 1.130; 95% CI, 1.020–1.252) were retained. The apparent area under the receiver operating characteristic curve was 0.745 and decreased to 0.710 after 1,000 bootstrap resamples; the bootstrap-corrected calibration slope was 0.82. At the data-derived threshold, the positive predictive value was 37.8%, and the negative predictive value was 92.1%. Extremity changes were not independently associated after adjustment for timing. The model showed moderate, cohort-specific performance and should not be used as a stand-alone test or substitute for echocardiography. Independent validation is required before clinical application.
Introduction
Kawasaki disease (KD) is an acute childhood vasculitis with an incompletely defined cause and a particular tendency to involve the coronary arteries1,2. Its incidence varies substantially across regions and is highest in East Asian populations3. Coronary inflammation can produce transient dilation or aneurysm formation, and the resulting vascular remodeling may have consequences that extend beyond the acute febrile illness2,4. Because coronary abnormalities may be clinically silent, transthoracic echocardiography remains central to the initial assessment and follow-up of children with suspected KD2.
Infants, especially those younger than 6 months, may present with fewer of the classic mucocutaneous findings and have a higher frequency of coronary abnormalities5. This creates two related challenges. First, delayed recognition can shift the initial echocardiogram to a later day of illness, when coronary enlargement is more likely to be visible. Second, clinical classification as incomplete KD may itself incorporate supportive echocardiographic findings. Analyses that ignore the timing of echocardiography or enter complete/incomplete KD status directly into a model for coronary involvement may therefore be affected by temporal confounding or incorporation bias.
Numerous studies have evaluated CRP, ESR, age, platelet count, clinical phenotype, and baseline echocardiographic measurements as predictors of coronary outcomes6,7. This study evaluated routinely available pretreatment variables in relation to coronary involvement already present before IVIG, using blinded three-segment coronary remeasurement, adjustment for illness day at echocardiography, exclusion of post-treatment variables, and bootstrap-corrected model evaluation: identifying associations with coronary involvement already present before IVIG using only information available at admission; measuring the LMCA, LAD, and RCA with a blinded re-review protocol; explicitly adjusting for illness day at the pretreatment echocardiogram; excluding post-treatment variables from model development; and distinguishing apparent performance from bootstrap-corrected performance. These choices address common sources of optimistic or clinically ambiguous inference in prediction-model research8,9.
The primary aim was therefore to identify admission-available factors associated with pretreatment CAI in an infant-enriched KD cohort and to internally evaluate a parsimonious, timing-adjusted model. A secondary aim was to examine IVIG resistance separately as a subsequent disease-course characteristic rather than as a predictor of a coronary outcome that had already been measured before treatment.
Protocol
The study was approved by the Ethics Review Committee of Qingdao Women and Children's Hospital (approval No. QFELLY-YJ-2026-145). The requirement for individual informed consent was waived because this retrospective study used existing de-identified clinical data and involved no additional intervention. The study was conducted in accordance with the Declaration of Helsinki.
Study design and sampling frame
This retrospective cohort study included children with KD managed in the Department of Infants at Qingdao Women and Children's Hospital between January 1, 2022, and December 31, 2025. The Department of Infants prefers to admit infants and very young children; accordingly, the cohort was expected to be substantially younger than an all-ages hospital KD population. Accordingly, this was an infant-enriched departmental cohort rather than a population-based sample.
All potentially eligible records during the study period were screened. Inclusion required a clinical diagnosis of KD, an echocardiographic examination performed before the first IVIG infusion, and complete data for the pretreatment variables used in the analysis. Fourteen of 230 screened patients lacked at least one required laboratory or echocardiographic measurement and were excluded, leaving 216 complete cases. No imputation was performed. Because all eligible cases were included, no prospective sample size calculation was undertaken; model complexity was constrained given the 44 observed CAI events.
Diagnostic definitions and clinical data
KD was diagnosed using the 2017 American Heart Association (AHA) criteria, which were in effect throughout the study period2. Complete KD was defined by the conventional clinical criteria, whereas incomplete KD was identified using the AHA diagnostic algorithm in children with prolonged unexplained fever and fewer principal features after consideration of alternative diagnoses. Because supportive echocardiographic findings can contribute to the diagnosis of incomplete KD, complete/incomplete status was treated as a descriptive characteristic and was excluded a priori from the primary multivariable model.
The fever-onset date was abstracted from the medical record and designated illness day 1. Demographic and clinical variables included age, sex, height, weight, peak temperature, total fever duration, cough, diarrhea, vomiting, irritability, red or cracked lips, strawberry tongue, Bacillus Calmette-Guérin scar erythema, polymorphous rash, bilateral nonexudative conjunctival injection, extremity changes, and cervical lymphadenopathy. Illness day at the first pretreatment echocardiogram was recorded directly and used as the timing variable in the adjusted analysis.
The earliest laboratory values obtained after admission and before IVIG were used. Measurements were white blood cell count (x 10⁹/L), neutrophil percentage, hemoglobin concentration (g/L), platelet count (x 10⁹/L), CRP (mg/L), and ESR (mm/h). Complete blood count and CRP were generated by the hospital clinical laboratory using its principal pediatric hematology/CRP platform with manufacturer-matched reagents, calibrators, and controls; CRP was measured by latex-enhanced immunoturbidimetry. ESR was reported according to the laboratory's routine Westergren-based procedure. Because this was a four-year retrospective cohort, reagent and control lots varied over time and were not treated as study variables. Data were abstracted using a standardized form and checked against the source record before analysis. Details of the equipment and reagent systems are provided in the Table of Materials.
Treatment-related variables
During the acute febrile phase, patients received IVIG at a total dose of 2 g/kg and aspirin at 30–50 mg/kg/day according to the institutional treatment pathway. After defervescence, aspirin was reduced to 3–5 mg/kg/day.
Initiation of the first IVIG infusion after illness day 10 was recorded as a descriptive treatment-timing variable. IVIG resistance was defined as persistent or recurrent fever with a temperature of at least 38.0 °C occurring at least 36 h after completion of the initial IVIG infusion, consistent with the operational definition used in the source records and prior KD studies10. Because this status becomes known only after treatment, it was not eligible for inclusion in any model of pretreatment CAI and was analyzed only as a subsequent disease-course characteristic.
Echocardiographic re-review and coronary measurements
Stored pretreatment transthoracic echocardiograms were re-reviewed for all included patients. Stored loops were retrieved from the institutional picture archiving and communication system and remeasured with electronic calipers. Standard parasternal short-axis and modified views were used to visualize the LMCA, proximal LAD, and proximal RCA in accordance with pediatric echocardiographic measurement principles11. Internal luminal diameters were measured from inner edge to inner edge at end diastole, using the frame with the clearest vessel borders and avoiding the ostial funnel, branch points, and visibly tapered distal segments.
The LMCA was measured in the straight segment between the ostium and bifurcation; the LAD was measured immediately distal to the LMCA bifurcation and before the first major side branch; and the RCA was measured approximately 3–5 mm distal to its origin. When three technically adequate cardiac cycles were available, the measurements were averaged. Height and weight recorded at the same admission were used to calculate body surface area with the Haycock equation12. Segment-specific Z-scores were then calculated using the Dallaire and Dahdah equations13.
Two experienced pediatric cardiologists independently remeasured each segment while blinded to clinical manifestations, laboratory results, treatment response, and the original echocardiographic classification. An absolute between-observer difference greater than 0.2 mm, or any disagreement that crossed a coronary Z-score category, triggered a joint review of the stored loop and the consensus measurement. When neither condition was present, the mean of the two measurements was used. Interobserver reproducibility was quantified separately for the LMCA, LAD, and RCA using intraclass correlation coefficients.
Coronary outcome definitions
Coronary status was assigned using the maximum Z-score across the LMCA, LAD, and RCA on the first examination obtained before IVIG. Categories followed the AHA framework2: no involvement, Z-score <2.0; dilation only, Z-score 2.0 to <2.5; small aneurysm, Z-score 2.5 to <5.0; medium aneurysm, Z-score 5.0 to <10.0 with an absolute diameter <8 mm; and giant aneurysm, Z-score ≥10.0 or absolute diameter ≥8 mm. The primary binary outcome, pretreatment CAI, was defined as a maximum Z-score ≥2.0. CAI was used as the binary analytic outcome, while dilation and small, medium, and giant aneurysms were categorized separately to describe the coronary phenotype. A sensitivity analysis used the more specific aneurysm threshold of maximum Z-score ≥2.5.
Statistical analysis and model development
Continuous variables were assessed for distributional form and summarized as the mean ± standard deviation or the median with the interquartile range, as appropriate. Between-group comparisons used the independent-samples t test or Mann-Whitney U test for continuous variables and the chi-square test or Fisher's exact test for categorical variables. All tests were two-sided, and p < 0.05 was considered statistically significant.
Predictor selection was not based solely on univariable P values. The full timing-adjusted logistic regression model included age, illness day at the pretreatment echocardiogram, CRP, ESR, platelet count, and extremity changes because these variables were available before treatment and represented demographic, temporal, inflammatory, hematologic, and clinical-recognition domains. Complete/incomplete KD status was excluded to reduce incorporation bias. IVIG resistance and IVIG administration after illness day 10 were excluded because they were post-admission or post-treatment variables. Variance inflation factors were examined to assess multicollinearity. Model complexity was interpreted in light of contemporary sample-size principles for binary prediction models14.
A parsimonious model was then defined without automated stepwise selection. Age, platelet count, and extremity changes were removed only after confirming that they were not independently associated in the full model and that their removal did not materially alter the coefficients for CRP, ESR, and illness day or reduce apparent discrimination. Odds ratios were reported per 10 mg/L increase in CRP, per 10 mm/h increase in ESR, per 50 x 10⁹/L increase in platelet count, per month of age, and per additional illness day.
Model discrimination was quantified with the area under the receiver operating characteristic curve (AUC) and 95% confidence interval. AUCs were compared using the DeLong method. Calibration was described with the calibration intercept, calibration slope, Brier score, and Hosmer-Lemeshow statistic. Internal validation used 1,000 bootstrap samples to estimate optimism in the AUC and to obtain optimism-corrected discrimination and calibration indices; apparent and corrected values were reported separately9,15.
The probability threshold that maximized the Youden index in the development cohort was used only for descriptive calculations of sensitivity, specificity, positive and negative predictive values, and likelihood ratios. Wilson's confidence intervals were calculated for proportions. Because the threshold was selected and evaluated in the same cohort, it was not interpreted as a clinical action threshold, and no low-, intermediate-, or high-risk categories were prespecified.
Sensitivity analyses redefined the outcome as a maximum Z-score ≥2.5, restricted the cohort to those with complete KD, and repeated the model in children younger than 12 months. A separate multivariable model was not fitted for children aged at least 12 months due to the small number of events. Reporting was guided by the TRIPOD statement8. Analyses were performed using Python 3.11.9 with NumPy 1.26.4, pandas 2.2.2, SciPy 1.13.1, statsmodels 0.14.2, scikit-learn 1.5.1, Pingouin 0.5.4, Matplotlib 3.9.1, and seaborn 0.13.2. The DeLong comparison was implemented using NumPy. IBM SPSS Statistics 26.0 was used for descriptive analyses and data tabulation.
Results
Study cohort and pretreatment characteristics
Among 230 children screened, 14 were excluded because at least one pretreatment laboratory or echocardiographic measurement was unavailable, leaving 216 patients for analysis (Figure 1). The median age was 5.7 months (interquartile range [IQR], 3.6–8.9 months); 183 patients (84.7%) were younger than 12 months, and 207 (95.8%) were younger than 24 months, confirming that this was an infant-enriched cohort. Overall, 123 patients (56.9%) were male. Pretreatment coronary artery involvement (CAI), defined as a maximum coronary artery Z-score of at least 2.0 before intravenous immunoglobulin (IVIG), was present in 44 patients (20.4%; 95% confidence interval [CI], 15.5%–26.2%). CAI occurred in 39 of 183 children younger than 12 months (21.3%) and in 5 of 33 children aged at least 12 months (15.2%; p = 0.490).
Compared with patients without CAI, those with CAI underwent the initial pretreatment echocardiogram later in the illness course (median illness day, 6.0 [IQR, 5.0–9.0] vs. 5.0 [IQR, 4.0–7.0]; p = 0.028), less often fulfilled the criteria for complete Kawasaki disease (KD) (52.3% vs. 74.4%; p = 0.006), and less often had extremity changes (59.1% vs. 79.1%; p = 0.010). Age, sex, height, weight, peak temperature, total fever duration, and the other recorded clinical features did not differ significantly between the groups (Table 1).
Echocardiographic findings and coronary phenotype
Blinded re-review of the stored pretreatment echocardiograms included the left main coronary artery (LMCA), proximal left anterior descending artery (LAD), and proximal right coronary artery (RCA) in all 216 patients. Interobserver agreement was high for each segment: the intraclass correlation coefficients were 0.93 (95% CI, 0.90–0.95) for the LMCA, 0.90 (95% CI, 0.86–0.93) for the LAD, and 0.92 (95% CI, 0.89–0.94) for the RCA. The inclusion of the LAD did not change patient-level CAI classification because no patient had an isolated LAD Z-score ≥2.0 when both the LMCA and RCA Z-scores were <2.0.
Among the 44 patients with pretreatment CAI, the median maximum coronary Z-score was 2.81 (IQR, 2.40–3.16). Fifteen patients (34.1%) had dilation only (Z-score 2.0 to <2.5), 26 (59.1%) had a small aneurysm (Z-score 2.5 to <5.0), and 3 (6.8%) had a medium aneurysm (Z-score 5.0 to <10.0). No giant aneurysm (Z-score ≥10.0) was identified. The LMCA, LAD, and RCA were involved in 28 (63.6%), 18 (40.9%), and 31 (70.5%) patients, respectively. Eighteen patients (40.9%) had one-segment involvement, 19 (43.2%) had two-segment involvement, and 7 (15.9%) had three-segment involvement (Table 2 and Figure 2).
Pretreatment laboratory findings
Patients with CAI had higher pretreatment CRP concentrations (77.06 mg/L [IQR, 55.30–94.31] vs. 49.28 mg/L [IQR, 33.73–75.51]; p < 0.001), ESR values (61.00 mm/h [IQR, 48.50–83.00] vs. 52.00 mm/h [IQR, 39.75–74.50]; p = 0.019), and platelet counts (400.00 x 10⁹/L [IQR, 327.25–510.75] vs. 358.00 x 10⁹/L [IQR, 290.75–421.50]; p = 0.017). WBC count (p = 0.422), neutrophil percentage (p = 0.754), and hemoglobin concentration (p = 0.162) did not differ significantly (Table 1 and Figure 3).
Timing-adjusted multivariable analysis
To address temporal confounding and avoid incorporation bias, complete/incomplete KD status was not included in the prediction model because coronary findings can contribute to the classification of incomplete KD. The full timing-adjusted model included age, illness day at the pretreatment echocardiogram, CRP, ESR, platelet count, and extremity changes. Multicollinearity was not detected (all variance inflation factors <1.8). In this model, CRP (adjusted odds ratio [aOR] per 10 mg/L, 1.146; 95% CI, 1.021–1.286; p = 0.021) and illness day (aOR per day, 1.124; 95% CI, 1.012–1.249; p = 0.029) remained independently associated with CAI. The association of extremity changes was attenuated from an unadjusted OR of 0.382 to an aOR of 0.612 (95% CI, 0.274–1.367; p = 0.231), and ESR was of borderline significance (aOR per 10 mm/h, 1.146; 95% CI, 0.990–1.327; p = 0.067). Age and platelet count were not independently associated with CAI (Table 3).
Removing age, platelet count, and extremity changes did not materially alter the estimates for CRP, ESR, or illness day and did not materially reduce apparent discrimination (AUC, 0.745 for the parsimonious model vs. 0.752 for the full model; p = 0.611). The final parsimonious admission model, therefore, retained CRP, ESR, and illness day at the pretreatment echocardiogram. The odds of CAI increased by 15.1% for each 10 mg/L increase in CRP (aOR, 1.151; 95% CI, 1.031–1.286; p = 0.012), by 15.8% for each 10 mm/h increase in ESR (aOR, 1.158; 95% CI, 1.001–1.339; p = 0.048), and by 13.0% for each additional illness day (aOR, 1.130; 95% CI, 1.020–1.252; p = 0.020). With 44 CAI events and three retained predictors, the events-per-variable ratio was 14.7.
Internal model performance and clinical interpretability
The parsimonious model had an apparent AUC of 0.745 (95% CI, 0.684–0.832). After 1,000 bootstrap resamples, the mean optimism was 0.035, and the optimism-corrected AUC was 0.710 (Figure 4). CRP and ESR alone had AUCs of 0.684 and 0.615, respectively; the modest numerical increase in apparent AUC over CRP alone did not reach statistical significance (p = 0.118). Apparent calibration in the development cohort yielded a calibration slope of 1.00, an intercept of 0.00, a Brier score of 0.143, and a Hosmer-Lemeshow χ² of 7.449 (8 degrees of freedom; p = 0.489). Bootstrap correction reduced the calibration slope to 0.82, with a corrected intercept of 0.04 and a corrected Brier score of 0.151, indicating some overfitting despite the absence of gross apparent miscalibration (Figure 5).
At the data-derived Youden probability threshold of 0.186, the model identified 34 of 44 patients with CAI and correctly classified 116 of 172 patients without CAI. Sensitivity was 77.3%, specificity was 67.4%, positive predictive value (PPV) was 37.8%, and negative predictive value (NPV) was 92.1% (Table 4). Fifty-six of the 90 patients classified as positive did not have CAI; thus, the false-positive proportion among test-positive patients was 62.2%. No categorical risk strata were defined because the threshold was derived and evaluated in the same cohort. This internally derived threshold is not a clinical action threshold, and the model should not be used as a stand-alone confirmatory test or as a replacement for pretreatment echocardiography. No independent validation cohort was available; all performance estimates are internal to this single-center development cohort.
Confounding and sensitivity analyses
Extremity changes were present in 162 patients and absent in 54. Patients with extremity changes underwent pretreatment echocardiography earlier (median illness day, 5.0 vs. 6.0; p = 0.004), more often fulfilled complete KD criteria (123/162 [75.9%] vs. 28/54 [51.9%]; p = 0.002), and less often received IVIG after illness day 10 (9/162 [5.6%] vs. 11/54 [20.4%]; p = 0.003). Their unadjusted CAI prevalence was correspondingly lower (26/162 [16.0%] vs. 18/54 [33.3%]; p = 0.011). Together with the loss of statistical significance in the timing-adjusted model, these findings indicate that extremity changes primarily marked earlier recognition of a typical clinical phenotype rather than an independent biological protective effect.
When the outcome was restricted to coronary aneurysm (maximum Z-score ≥2.5; 29 events), CRP (aOR per 10 mg/L, 1.160; 95% CI, 1.023–1.316; p = 0.021) and illness day (aOR per day, 1.151; 95% CI, 1.026–1.292; p = 0.017) remained associated with the outcome, whereas ESR did not (aOR per 10 mm/h, 1.103; 95% CI, 0.936–1.300; p = 0.242). Restricting the analysis to the 151 patients with complete KD, thereby reducing possible incorporation bias, yielded directionally similar but less precise estimates; CRP remained associated with CAI (aOR per 10 mg/L, 1.142; 95% CI, 1.002–1.301; p = 0.046), whereas ESR and illness day did not reach statistical significance. In the 183 patients younger than 12 months, estimates were similar to those in the full cohort. A separate model was not fitted for children aged at least 12 months because only five CAI events occurred in that subgroup (Table 5).
IVIG resistance and subsequent disease course
IVIG resistance occurred in 13 of 44 patients with pretreatment CAI (29.5%) and in 21 of 172 patients without CAI (12.2%), corresponding to an unadjusted OR of 3.02 (95% CI, 1.37–6.66; p = 0.009; Figure 6). Because IVIG resistance is defined only after completion of the initial treatment, it was analyzed solely as a subsequent disease-course characteristic and was not considered a candidate predictor in any admission-based model for pretreatment CAI.
DATA AVAILABILITY:
The de-identified participant-level data and supporting analysis files used in this study are available from the corresponding author upon reasonable request.
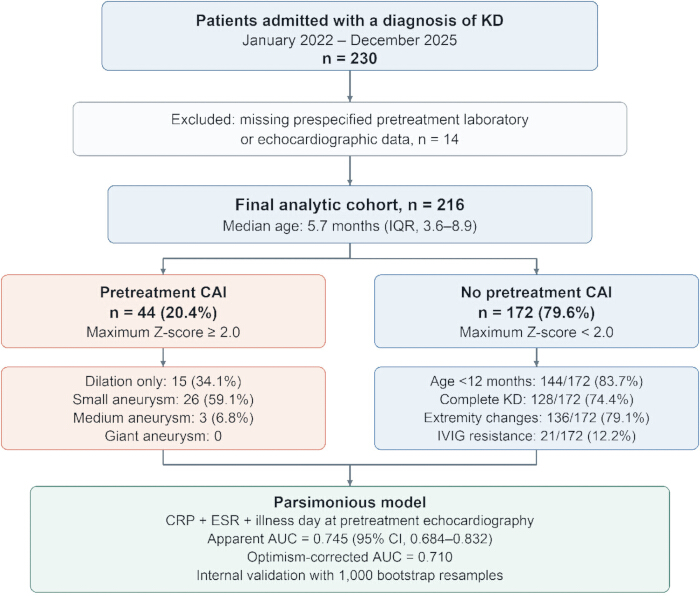
Figure 1: Patient flow diagram. Of 230 children screened, 14 were excluded because pretreatment laboratory or echocardiographic measurements were unavailable, leaving 216 patients in the analytic cohort. Forty-four patients had pretreatment coronary artery involvement (CAI; maximum Z-score ≥2.0), and 172 had no CAI. Please click here to view a larger version of this figure.
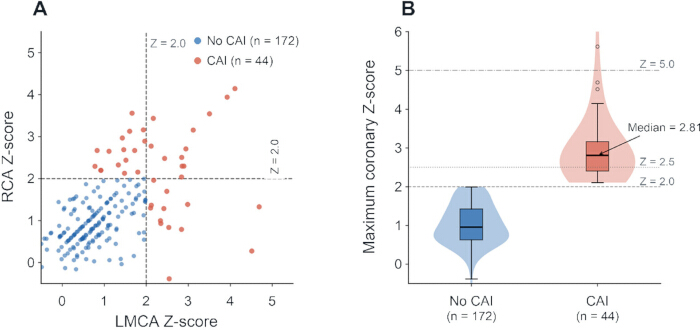
Figure 2: Pretreatment coronary artery Z-score distribution. (A) Patient-level Z-scores for the left main coronary artery (LMCA) and right coronary artery (RCA), with dashed reference lines at Z = 2.0. The left anterior descending artery (LAD) was included in patient classification and is summarized in Table 2. (B) Distribution of the maximum coronary Z-score in patients with and without CAI, with reference lines at 2.0, 2.5, and 5.0. The median maximum Z-score in the CAI group was 2.81. Please click here to view a larger version of this figure.
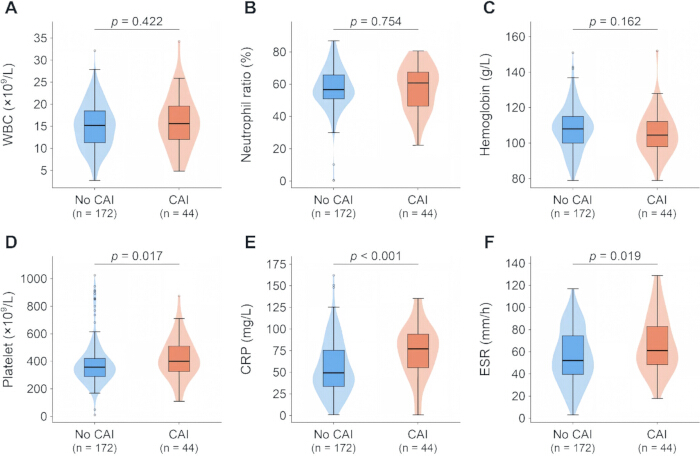
Figure 3: Pretreatment laboratory parameters in patients with and without coronary artery involvement. Violin plots with embedded boxplots compare (A) white blood cell count, (B) neutrophil percentage, (C) hemoglobin concentration, (D) platelet count, (E) C-reactive protein (CRP), and (F) erythrocyte sedimentation rate (ESR). The corresponding P values were 0.422, 0.754, 0.162, 0.017, <0.001, and 0.019, respectively. Please click here to view a larger version of this figure.
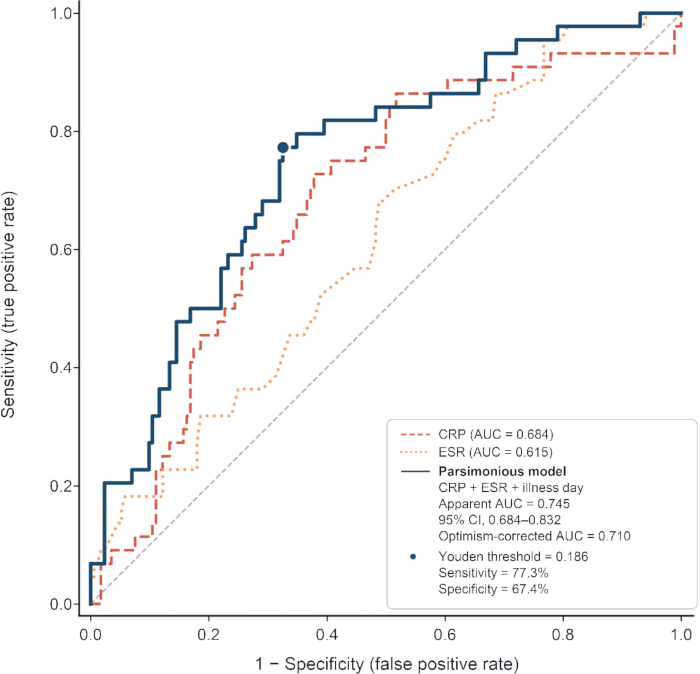
Figure 4: Receiver operating characteristic curves for pretreatment coronary artery involvement. Curves show CRP alone (AUC, 0.684), ESR alone (AUC, 0.615), and the parsimonious admission model comprising CRP, ESR, and illness day at pretreatment echocardiography (apparent AUC, 0.745; 95% CI, 0.684–0.832). After 1,000 bootstrap resamples, the optimism-corrected AUC of the combined model was 0.710. The marked probability threshold of 0.186 was derived using the Youden index in the development cohort. Please click here to view a larger version of this figure.
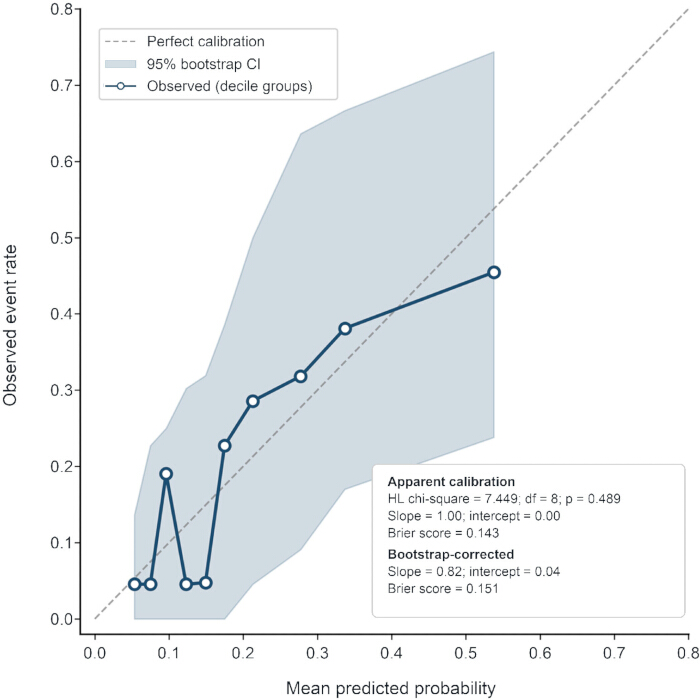
Figure 5: Calibration of the parsimonious admission model. Observed CAI proportions are plotted against mean predicted probabilities. Apparent calibration in the development cohort yielded a Hosmer-Lemeshow χ² of 7.449 (8 degrees of freedom; p = 0.489), a calibration slope of 1.00, and an intercept of 0.00. Bootstrap-corrected estimates were a slope of 0.82, an intercept of 0.04, and a Brier score of 0.151. The shaded region represents the 95% bootstrap confidence interval. Please click here to view a larger version of this figure.
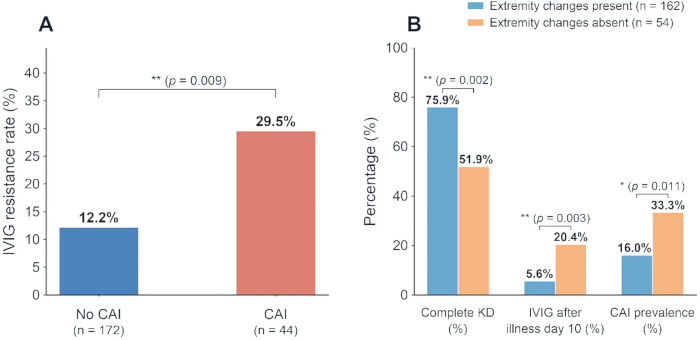
Figure 6: IVIG resistance and descriptive analyses related to extremity changes. (A) IVIG resistance was more frequent in patients with pretreatment CAI than in those without CAI (29.5% vs. 12.2%; p = 0.009). (B) Patients with extremity changes were more often found to have complete KD, less often treated after illness day 10, and had a lower unadjusted prevalence of CAI. These comparisons are descriptive; changes in extremity were not retained in the parsimonious prediction model. Please click here to view a larger version of this figure.
| Variable | CAI group (n = 44) | No-CAI group (n = 172) | p value |
| Age (months), median (IQR) | 5.35 (3.85-8.13) | 6.00 (3.39-9.00) | 0.596 |
| Age <12 months, n (%) | 39 (88.6) | 144 (83.7) | 0.490 |
| Male sex, n (%) | 25 (56.8) | 98 (57.0) | 0.985 |
| Height (cm), median (IQR) | 67.50 (61.00-70.75) | 69.00 (64.00-72.00) | 0.186 |
| Weight (kg), median (IQR) | 7.65 (6.50-8.95) | 8.05 (6.84-9.00) | 0.411 |
| Illness day at pretreatment echocardiography, median (IQR) | 6.0 (5.0-9.0) | 5.0 (4.0-7.0) | 0.028 |
| Peak fever temperature (°C), median (IQR) | 39.60 (39.20-40.00) | 39.70 (39.20-40.10) | 0.407 |
| Total fever duration (days), median (IQR) | 7.00 (5.00-9.00) | 6.00 (5.00-8.00) | 0.128 |
| Complete KD, n (%) | 23 (52.3) | 128 (74.4) | 0.006 |
| Cough, n (%) | 22 (50.0) | 79 (46.0) | 0.629 |
| Diarrhea, n (%) | 18 (40.9) | 57 (33.1) | 0.334 |
| Vomiting, n (%) | 14 (31.8) | 47 (27.3) | 0.555 |
| Irritability, n (%) | 27 (61.4) | 91 (52.9) | 0.315 |
| Red or cracked lips, n (%) | 31 (70.5) | 131 (76.2) | 0.435 |
| Strawberry tongue, n (%) | 23 (52.3) | 82 (47.7) | 0.586 |
| BCG scar erythema, n (%) | 26 (59.1) | 97 (56.4) | 0.747 |
| Polymorphous rash, n (%) | 23 (52.3) | 83 (48.3) | 0.634 |
| Conjunctival injection, n (%) | 30 (68.2) | 122 (70.9) | 0.722 |
| Extremity changes, n (%) | 26 (59.1) | 136 (79.1) | 0.010 |
| Cervical lymphadenopathy, n (%) | 13 (29.5) | 47 (27.3) | 0.769 |
| WBC count (×10⁹/L), median (IQR) | 15.59 (12.08-19.55) | 15.21 (11.25-18.45) | 0.422 |
| Neutrophils (%), median (IQR) | 60.70 (46.30-67.70) | 56.60 (50.50-66.10) | 0.754 |
| Hemoglobin (g/L), median (IQR) | 104.50 (98.00-112.00) | 108.00 (100.00-115.00) | 0.162 |
| Platelet count (×10⁹/L), median (IQR) | 400.00 (327.25-510.75) | 358.00 (290.75-421.50) | 0.017 |
| CRP (mg/L), median (IQR) | 77.06 (55.30-94.31) | 49.28 (33.73-75.51) | <0.001 |
| ESR (mm/h), median (IQR) | 61.00 (48.50-83.00) | 52.00 (39.75-74.50) | 0.019 |
Table 1: Pretreatment clinical and laboratory characteristics according to coronary artery status. Values are median (IQR) or n (%). All laboratory measurements and echocardiographic data were obtained before IVIG. Continuous variables were compared using the Mann-Whitney U test; categorical variables were compared using the chi-square test or Fisher's exact test, as appropriate. CAI was defined as a maximum Z-score ≥2.0 across the LMCA, LAD, and RCA. Abbreviations: BCG = Bacillus Calmette-Guérin; CAI = coronary artery involvement; CRP = C-reactive protein; ESR = erythrocyte sedimentation rate; IQR = interquartile range; KD = Kawasaki disease; LAD = left anterior descending artery; LMCA = left main coronary artery; RCA = right coronary artery; WBC = white blood cell.
| Finding | Value | Definition or note |
| Maximum coronary Z-score | 2.81 (2.40-3.16) | Median (IQR) |
| Dilation only | 15 (34.1%) | 2.0 to <2.5 |
| Small aneurysm | 26 (59.1%) | 2.5 to <5.0 |
| Medium aneurysm | 3 (6.8%) | 5.0 to <10.0 |
| Giant aneurysm | 0 | ≥10.0 |
| LMCA involvement | 28 (63.6%) | Nonexclusive segment count |
| LAD involvement | 18 (40.9%) | No isolated LAD involvement |
| RCA involvement | 31 (70.5%) | Nonexclusive segment count |
| One-segment involvement | 18 (40.9%) | One segment with Z-score ≥2.0 |
| Two-segment involvement | 19 (43.2%) | Two segments with Z-score ≥2.0 |
| Three-segment involvement | 7 (15.9%) | LMCA, LAD, and RCA all involved |
| LMCA ICC (95% CI) | 0.93 (0.90-0.95) | Two blinded observers |
| LAD ICC (95% CI) | 0.90 (0.86-0.93) | Two blinded observers |
| RCA ICC (95% CI) | 0.92 (0.89-0.94) | Two blinded observers |
Table 2: Pretreatment coronary artery findings among the 44 patients with coronary artery involvement. Coronary categories were assigned based on the maximum Z-score among the LMCA, LAD, and RCA. Segment-specific counts are nonexclusive. Abbreviations: CI = confidence interval; ICC = intraclass correlation coefficient; IQR = interquartile range; LAD = left anterior descending artery; LMCA = left main coronary artery; RCA = right coronary artery.
| Predictor | Univariable OR (95% CI); p value | Full timing-adjusted aOR (95% CI); p value | Parsimonious-model aOR (95% CI); p value |
| Age, per month | 0.988 (0.944-1.034); 0.596 | 0.987 (0.928-1.050); 0.680 | — |
| Illness day at pretreatment echocardiography, per day | 1.097 (1.010-1.192); 0.028 | 1.124 (1.012-1.249); 0.029 | 1.130 (1.020-1.252); 0.020 |
| CRP, per 10 mg/L | 1.180 (1.079-1.291); <0.001 | 1.146 (1.021-1.286); 0.021 | 1.151 (1.031-1.286); 0.012 |
| ESR, per 10 mm/h | 1.119 (1.018-1.229); 0.019 | 1.146 (0.990-1.327); 0.067 | 1.158 (1.001-1.339); 0.048 |
| Platelet count, per 50 ×10⁹/L | 1.103 (1.018-1.195); 0.017 | 1.019 (0.916-1.134); 0.729 | — |
| Complete KD, yes vs. no | 0.376 (0.190-0.746); 0.006 | Not entered* | — |
| Extremity changes, present vs. absent | 0.382 (0.189-0.773); 0.010 | 0.612 (0.274-1.367); 0.231 | — |
Table 3: Univariable and multivariable associations with pretreatment coronary artery involvement. The full model simultaneously included age, illness day, CRP, ESR, platelet count, and extremity changes. The parsimonious model retained CRP, ESR, and illness day. *Complete/incomplete KD status was excluded a priori from multivariable modeling because coronary findings can contribute to the diagnosis of incomplete KD. Abbreviations: aOR, adjusted odds ratio; CI = confidence interval; CRP = C-reactive protein; ESR = erythrocyte sedimentation rate; KD = Kawasaki disease; OR = odds ratio.
| Measure | Estimate | Supporting counts or 95% CI |
| Probability threshold | 0.186 | Selected by the Youden index in the development cohort |
| True positive / false negative | 34 / 10 | 44 patients with CAI |
| True negative / false positive | 116 / 56 | 172 patients without CAI |
| Sensitivity | 77.3% | 95% CI, 63.0%-87.2% |
| Specificity | 67.4% | 95% CI, 60.1%-74.0% |
| Positive predictive value | 37.8% | 95% CI, 28.5%-48.1% |
| Negative predictive value | 92.1% | 95% CI, 86.0%-95.6% |
| Positive likelihood ratio | 2.37 | — |
| Negative likelihood ratio | 0.34 | — |
Table 4: Apparent classification performance at the data-derived Youden threshold. Confidence intervals for proportions were calculated using the Wilson method. The threshold was selected and evaluated in the same development cohort and has not undergone external validation. Abbreviations: CAI = coronary artery involvement; CI = confidence interval.
| Analysis | Patients / events | CRP per 10 mg/L, aOR (95% CI); p value | ESR per 10 mm/h, aOR (95% CI); p value | Illness day, aOR (95% CI); p value | Optimism-corrected AUC |
| Primary CAI definition (Z-score ≥2.0) | 216 / 44 | 1.151 (1.031-1.286); 0.012 | 1.158 (1.001-1.339); 0.048 | 1.130 (1.020-1.252); 0.020 | 0.710 |
| Coronary aneurysm (Z-score ≥2.5) | 216 / 29 | 1.160 (1.023-1.316); 0.021 | 1.103 (0.936-1.300); 0.242 | 1.151 (1.026-1.292); 0.017 | 0.704 |
| Complete KD only | 151 / 23 | 1.142 (1.002-1.301); 0.046 | 1.116 (0.923-1.349); 0.257 | 1.127 (0.989-1.284); 0.073 | 0.687 |
| Age <12 months | 183 / 39 | 1.148 (1.022-1.290); 0.020 | 1.164 (1.001-1.354); 0.048 | 1.136 (1.018-1.268); 0.023 | 0.706 |
Table 5: Sensitivity analyses of the parsimonious admission model. Each model included CRP, ESR, and illness day at the initial pretreatment echocardiogram. Internal validation used 1,000 bootstrap resamples. The complete-KD analysis was performed to reduce potential incorporation bias, as coronary findings can contribute to the diagnosis of incomplete KD. Abbreviations: aOR = adjusted odds ratio; AUC = area under the receiver operating characteristic curve; CAI = coronary artery involvement; CI = confidence interval; CRP = C-reactive protein; ESR = erythrocyte sedimentation rate; KD = Kawasaki disease.
Discussion
This study examined factors associated with coronary abnormalities present before IVIG in an infant-enriched KD cohort. Three admission-available variables—CRP, ESR, and illness day at the pretreatment echocardiogram—were retained in the parsimonious model. The inverse association observed for extremity changes in the unadjusted analysis weakened after adjustment for illness day and other covariates, and IVIG resistance was excluded from the model because it occurred after the coronary outcome had been measured. The methodological contribution of this study is the temporal separation of pretreatment and post-treatment information, adjustment for the timing of the initial echocardiogram, three-segment coronary assessment, and reporting of bootstrap-corrected model performance. Previous KD models have incorporated combinations of demographic characteristics, inflammatory markers, and baseline echocardiographic findings to predict subsequent coronary aneurysms, while other studies have confirmed associations between CRP and coronary lesions6,7. The present outcome was cross-sectional pretreatment CAI rather than a later post-treatment aneurysm, and the candidate predictors were restricted to information available at the time of the pretreatment echocardiogram. This temporal ordering avoids treating post-treatment IVIG resistance as a predictor of a coronary outcome already documented before treatment. It also limits the interpretation: the model estimates association within this cohort and should not be described as a validated tool for forecasting future coronary disease.
The exceptionally young age distribution reflects the departmental sampling frame. Most patients were admitted through the Department of Infants, which preferentially manages infants and very young children; therefore, the age distribution reflects the departmental referral pattern rather than the population distribution of KD in Qingdao or China. Infants may have incomplete presentations and a greater risk of coronary involvement5, but the narrow age range also reduces the ability to estimate age effects and restricts transportability. The reported odds ratios for CRP, ESR, and illness day, therefore, require confirmation in cohorts that include broader pediatric age groups, other hospital services, and different referral pathways. CRP remained associated with CAI in the primary model and in the analysis using the aneurysm threshold, whereas the association with ESR was weaker and did not persist when the outcome was restricted to Z-score ≥2.5. This pattern is consistent with CRP and ESR, reflecting overlapping but nonidentical aspects of the acute inflammatory response. It does not establish either marker as causal, nor does it make them novel KD biomarkers. Illness day was independently associated with CAI, emphasizing that coronary dimensions are observed within a changing disease process. A later initial echocardiogram provides more time for inflammation-related arterial enlargement to become detectable and may also mark delayed clinical recognition. The modest, statistically nonsignificant increase in apparent AUC over CRP alone further indicates that the combined model adds limited discrimination beyond a familiar inflammatory marker.
Extremity changes illustrate why timing and diagnostic structure matter. Patients with extremity changes underwent echocardiography earlier, more often met the complete KD criteria, and were less likely to be treated after illness day 10. Once illness day was included in the full model, the apparent protective association was attenuated and was no longer statistically significant. Extremity changes should therefore be interpreted as a marker of a readily recognizable clinical phenotype, rather than as a biological factor that protects the coronary arteries. Similarly, complete/incomplete KD status was not used as a predictor because coronary findings may help establish incomplete KD; entering that classification into a model for the same coronary findings would risk circular reasoning. The complete-KD sensitivity analysis provided a partial check on this concern and yielded directionally similar, although less precise, estimates. The blinded re-review of the LMCA, LAD, and RCA improved the completeness and reproducibility of coronary assessment. No patient had isolated LAD involvement that changed the patient-level CAI classification; nevertheless, three-segment coronary assessment minimizes the potential for outcome misclassification. A complete proximal three-segment examination is needed to avoid outcome misclassification and ensure reproducibility of the measurement protocol. The use of a single Z-score system also improved consistency between methods and results. Nevertheless, coronary Z-scores can vary among equations, particularly near category thresholds; external work should examine whether the findings are robust to other validated normalization systems.
The corrected performance estimates temper the clinical interpretation. The apparent AUC of 0.745 fell to 0.710 after bootstrap correction, and the corrected calibration slope of 0.82 indicated some overfitting. At the data-derived threshold, the positive predictive value was 37.8%, meaning that 62.2% of model-positive patients did not have pretreatment CAI. The negative predictive value was higher, but predictive values are prevalence-dependent and may change substantially in a broader KD population. The threshold was derived from the same data used to fit the model; no decision-curve analysis established net benefit, and no independent cohort was available. Accordingly, the model cannot support a rule-out pathway, replace pretreatment echocardiography, or justify a separate clinical risk category. At most, the findings identify variables that deserve attention while standard diagnostic and echocardiographic evaluation proceeds2,16. IVIG resistance was more frequent among patients who already had CAI before treatment. Because the definition of resistance requires observation after the initial infusion, this association is best understood as a relationship between two markers of a more severe disease course rather than as evidence that resistance predicted pretreatment coronary status. The temporal separation used here should be maintained in future analyses. Studies interested in IVIG resistance as a predictor should define a subsequent coronary endpoint and ensure that the predictor is measured before that endpoint.
Several limitations remain. The retrospective, single-center design and restriction to one infant-focused department introduce selection bias and limit generalizability. Only 44 primary outcome events were available, so coefficient estimates and corrected calibration remain imprecise despite restricting the final model to three predictors. Fourteen screened patients were excluded in a complete-case analysis, and missingness may not have been random. The analysis assessed pretreatment coronary status at a single time point and did not evaluate subsequent regression, progression, thrombosis, or other long-term outcomes. Residual confounding by referral delay, prehospital care, intercurrent infection, and unmeasured laboratory factors is possible. Finally, the model underwent only bootstrap internal validation; it has neither independent validation nor demonstrated clinical net benefit9. Future work should use prospectively specified measurement procedures, enroll a broader age spectrum across multiple centers, preserve the temporal ordering of predictors and outcomes, and evaluate the locked model in a sufficiently large external cohort. External validation should report discrimination, calibration-in-the-large, calibration slope, and clinically relevant net benefit rather than relying on AUC alone. Any recalibration should be guided by observed performance in external cohorts.
To conclude, in this infant-enriched single-center KD cohort, higher pretreatment CRP and ESR and a later illness day at the initial echocardiogram were associated with the presence of CAI before IVIG. Extremity changes did not remain independently associated after adjustment for timing, and IVIG resistance was appropriately treated as a post-treatment disease-course characteristic. The parsimonious model showed moderate discrimination, evidence of optimism, and a low positive predictive value. These findings are cohort-specific, do not replace echocardiography, and require independent validation before any clinical application.
Disclosures
The authors declare no competing interests.
Acknowledgements
The authors thank the pediatric cardiology and medical-records teams at Qingdao Women and Children's Hospital for their assistance with echocardiographic archive retrieval and data verification. This research received no external funding.
Materials
| Name | Company | Catalog Number | Comments |
|---|---|---|---|
| Aspirin | Bayer HealthCare Co., Ltd. | Enteric-coated tablets, 100 mg; H20120236 | |
| Automated hematology and CRP analyzer | Shenzhen Mindray Bio-Medical Electronics Co., Ltd., China | BC-7500 CRP | |
| Echocardiographic archive and measurement system | Institutional PACS / Samsung Medison | PACS/DICOM archive; HS70A electronic calipers | |
| ESR measurement system | Institutional clinical laboratory | Westergren-based system | |
| Hematology and CRP reagents | Shenzhen Mindray Bio-Medical Electronics Co., Ltd., China | Manufacturer-matched reagents and controls | |
| IBM SPSS Statistics | IBM Corp., Armonk, NY, USA | Version 26.0 | |
| Intravenous immunoglobulin | Shandong Taibang Biological Products Co., Ltd., China | Human Immunoglobulin (pH 4), 5%, 2.5 g/50 mL; S20013001 | |
| K2-EDTA blood collection tubes | Institutional clinical laboratory | Pediatric K2-EDTA tubes | |
| Pediatric cardiac phased-array transducer | Samsung Medison Co., Ltd., Republic of Korea | PA4-12B, 4–12 MHz | |
| Python statistical environment | Python Software Foundation and open-source contributors | Python 3.11.9; NumPy 1.26.4; pandas 2.2.2; SciPy 1.13.1; statsmodels 0.14.2; scikit-learn 1.5.1; Pingouin 0.5.4; Matplotlib 3.9.1; seaborn 0.13.2 | |
| Transthoracic echocardiography system | Samsung Medison Co., Ltd., Republic of Korea | HS70A |
References
- Burns JC. The etiologies of Kawasaki disease. J Clin Invest. 2024;134(5):e176938. doi:10.1172/JCI176938.
- McCrindle BW, et al. Diagnosis, treatment, and long-term management of Kawasaki disease: a scientific statement for health professionals from the American Heart Association. Circulation. 2017;135(17):e927-e999. doi:10.1161/CIR.0000000000000484.
- Uehara R, Belay ED. Epidemiology of Kawasaki disease in Asia, Europe, and the United States. J Epidemiol. 2012;22(2):79-85. doi:10.2188/jea.JE20110131.
- Rowley AH, Shulman ST. The epidemiology and pathogenesis of Kawasaki disease. Front Pediatr. 2018;6:374. doi:10.3389/fped.2018.00374.
- Salgado AP, et al. High risk of coronary artery aneurysms in infants younger than 6 months of age with Kawasaki disease. J Pediatr. 2017;185:112-116.e1. doi:10.1016/j.jpeds.2017.03.025.
- Son MBF, et al. Risk model development and validation for prediction of coronary artery aneurysms in Kawasaki disease in a North American population. J Am Heart Assoc. 2019;8(11):e011319. doi:10.1161/JAHA.118.011319.
- Shuai S, et al. Prediction of coronary artery lesions based on C-reactive protein levels in children with Kawasaki disease: a retrospective cohort study. J Pediatr (Rio J). 2023;99(4):406-412. doi:10.1016/j.jped.2023.02.005.
- Collins GS, Reitsma JB, Altman DG, Moons KGM. Transparent reporting of a multivariable prediction model for individual prognosis or diagnosis (TRIPOD): the TRIPOD statement. Ann Intern Med. 2015;162(1):55-63. doi:10.7326/M14-0697.
- Steyerberg EW, Harrell FE Jr. Prediction models need appropriate internal, internal-external, and external validation. J Clin Epidemiol. 2016;69:245-247. doi:10.1016/j.jclinepi.2015.04.005.
- Tremoulet AH, et al. Resistance to intravenous immunoglobulin in children with Kawasaki disease. J Pediatr. 2008;153(1):117-121. doi:10.1016/j.jpeds.2007.12.021.
- Lopez L, et al. Recommendations for quantification methods during the performance of a pediatric echocardiogram: a report from the Pediatric Measurements Writing Group of the American Society of Echocardiography Pediatric and Congenital Heart Disease Council. J Am Soc Echocardiogr. 2010;23(5):465-495; quiz 576-577. doi:10.1016/j.echo.2010.03.019.
- Haycock GB, Schwartz GJ, Wisotsky DH. Geometric method for measuring body surface area: a height-weight formula validated in infants, children, and adults. J Pediatr. 1978;93(1):62-66. doi:10.1016/S0022-3476(78)80601-5.
- Dallaire F, Dahdah N. New equations and a critical appraisal of coronary artery Z scores in healthy children. J Am Soc Echocardiogr. 2011;24(1):60-74. doi:10.1016/j.echo.2010.10.004.
- Riley RD, et al. Calculating the sample size required for developing a clinical prediction model. BMJ. 2020;368:m441. doi:10.1136/bmj.m441.
- Steyerberg EW, et al. Assessing the performance of prediction models: a framework for traditional and novel measures. Epidemiology. 2010;21(1):128-138. doi:10.1097/EDE.0b013e3181c30fb2.
- Jone PN, et al. Update on diagnosis and management of Kawasaki disease: a scientific statement from the American Heart Association. Circulation. 2024;150(23):e481-e500. doi:10.1161/CIR.0000000000001295.