A detailed method is described for evaluating mutant phenotypes of genes of interest and determining their roles in myoblast fusion using Drosophila embryos. This approach enables systematic characterization of gene function during embryonic muscle development.
Method Article
Genetic, Phenotypic, and Quantitative Analysis of Myoblast Fusion in Drosophila Embryos
In This Article
Summary
Abstract
The fusion of mononucleated myoblasts into multinucleated syncytia is a fundamental process in skeletal muscle development. Drosophila melanogaster is a powerful, genetically tractable model for rapidly and efficiently assessing the function of candidate genes involved in this process. Here, we describe a comprehensive protocol with step-by-step instructions for analyzing the myoblast fusion phenotype in Drosophila embryos. This method includes mutant line selection for candidate gene, embryo collection and fixation, whole-mount immunostaining, developmental staging, confocal imaging, and phenotypic analysis. Myosin heavy chain (MHC) staining is used to visualize overall muscle morphology and to identify unfused mononucleated myoblasts. In parallel, Even-skipped (Eve) staining labels nuclei within a specific muscle fiber, enabling quantitative analysis of fusion extent by counting the nuclei incorporated into that fiber. Taken together, this protocol enables the readers to assess the mutant phenotypes of any genes of interest and evaluate their roles in myoblast fusion. This approach provides a robust framework for identifying and characterizing novel regulators of myoblast fusion.
Introduction
Skeletal muscle is the most abundant tissue in the human body, accounting for more than 30% of total body weight. During embryonic development, skeletal muscle fibers are generated through the fusion of mononucleated muscle cells, known as myoblasts, into multinucleated syncytial myofibers1,2. This process is essential for proper muscle formation, growth, and function, and its disruption is associated with many muscular disorders3,4. Similar to vertebrate skeletal muscle, the multinucleated myofibers that constitute the embryonic and larval body wall musculature in Drosophila melanogaster are also formed through the fusion of mononucleated myoblasts5,6,7,8. In Drosophila, fusion occurs between two types of muscle cells, muscle founder cells and fusion-competent myoblasts (FCMs), at the asymmetric fusogenic synapse9,10,11,12,13. Importantly, the cellular events and molecular mechanisms governing myoblast fusion are highly conserved between Drosophila and vertebrates14,15,16, making Drosophila a powerful model organism for investigating the genetic and cellular basis of myoblast fusion.
The Drosophila model also offers several experimental advantages. First, the short life cycle of Drosophila (~10 days at 25 °C) enables rapid genetic crosses and efficient generation of mutant lines. Second, Drosophila embryos are small and readily permeable to antibodies after fixation, allowing whole-mount immunostaining and high-resolution imaging of muscle development without the need for tissue dissection. Third, Drosophila embryonic muscle development follows a highly stereotyped pattern, with 30 muscle fibers present in most abdominal hemisegments. Each muscle fiber is specified by a single founder cell that fuses with a defined number of FCMs (ranging from 3 to 30)17, enabling reproducible and quantitative analysis of myoblast fusion. Lastly, publicly available collections of gene mutants and deficiency lines carrying chromosomal deletions enable rapid loss-of-function analyses of almost all genes without requiring time-consuming de novo generation of mutants.
A detailed protocol for assessing myoblast fusion phenotypes in Drosophila embryos is presented (Figure 1). The protocol includes strategies for selecting appropriate mutant alleles, embryo collection and fixation, whole-mount immunostaining, embryo imaging, and quantitative analysis of fusion phenotypes. Collectively, these procedures provide a rapid and efficient workflow for the genetic analysis of candidate genes involved in myoblast fusion.
Protocol
1. Select mutant stocks for genetic analysis of myoblast fusion
- Search for mutant lines of the gene of interest in FlyBase. Open the corresponding gene report page and review the mutant alleles listed under “Alleles, Insertions, Constructs, and Aberrations.”
- Select null or strong loss-of-function alleles by examining the molecular lesions reported for each allele. Prioritize alleles containing nonsense mutations, frameshift mutations, deletions, or insertions that disrupt gene function.
- Place the selected mutant allele over a balancer chromosome carrying a fluorescent marker to distinguish homozygous mutant embryos from siblings carrying the balancer. Select an appropriate fluorescent balancer according to the chromosome carrying the mutant allele (Table 1).
2. Collect and fix Drosophila embryos
- Prepare embryo collection cups by creating multiple ventilation holes on the sides and bottoms of 100 mL plastic beakers using a 25 G needle (Figure 1).
- Prepare grape juice agar by combining 15 g agar with 400 mL distilled water (dH₂O) and autoclaving at 121 °C for 21 min. Cool the molten agar until hand-hot.
- Warm 100 mL of 100% grape juice until hand-hot and mix thoroughly with the molten agar. Dispense approximately 10 mL into each 60 mm culture dish, allow the plates to solidify at room temperature, and store at 4 °C.
- Prepare fresh yeast paste by mixing 10 g dry yeast in 15 ml dH₂O until smooth and spreadable. Apply the paste to the center of a grape juice agar plate and prewarm the plate to 25 °C (Figure 1).
NOTE: Store prepared yeast paste at 4 °C for up to 2 weeks. - Transfer 3−7-day-old adult flies heterozygous for the mutant allele and an appropriate fluorescent balancer into the collection cups.
NOTE: Use wild-type flies, such as w1118, as controls. Approximately 50−80 females and 40−50 males are sufficient for one collection cup. - Place a prewarmed grape juice agar plate over the collection cup and secure it with rubber bands (Figure 1). Incubate the collection cup at 25 °C for 12 h.
- Gently tap the collection cup to dislodge the flies and replace the plate with a fresh, prewarmed plate. Repeat the plate replacement every 12 h for 2 days to acclimate the flies.
NOTE: Prewarm each plate to 25 °C before use because egg laying is reduced on cold plates. - Replace the plate with a fresh, prewarmed plate after the 2-day acclimation period. Allow the flies to lay eggs overnight for 14−15 h.
- Fill a 1.5 mL microcentrifuge tube with 0.1% (v/v) Triton X-100 in distilled water. Collect the embryos from the plate using a paintbrush pre-soaked in 0.1% Triton X-100, then transfer them into the tube.
- Shake the tube vigorously to resuspend the embryos and remove residual yeast paste. Allow the embryos to settle, then wash with 0.1% Triton X-100 at least 3 times, or until the solution becomes clear (Figure 1).
- Add 1.5 mL of ~50% household bleach to obtain a final sodium hypochlorite concentration of 2.85%. Nutate for 3 min to dechorionate the embryos.
NOTE: Avoid prolonged bleach exposure, as over-dechorionation can damage embryos and compromise subsequent immunostaining. - Allow the embryos to settle, remove the bleach, and wash 3x with 0.1% Triton X-100.
- Remove the remaining wash solution and add 700 µL of 3.7% formaldehyde in phosphate-buffered saline (PBS) and 700 µL of heptane.
CAUTION: Handle formaldehyde and heptane in a fume hood and dispose of them according to appropriate chemical safety procedures. - Cap the tube tightly and shake vigorously for 30 s. Nutate the embryos for 30 min to complete fixation.
- Allow the embryos to accumulate at the interface between the upper heptane phase and lower aqueous phase (Figure 1). Carefully remove the aqueous phase without disturbing the embryos.
- Add approximately 700 µL of methanol and shake vigorously for 30 s to devitellinize the embryos.
NOTE: Successfully devitellinized embryos sink to the bottom of the tube, whereas detached vitelline membranes remain at the interface (Figure 1).
CAUTION: Handle methanol in a fume hood and dispose of it in accordance with appropriate chemical safety procedures. - Remove the heptane and methanol while keeping the embryos covered with a small volume of methanol. Wash the embryos twice with methanol.
- Rehydrate the embryos by washing three times with PBST (0.1% Triton X-100 in PBS) for 5 min per wash on a nutator. Protect the embryos from light during this and all subsequent steps.
NOTE: Keep the embryos covered with solution after devitellinization to prevent dehydration and preserve embryo morphology. Minimize exposure to ambient light to preserve fluorescent proteins and fluorophore-conjugated antibodies.
3. Perform whole-mount immunostaining
- Remove PBST and incubate the embryos in 1.5 mL PBSBT (0.5% BSA (w/v) and 5 mM NaN3 in PBST) for at least 1 h at room temperature on a nutator.
- Cut the end of a pipette tip to create a wider opening and minimize mechanical damage during embryo transfer.
- Transfer the blocked embryos to a 0.5 mL microcentrifuge tube and remove the blocking solution. Add 200−300 µL of fresh PBSBT containing anti-MHC antibody (1:500)18 and/or anti-Eve antibody (0.5 µg/mL).
- Incubate the embryos with the primary antibodies overnight at 4 °C on a nutator.
NOTE: Perform anti-Eve co-staining for quantitative analysis after identifying a myoblast fusion phenotype. Either rabbit or rat anti-MHC antibody can be used to visualize the Drosophila embryonic musculature. - Remove the primary antibody solution and wash the embryos three times with PBST for 10 min per wash on a nutator.
NOTE: Store the primary antibody solution at 4 °C for reuse when appropriate. The solution can typically be reused up to three times within 1 month. - Incubate the embryos in 300 µL PBSBT containing appropriate fluorescent secondary antibodies at a 1:500 dilution for 2 h at room temperature on a nutator.
- Remove the secondary antibody solution and wash the embryos three times with PBST for 10 min per wash.
- Remove the final PBST wash and add approximately 80 µL of mounting medium. Transfer the embryos onto a microscope slide, gently place a coverslip over the sample, and seal the edges (Figure 1).
NOTE: Store prepared slides at 4 °C, protected from light, and image them as soon as possible for optimal fluorescence signal.
4. Stage and image embryos
- Identify late stage 15 embryos by the characteristic heart-shaped morphology of the midgut19 under brightfield illumination.
NOTE: MHC protein expression is undetectable in stage 14 or earlier embryos. In stage 16 embryos, the heart-shaped midgut undergoes constriction and is subdivided into four chambers19. - Identify homozygous mutant embryos by the absence of the fluorescent marker.
NOTE: Homozygous mutant embryos do not carry the fluorescently marked balancer; therefore, they do not express the fluorescent protein. Omit this step for wild-type control embryos. - Select laterally oriented embryos to visualize the entire somatic musculature labeled with anti-MHC antibody.
NOTE: Dorsally or ventrally oriented embryos primarily reveal the corresponding portion of the musculature. Use laterally oriented embryos to comprehensively assess myoblast fusion defects. - Adjust the laser power and detector gain to obtain clear MHC fluorescence without signal saturation, and maintain these settings for all samples within each experiment. Define the upper and lower limits of the z-stack to encompass the entire depth of the somatic musculature.
- Set the image resolution to 1024 × 1024 pixels, pinhole to 1 Airy unit, line/frame average to 1, and zoom factor to 1, and maintain these settings for all samples within each experiment. Acquire confocal z-stack images at 1.0 µm intervals using a 40× oil-immersion objective.
- Image approximately 6−10 embryos per genotype to assess the reproducibility of the phenotype.
NOTE: Acquire the fluorescent balancer-marker channel simultaneously with the MHC channel when confirmation of the homozygous mutant genotype is required.
5. Image the DA1 muscle for fusion quantification
- Perform MHC and Eve co-staining after identifying a myoblast fusion defect in laterally oriented embryos.
- Select dorsally oriented stage 15 mutant and control embryos for imaging.
NOTE: Even-skipped (Eve) is specifically expressed in dorsal acute muscle 1 (DA1) nuclei20. Quantify myoblast fusion by determining the number of Eve-positive nuclei incorporated into the DA1 muscle. - Adjust the imaging parameters to obtain clear MHC and Eve fluorescence without signal saturation. Define a z-stack encompassing the entire depth of the DA1 muscle based on the Eve signal.
- Acquire confocal z-stack images using the imaging parameters described above. Image approximately 6−10 embryos per genotype for fusion quantification.
6. Quantify nuclei and perform statistical analysis
- Identify abdominal hemisegments A1−A7 according to their stereotyped and repetitive muscle patterns.
- Identify Eve-positive nuclei within the MHC-labeled DA1 muscle. Examine the complete z-stack and count all Eve-positive nuclei located at different focal planes within each DA1 muscle.
NOTE: Each abdominal hemisegment contains a single DA1 muscle. Therefore, all Eve-positive nuclei within a given hemisegment are counted toward its corresponding DA1 muscle. - Quantify DA1 nuclei in the same set of abdominal hemisegments, such as A2−A5, for each embryo.
NOTE: While DA1 muscles from abdominal hemisegments A1−A7 are suitable for quantification, analyzing all seven hemisegments is unnecessary. Instead, quantify several hemisegments per embryo, such as A2−A5, and analyze the same set of hemisegments across all embryos to maintain consistency. - Calculate the mean number of nuclei per DA1 muscle for each embryo and use the mean value as one independent data point. Enter the individual embryo data points into statistical analysis software for analysis and plotting.
- Use a two-tailed Student’s t-test to compare two conditions. Use one-way ANOVA followed by Dunnett’s test to compare three or more conditions, and consider p < 0.05 statistically significant.
Results
The FlyBase gene report page for spook (spo) is presented as an example to illustrate the selection of an appropriate mutant allele. spo is one of the “Halloween” genes encoding enzymes involved in steroid hormone biosynthesis21,22and has been shown to promote myoblast fusion23. The “Alleles” section of the spo FlyBase gene report page lists 12 spo mutant alleles reported in the literature, of which four have been deposited at BDSC (Figure 2A) and are readily available. If a desired allele is not available through BDSC, it may be requested directly from the research group that originally reported the mutant line.
Among the four mutant alleles available from BDSC, spo1 carries a missense mutation (G481E), whereas spoMI06810 contains a MiMIC insertion within the coding sequence that results in a frameshift at amino acid Y341 (Figure 2B,C). Because the Spo protein consists of 543 amino acids, spoMI06810 (Y341fs) is predicted to produce a truncated protein lacking approximately 40% of its total length and is therefore likely to represent a strong loss-of-function allele. Thus, spoMI06810 is preferred over spo1 for phenotypic analysis of myoblast fusion.
Myoblast fusion begins during embryonic stage 12 (7.3−9.3 h after egg laying [AEL]) and is largely completed by the end of stage 15 (11.3−13.3 h AEL)24. Fusion phenotypes are therefore typically assessed in late-stage 15 embryos, when the somatic muscle pattern has formed, and most fusion events have been completed.
Stage 15 embryos can be identified by two prominent morphological features: completion of dorsal closure and acquisition of the characteristic heart-shaped morphology of the midgut (Figure 3A–C)19. Stage 14 embryos can be distinguished by ongoing head involution (Figure 3A), whereas stage 15 embryos display the characteristic heart-shaped midgut (Figure 3B). Stage 16 embryos can be identified by midgut constriction and the formation of four chambers (gastric caeca; Figure 3C)19. In addition, MHC protein expression is undetectable at earlier stages, including stage 14, but becomes robust at stage 15 and later stages (Figure 3A–C).
At late embryonic stage 15, the body wall musculature is fully patterned in wild-type (w1118) embryos, and most abdominal hemisegments display an identical, stereotyped muscle pattern in the lateral view (Figure 3B). This stereotyped muscle pattern can be visualized using either rabbit or rat anti-MHC antibodies (Figure 3B,D). In contrast, fewer muscle fibers are visible when embryos are imaged in the dorsal or ventral orientation (Figure 3E,F). Therefore, imaging embryos in the lateral orientation enables visualization of the entire body wall musculature and facilitates assessment of myoblast fusion defects.
To examine myoblast fusion defects, the body wall musculature of homozygous mutant embryos is imaged in the lateral orientation. Homozygous mutants are identified by the absence of a fluorescent balancer marker, such as GFP or YFP. For example, homozygous spo mutant embryos derived from spoMI06810/TM3, twi>UAS-GFP parents are GFP-negative, whereas sibling embryos carrying the balancer express GFP in the mesoderm (Figure 4B,C). Compared with wild-type and GFP-positive sibling embryos, spo mutant embryos exhibit a myoblast fusion defect characterized by the presence of numerous unfused fusion-competent myoblasts (FCMs; Figure 4A–C).
Notably, more unfused FCMs are observed in deeper optical sections (Z3 and Z4) than in the surface section (Z1) of spo mutant embryos (Figure 4B). This distribution reflects the spatial organization of founder cells and FCMs during embryonic myoblast fusion. Founder cells and growing myotubes are primarily located in the superficial layer of the mesoderm, whereas FCMs reside in deeper layers before migrating toward and fusing with growing myotubes25. Consequently, unfused myoblasts are more abundant in deeper confocal sections, particularly in embryos with partial fusion defects. Acquisition of z-stacks spanning the entire depth of the body wall musculature is therefore necessary to avoid underestimating the severity of the fusion phenotype.
Although visualization of the overall body wall musculature in the lateral orientation enables phenotypic assessment of myoblast fusion defects, quantitative analysis can be performed by visualizing the DA1 muscle in the dorsal orientation. In wild-type embryos, the DA1 muscle is fully formed and contains 13.03 ± 0.60 Eve-positive nuclei (Figure 5A,C). In spo mutant embryos, the number of Eve-positive nuclei in the DA1 muscle is reduced to 8.16 ± 0.54 (Figure 5B,C), indicating a fusion defect in which fewer FCMs fuse with the DA1 founder cell. For consistent and reproducible quantification, Eve-positive nuclei in the DA1 muscles of the same abdominal hemisegments (A2−A5) are counted and averaged per embryo, with the mean from each embryo used as a single data point for statistical analysis (Figure 5C).
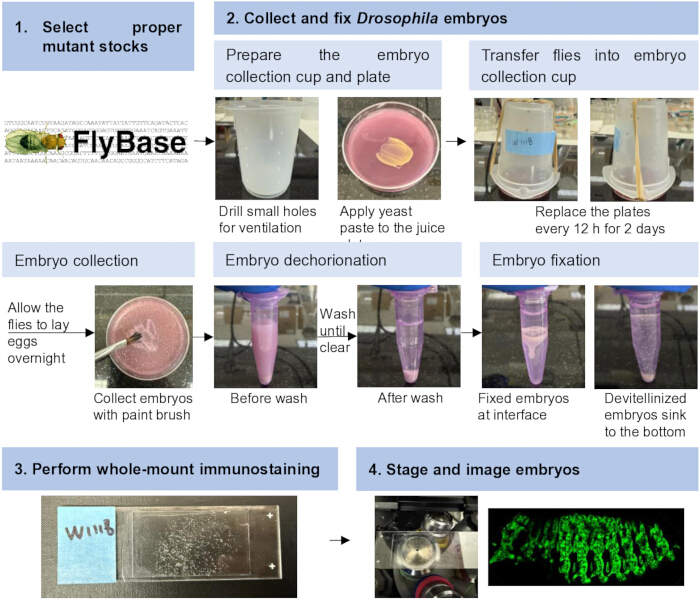
Figure 1: Workflow for genetic, phenotypic, and quantitative analysis of myoblast fusion in Drosophila embryos. The workflow includes selection of appropriate mutant stocks, embryo collection and fixation, whole-mount immunostaining and mounting, and embryo staging and imaging. Please click here to view a larger version of this figure.
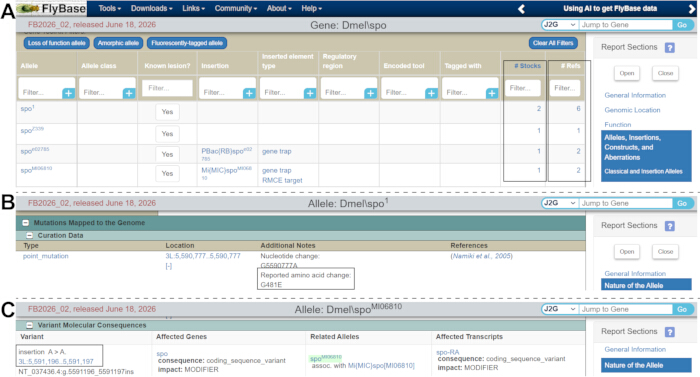
Figure 2: Selection of mutant alleles using FlyBase. (A) Screenshot of the FlyBase gene report page for spo. Mutant alleles are listed in the “Alleles” section. The Stocks column (boxed) indicates the number of stocks available, whereas the Refs column (boxed) indicates the number of associated references. (B,C) Molecular lesions of two representative spo mutant alleles, spo1 (B) and spoMI06810 (C). Please click here to view a larger version of this figure.
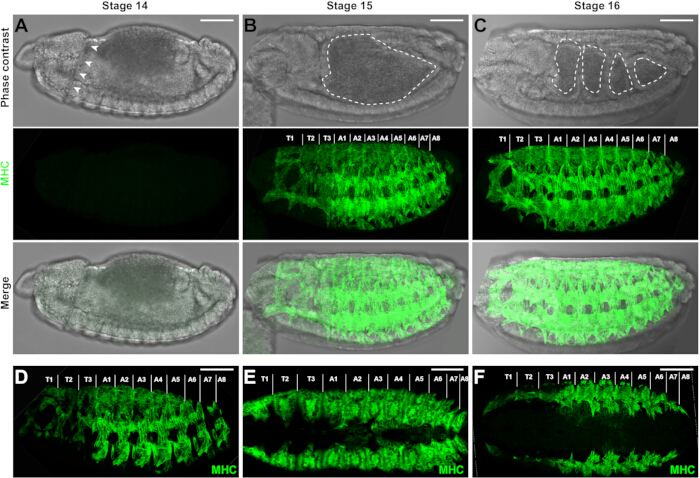
Figure 3: Drosophila embryonic musculature. (A–C) Phase-contrast images, MHC-stained z-projection confocal images, and merged images of wild-type (WT) embryos at stages 14, 15, 16. Head involution is evident (arrowheads) in the stage 14 embryo (A). A characteristic heart-shaped midgut (dashed line) is observed in the stage 15 embryo (B), whereas the midgut is subdivided into four distinct chambers (dashed lines) in the stage 16 embryo (C). MHC protein expression is undetectable at stage 14 (A) but becomes robust at stages 15 (B) and 16 (C). Embryos are shown in lateral view, with anterior to the left, posterior to the right, dorsal side up, and ventral side down. Thoracic (T1–T3) and abdominal (A1–A8) hemisegments are indicated. (D) Confocal image of the lateral view of the musculature in a stage 15 WT embryo visualized using a rat anti-MHC antibody. A rabbit anti-MHC antibody was used for the images in the other panels. (E,F) Z-projection confocal images of the dorsal (E) and ventral (F) views of the musculature in stage 15 WT embryos. Fewer muscle fibers are visible in the dorsal and ventral orientations than in the lateral orientation. Scale bar = 50 µm. Please click here to view a larger version of this figure.
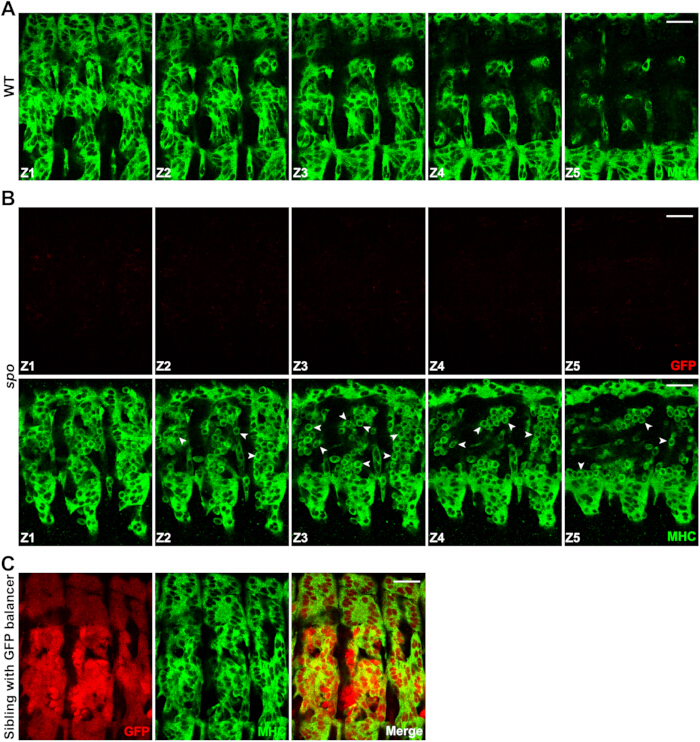
Figure 4: Comparison of the musculature between wild-type and spo mutant embryos. (A) Representative confocal z-stack images of the body wall musculature in the lateral view of a late-stage 15 WT embryo. Myoblast fusion is complete, and no unfused myoblasts are observed. MHC is shown in green. (B) Representative confocal z-stack images of the body wall musculature in the lateral view of a GFP-negative spo mutant embryo obtained from spoMI06810/TM3, twi>UAS-GFP parents. The absence of GFP fluorescence (red) indicates that the embryo is homozygous for spoMI06810. Arrowheads indicate representative unfused myoblasts. More unfused myoblasts are observed in the deeper optical sections (Z3 and Z4) than near the embryo surface (Z1). MHC is shown in green. (C) Confocal images of the lateral view of a GFP-positive sibling embryo obtained from the same spoMI06810/TM3, twi>UAS-GFP parents. Mesodermal GFP expression (red) driven by the twi>UAS-GFP transgene on the TM3 balancer distinguishes GFP-positive sibling embryos from GFP-negative homozygous spo mutant embryos. MHC is shown in green. Scale bar = 20 µm. Please click here to view a larger version of this figure.
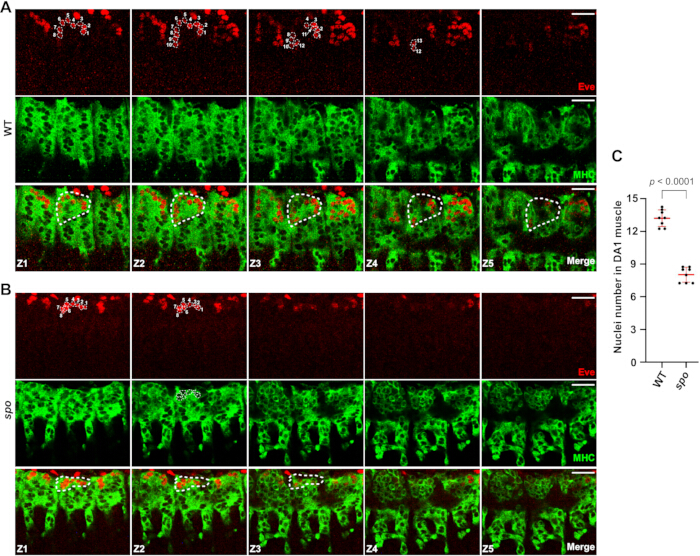
Figure 5: Representative confocal z-stack images and quantification of DA1 muscles. (A,B) Confocal z-stack images of the dorsal views of late stage 15 WT (A) and spo mutant (B) embryos labeled with anti-MHC (green) and anti-Eve (red). Confocal z-stacks were acquired through the entire depth of the Eve-positive DA1 muscle to capture all nuclei within the muscle. Eve-positive nuclei appear as unstained regions within the MHC signal. A representative DA1 muscle is outlined with a dashed line, and the Eve-positive nuclei within the DA1 muscle are numbered. (C) Quantification of Eve-positive nuclei in the DA1 muscles of WT and spo mutant embryos. Eight embryos were quantified for each genotype. Each data point represents the average number of nuclei in the DA1 muscles of hemisegments A2–A5 from one embryo. Data are presented as mean ± SD (red bars). Statistical significance was determined using a two-tailed Student’s t-test; p < 0.0001. Scale bar = 20 µm. Please click here to view a larger version of this figure.
| BDSC stock number | Genotype | Purpose |
| 6873 | N1/FM7c, twi>UAS-GFP | Mesodermal GFP expression allows the identification of GFP-negative, homozygous mutant embryos. |
| 6662 | wgGla-1/CyO, twi>UAS-GFP | |
| 6663 | DrMio/TM3, twi>UAS-GFP | |
| 23229 | baz4/FM7c, Dfd-YFP | Head-specific YFP expression allows identification of YFP-negative, homozygous mutant embryos. |
| 23230 | snaSco/ CyO, Dfd-YFP | |
| 23232 | Dr1/TM6B, Dfd-YFP |
Table 1: Drosophila stocks carrying a fluorescent marker gene on balancer chromosomes.
Discussion
The protocol described here provides a comprehensive workflow for the genetic, phenotypic, and quantitative analysis of myoblast fusion in Drosophila embryos. Importantly, the observation of a fusion defect in a mutant line requires additional genetic analyses to validate that the gene of interest is responsible for the observed phenotype. Spontaneous background mutations may accumulate during stock maintenance and contribute to mutant phenotypes26. One approach is to examine trans-heterozygous embryos generated by crossing the mutant allele with a chromosomal deficiency that deletes the gene of interest. Observation of the same fusion defect in these embryos would support the conclusion that the phenotype results from disruption of the candidate gene rather than from unrelated background mutations. Genetic rescue experiments, such as those using the GAL4/UAS system27, can provide further validation by determining whether expression of the gene of interest restores normal myoblast fusion in mutant embryos.
Although the Drosophila Gene Disruption Project has generated a publicly available collection of mutant lines covering approximately 75% of Drosophila genes28, suitable mutant alleles, particularly strong loss-of-function alleles, may not be available for every gene of interest. In such cases, chromosomal deficiency lines can serve as an alternative resource for assessing whether a candidate gene is involved in myoblast fusion. Currently available deficiency line collections cover more than 98% of the euchromatic Drosophila genome29, enabling loss-of-function analysis of nearly all genes. Chromosomal deficiencies can be identified under the “Aberrations” section of the FlyBase gene report. However, because each deficiency line removes multiple genes, a myoblast fusion defect observed in homozygous deficiency embryos cannot be attributed to a specific gene within the deleted chromosomal region without further validation. Therefore, when a fusion defect is identified using a deficiency line, a single-gene knockout mutant should be generated and analyzed to determine the specific role of the candidate gene in myoblast fusion.
Although this protocol focuses on the phenotypic analysis of mutants for individual genes of interest, the workflow can also be applied to large-scale deficiency screens for novel regulators of myoblast fusion using available deficiency collections29. In addition, replacing the MHC antibody with antibodies against specific myoblast fusion regulators allows the general workflow, including embryo collection, fixation, and immunostaining, to be adapted for examining protein localization relative to the fusogenic synapse. Finally, the methods described here can be adapted for phenotypic analysis of other embryonic developmental processes beyond myoblast fusion, thereby extending the protocol's utility to a broader range of developmental studies.
Disclosures
The authors declare that they have no competing interests. ChatGPT 5 (OpenAI) was used solely for grammar and language editing. It was not used to generate scientific content, data, analyses, or figures.
Acknowledgements
We thank the Bloomington stock center for fly stocks. This work was supported by NIH grants R01AR085116 and R35GM136316 to E.H.C.
Materials
| Name | Company | Catalog Number | Comments |
|---|---|---|---|
| Agar | Fisher | BP1423-500 | Agar powder; used to prepare solid culture medium. |
| Bovine serum albumin (BSA) | Sigma | A7906 | Bovine serum albumin; used for preparation of blocking solutions during immunostaining. |
| Confocal microscope | Leica | SP8 | Laser-scanning confocal microscope used for fluorescence imaging of stained specimens. |
| Confocal microscope | Nikon | A1R | Laser-scanning confocal microscope used for fluorescence imaging of stained specimens. |
| Coverslip | Fisher | 12-545-CP | Glass coverslip, 40 mm × 22 mm; used for mounting specimens for microscopy. |
| Culture dish | Corning | 430166 | 60 mm culture dish; used for handling, culturing, or processing biological specimens. |
| Dry yeast | Sigma | YSC2 | Dry yeast used as a nutritional source for organism culture. |
| Formaldehyde, 37% | Fisher | BP531-500 | Concentrated formaldehyde solution used for preparation of fixative. CAUTION: Toxic and volatile; handle using appropriate personal protective equipment and in a chemical fume hood. |
| Goat anti-mouse IgG 647 | ThermoFisher | A-21236 | Fluorophore-conjugated goat anti-mouse IgG secondary antibody for fluorescence detection of mouse primary antibodies. |
| Goat anti-rabbit IgG 568 | ThermoFisher | A-11036 | Fluorophore-conjugated goat anti-rabbit IgG secondary antibody for fluorescence detection of rabbit primary antibodies. |
| Heptane | Fisher | H350 | Organic solvent used during specimen fixation and permeabilization. CAUTION: Flammable and harmful; handle in a chemical fume hood with appropriate personal protective equipment. |
| Incubator | Percival | I36LL | Temperature-controlled incubator used for maintaining cultures or experimental organisms under defined environmental conditions. |
| Methanol | Pharmco | 339000ACSBK01 | Methanol used during fixation, dehydration, or permeabilization of specimens. CAUTION: Flammable and toxic; handle in a chemical fume hood with appropriate personal protective equipment. |
| Microscope slides | Fisher | 12-550-15 | Glass microscope slides used for mounting specimens for imaging. |
| Mounting medium | ThermoFisher | P36980 | Antifade mounting medium used to preserve fluorescence and mount stained specimens for microscopy. |
| Mouse anti-Even skipped (Eve) | DSHB | 2B8 | Mouse monoclonal primary antibody recognizing Even skipped protein; used for immunofluorescence staining. |
| Nutator | Corning | 6720 | Benchtop nutating mixer used for gentle and continuous agitation of samples during washing, blocking, or antibody incubation steps. |
| Plastic beaker | Sigma | Z245380 | The 100 mL plastic beaker is used to create fly collection cup. |
| Rabbit anti-Myosin heavy chain (MHC) | — | — | Rabbit primary antibody recognizing Drosophila myosin heavy chain; antibody source described by Kiehart and Feghali (1986), Journal of Cell Biology 103, 1517–1525. |
| Rat anti-Myosin heavy chain (MHC) | DSHB | BB7/21.14 | Rat monoclonal primary antibody recognizing myosin heavy chain; used for immunofluorescence staining. |
| Sodium azide (NaN3) | Sigma | S8032 | Sodium azide used as a preservative in antibody or buffer solutions. CAUTION: Highly toxic; avoid ingestion, inhalation, skin contact, and contact with metals. |
| Triton X-100 | Fisher | AAA16046AP | Nonionic detergent used for membrane permeabilization and preparation of washing or blocking buffers. |
| 10× phosphate-buffered saline (PBS) | Fisher | BP3994 | Concentrated phosphate-buffered saline used to prepare 1× PBS for washing, dilution, and buffer preparation. |
References
- Abmayr SM, Pavlath GK. Myoblast fusion: Lessons from flies and mice. Development. 2012;139(4):641-656.
- Petrany MJ, Millay DP. Cell fusion: Merging membranes and making muscle. Trends Cell Biol. 2019;29(12):964-973.
- Wherley TJ et al. Current topics in developmental biology. Vol. 158. Academic Press; 2024:53-82.
- Millay DP. Regulation of the myoblast fusion reaction for muscle development, regeneration, and adaptations. Exp Cell Res. 2022;415(2):113134.
- Dworak HA, Sink H. Myoblast fusion in Drosophila. Bioessays. 2002;24(7):591-601.
- Schejter ED. Myoblast fusion: Experimental systems and cellular mechanisms. Semin Cell Dev Biol. 2016;60:112-120.
- Deng S, Azevedo M, Baylies M. Acting on identity: Myoblast fusion and the formation of the syncytial muscle fiber. Semin Cell Dev Biol. 2017;72:45-55.
- Lee DM, Chen EH. Drosophila myoblast fusion: Invasion and resistance for the ultimate union. Annu Rev Genet. 2019;53:67-91.
- Bate M. The development of Drosophila melanogaster. CSH Laboratory Press; New York; 1993:1013-1090.
- Baylies MK, Bate M, Ruiz Gomez M. Myogenesis: A view from Drosophila. Cell. 1998;93(6):921-927.
- Chen EH, Olson EN. Towards a molecular pathway for myoblast fusion in Drosophila. Trends Cell Biol. 2004;14(8):452-460.
- Sens KL et al. An invasive podosome-like structure promotes fusion pore formation during myoblast fusion. J Cell Biol. 2010;191(5):1013-1027.
- Kim JH et al. Mechanical tension drives cell membrane fusion. Dev Cell. 2015;32(5):561-573.
- Chen EH. Invasive podosomes and myoblast fusion. Curr Top Membr. 2011;68:235-258.
- Kim JH, Jin P, Duan R, Chen EH. Mechanisms of myoblast fusion during muscle development. Curr Opin Genet Dev. 2015;32:162-170.
- Kim JH, Chen EH. The fusogenic synapse at a glance. J Cell Sci. 2019;132(18).
- Haralalka S, Abmayr SM. Myoblast fusion in Drosophila. Exp Cell Res. 2010;316(18):3007-3013.
- Kiehart DP, Feghali R. Cytoplasmic myosin from Drosophila melanogaster. J Cell Biol. 1986;103(4):1517-1525.
- Campos-Ortega JA, Hartenstein V. The embryonic development of Drosophila melanogaster. 2nd ed. Springer Berlin Heidelberg; Berlin, Heidelberg; 1997:9-102.
- De Joussineau C, Bataille L, Jagla T, Jagla K. Diversification of muscle types in Drosophila: Upstream and downstream of identity genes. Curr Top Dev Biol. 2012;98:277-301.
- Namiki T et al. Cytochrome P450 CYP307A1/Spook: A regulator for ecdysone synthesis in insects. Biochem Biophys Res Commun. 2005;337(1):367-374.
- Niwa R, Niwa YS. Enzymes for ecdysteroid biosynthesis: Their biological functions in insects and beyond. Biosci Biotechnol Biochem. 2014;78(8):1283-1292.
- Ruan ZR, Yu Z, Xing C, Chen EH. Inter-organ steroid hormone signaling promotes myoblast fusion via direct transcriptional regulation of a single key effector gene. Curr Biol. 2024;34(7):1438-1452.e6.
- Beckett K, Baylies MK. 3D analysis of founder cell and fusion competent myoblast arrangements outlines a new model of myoblast fusion. Dev Biol. 2007;309(1):113-125.
- Richardson B, Beckett K, Baylies M. Visualizing new dimensions in Drosophila myoblast fusion. BioEssays. 2008;30(5):423-431.
- Huang W et al. Spontaneous mutations and the origin and maintenance of quantitative genetic variation. eLife. 2016;5.
- McGuire SE, Roman G, Davis RL. Gene expression systems in Drosophila: A synthesis of time and space. Trends Genet. 2004;20(8):384-391.
- Bellen HJ et al. The Drosophila Gene Disruption Project: Progress using transposons with distinctive site specificities. Genetics. 2011;188(3):731-743.
- Cook RK et al. The generation of chromosomal deletions to provide extensive coverage and subdivision of the Drosophila melanogaster genome. Genome Biol. 2012;13(3).
Reprints and Permissions
This article has been published
Video Coming Soon