This protocol presents a reproducible workflow for developing, evaluating, and interpreting explainable artificial intelligence models in healthcare. It integrates standardized data preparation, model development, explainability techniques, quantitative evaluation, and reproducibility practices to improve transparency, reliability, and clinical applicability.
Method Article
A Reproducible Experimental Protocol for Developing and Evaluating Explainable Artificial Intelligence Models in Healthcare Systems
In This Article
Summary
Abstract
Artificial intelligence (AI) is increasingly being adopted as a valuable tool for clinical decision-making, disease prediction, medical diagnosis, and personalized healthcare. However, a lack of transparency, inconsistent implementation of explainable artificial intelligence (XAI) methods, and limited reproducibility remain major barriers to the trustworthy deployment of AI models in clinical settings. This paper proposes a systematic, reproducible, and transparent protocol for developing, evaluating, and interpreting explainable AI models for healthcare applications. The workflow begins with computational environment setup, followed by data acquisition and characterization, preprocessing, feature engineering, model development, hyperparameter optimization, predictive performance evaluation, explainability analysis, statistical validation, and reproducibility assessment. The protocol incorporates XAI methods such as SHapley Additive exPlanations (SHAP), Local Interpretable Model-agnostic Explanations (LIME), Gradient-weighted Class Activation Mapping (Grad-CAM), Integrated Gradients, attention visualization, and counterfactual explanations to generate both global and local model interpretations. The protocol emphasizes several key components, including the preparation of standardized healthcare datasets, the development of stable machine learning models, the evaluation of predictive performance, the generation of clinically relevant explanations, and the statistical assessment of reproducibility across repeated experiments. By integrating model development, explainability, quantitative and qualitative evaluation, statistical validation, and reproducibility assessment into a unified workflow, this protocol provides a comprehensive framework for developing transparent and reproducible AI models for healthcare applications.
Introduction
AI has become an integral component of modern healthcare by enabling intelligent analysis of complex clinical data and supporting evidence-based medical decision-making1. The rapid digitization of healthcare through electronic health records, medical imaging systems, wearable devices, and genomic technologies has generated large volumes of heterogeneous data that require advanced computational approaches for effective interpretation2.
Machine learning (ML) and deep learning (DL) algorithms have demonstrated remarkable capabilities in extracting meaningful patterns from multidimensional healthcare datasets, thereby improving diagnostic accuracy, disease prediction, and patient outcome assessment3. AI-based models have been successfully applied in radiology, pathology, cardiology, oncology, ophthalmology, and other medical specialties to assist clinicians in detecting diseases at earlier stages and recommending personalized treatment strategies4. These technologies have also contributed to workflow optimization, reduced diagnostic variability, and improved healthcare resource utilization5.
Recent developments in computational hardware, cloud computing, and open-source AI frameworks have accelerated the development and deployment of intelligent healthcare applications6. Consequently, AI has become a key enabling technology for precision medicine and clinical decision-support systems7. Despite these advances, the widespread adoption of AI in routine clinical practice remains limited because many high-performing models offer little insight into how their predictions are generated8.
Most deep learning algorithms function as complex black-box models in which the internal decision-making process is difficult for clinicians and researchers to understand9. Although these models often achieve excellent predictive performance, their lack of transparency undermines user confidence and poses challenges for clinical validation, regulatory approval, and patient safety10. Healthcare professionals must be able to justify AI-assisted decisions before incorporating them into routine clinical practice, particularly in high-risk medical environments11.
XAI has emerged as an effective approach to improving the transparency and interpretability of machine learning models12. Rather than treating prediction models as opaque systems, XAI techniques provide information about the features, image regions, or clinical variables that contribute to individual predictions13. Such explanations enable clinicians to better understand model behavior, identify potential biases, and determine whether AI-generated decisions are consistent with established medical knowledge14.
Several explainability techniques have been introduced for healthcare applications. SHapley Additive explanations (SHAP) measure the contribution of each feature to model prediction on the basis of cooperative game theory15. Local Interpretable Model-agnostic Explanations (LIME) create a simplified model and explain the predictions of the blackbox model16. For medical image tasks using deep learning models, Gradient-weighted activation maps (Grad-CAM) create heatmaps that visually indicate the regions of an image that contribute to classification decisions17. The combination of these methods has dramatically enhanced the transparency of AI systems across different healthcare domains18.
Despite the growing attention to explainability methods in healthcare settings, their use remains varied in the literature. Researchers differ not only in the use of preprocessing strategies but also in the design of model architecture, evaluation metrics, and even explanation techniques19. Also, many papers report high predictive accuracy but fail to provide a thorough assessment of the quality of explanations or their reproducibility20.
Reproducibility is one of the major bottlenecks in modern AI science. Papers often do not disclose the software version, computational environment, preprocessing pipeline, hyperparameter settings, random seed initialization, and hardware configurations21. Because of this, independent researchers often fail to reproduce published results or to verify the published methods using other datasets or software platforms22. Lack of detailed documentation is one of the factors hampering benchmarking studies, collaborative research, and clinical translation of AI systems23.
Recognizing these challenges, several organizations and regulatory agencies have emphasized the importance of transparent, trustworthy, and reproducible AI for healthcare applications24. Existing reporting guidelines have improved methodological reporting but primarily describe what should be reported rather than providing standardized experimental procedures that researchers can directly implement25. Consequently, there remains a need for a comprehensive protocol that integrates dataset preparation, model development, explainability analysis, statistical evaluation, and reproducibility practices into a single experimental workflow26.
A standardized experimental protocol offers several advantages for the healthcare AI community. Moreover, it promotes methodological consistency, facilitates comparison of independent studies, increases the transparency of computational experiments, and enables reliable validation of published results27. Standardized workflows also assist education/ training, collaborative research, and regulatory evaluation through clearly documented procedures that are reproducible across different laboratories and healthcare institutions28.
A reproducible experimental protocol for training and evaluating AI models in healthcare systems was developed and tested. The protocol outlines standards for configuring the computational environment, preprocessing healthcare datasets, developing machine-learning models, applying XAI methods, evaluating predictive performance, performing statistical validation, and assessing reproducibility29. Integration of such components into a coherent workflow is likely to boost the transparency, reliability, and reproducibility of healthcare AI research, as well as help develop trusted intelligent health systems30.
Protocol
The worked validation experiment used the publicly available, de-identified Pima Indians Diabetes Dataset and did not involve identifiable patient records or new patient recruitment. Therefore, informed consent and institutional IRB/ethics approval were not required, and all analyses were conducted in accordance with applicable dataset terms and institutional research policies.
The worked validation example uses the publicly available Pima Indians Diabetes Dataset, which contains 768 records for binary diabetes prediction. The complete nine-stage core workflow was applied to this dataset. The nine core stages comprised dataset selection and validation, computational environment configuration, data preprocessing, dataset partitioning, model development and training, predictive and computational performance evaluation, explainability analysis, statistical validation, and reproducibility assessment. External validation and clinical expert evaluation were retained as optional validation modules and were not performed in the present worked example. Figure 1 illustrates the core protocol workflow, and Table 1 summarizes only the nine core stages implemented in the present worked validation; optional external validation and clinical expert evaluation are described separately within the Protocol and are not included among the nine experimental stages.
1. Select and validate the healthcare dataset
- Select the Pima Indians Diabetes Dataset as the primary dataset for the worked validation example. Verify the dataset source, sample size, prediction target, class distribution, and data structure.
- Apply the predefined inclusion, exclusion, and data-quality criteria. Remove duplicate and invalid records before model development.
- Record the dataset source, characteristics, prediction task, class distribution, inclusion and exclusion criteria, and partitioning strategy in Table 2.
- Apply decision criteria for dataset and model selection
- Define the prediction objective before selecting the dataset, model architecture, preprocessing strategy, or explainability method.
- Match the dataset modality to the prediction objective. Select tabular data for structured clinical variables, imaging data for medical images, time-series data for physiological signals, text data for clinical narratives, or multimodal data when complementary modalities are available for the same patient or study unit.
- Evaluate candidate datasets according to sample size, outcome availability, class distribution, missingness, annotation quality, clinical relevance, data completeness, and accessibility. Select the dataset that satisfies the predefined requirements.
- Select conventional machine-learning models for structured tabular data when the sample size, computational resources, or interpretability requirements limit the use of complex architectures. Select deep-learning architectures when sufficient training data and high-dimensional inputs, such as medical images, physiological signals, or clinical text, are available.
- Select multimodal architectures only when multiple modalities are available for the same patient or study unit and can be reliably aligned without introducing information leakage. Select preprocessing operations according to the characteristics of the selected data modality.
- Select explainability methods according to the model and data modality. Use model-agnostic methods such as SHAP or LIME for appropriate tabular models and modality-specific methods such as Grad-CAM for image-based models, when applicable.
- Document the rationale for the dataset, preprocessing strategy, model, and explainability-method selections. Preserve these decisions as part of the reproducibility record.
2. Configure the computational environment for XAI model development
- Configure the operating system, CPU, RAM, storage, and GPU according to the selected model requirements. Create an isolated Python environment and install the required machine learning, deep learning, statistical, visualization, and XAI libraries.
- Record the actual computational environment, model architecture, and hyperparameters used for the worked validation in Table 3. Specify the optimizer, learning rate, batch size, maximum number of epochs, loss function, regularization parameters, validation strategy, early-stopping configuration, random-seed configuration, explainability methods, hardware, operating system, Python version, and relevant software-library versions. Distinguish these experimentally used settings from general or recommended protocol settings.
- Use the configuration reported in Table 3 when reproducing the Pima Indians Diabetes Dataset validation and the corresponding predictive, explainability, statistical, and reproducibility results.
- Execute a validation script to confirm successful package import, dataset loading, model execution, and output generation. Preserve the finalized environment configuration for reproducibility.
3. Prepare and characterize healthcare datasets for XAI model development
- Select and acquire the healthcare dataset
- Select a healthcare dataset appropriate for the defined clinical prediction task. Evaluate candidate datasets according to the research objective, data type, sample size, annotation quality, class balance, and clinical relevance.
- Prefer publicly available benchmark datasets when they adequately address the prediction task and facilitate independent validation.
- Obtain the required ethical approvals, institutional permissions, and data-access authorization before acquiring institutional or in-house datasets. Obtain the selected dataset from a verified repository or authorized institutional database.
- Preserve the original dataset files without modification and record the dataset provider, version, acquisition information, licensing conditions, inclusion criteria, exclusion criteria, and accompanying metadata. Organize the dataset into separate directories for raw data, annotations, metadata, and supplementary information.
- Characterize the healthcare dataset
- Identify the predictor variables, outcome labels, feature types, data modalities, and class distributions. Determine the number of subjects, samples, feature dimensions, and available annotations.
- Confirm that the dataset characteristics are compatible with the selected AI method.
- Use the Pima Indians Diabetes Dataset as the sole worked experimental dataset for validating the nine-stage core protocol. Include the additional datasets listed in Table 2 only to demonstrate the applicability of the general protocol across clinical tabular data, electronic health records, dermoscopic images, physiological time-series data, and medical imaging. Do not use these additional datasets for model training, testing, statistical validation, or generation of the reported experimental results.
- Assess dataset quality
- Inspect the dataset for duplicate records, corrupted files, missing values, annotation errors, and irregular data entries. Remove confirmed duplicate records and correct verified formatting irregularities. Document all dataset quality-control procedures.
- Verify the correspondence of imaging, clinical, laboratory, and physiological data through subject identifiers when using multimodal datasets.
- Remove duplicate or inconsistent records, handle missing values, standardize numerical features, encode categorical variables, and apply modality-specific preprocessing. Partition the dataset into independent training, validation, and test sets. Refer to Figure 2 for the workflow for healthcare dataset preparation, preprocessing, partitioning, and quality assessment.
- Ensure data privacy and ethical compliance
- Remove direct identifiers from healthcare data. Apply anonymization or pseudonymization procedures when required. Handle patient health information in accordance with applicable ethical, data protection, informed consent, and institutional requirements.
- Record the applicable ethical approval, waiver, data-governance procedures, anonymization methods, and dataset-preparation workflow.
- Assess potential algorithmic bias by comparing model performance across relevant demographic or clinical subgroups when such information is available and ethically permissible.
- Document the intended use, target population, model limitations, potential failure modes, human-oversight requirements, and applicable ethical, data-protection, and healthcare regulatory requirements.
- Record identified fairness limitations and responsible-AI considerations as part of the final model documentation.
NOTE: Obtain a standardized and documented healthcare dataset that is suitable for AI model development, ethically compliant, and free from major identified inconsistencies.
4. Preprocess and partition healthcare data for AI model training
- Perform quality control
- Inspect the dataset for duplicate records, missing values, invalid values, inconsistent labels, outliers, and corrupted files.
- Remove or correct invalid observations according to predefined criteria and record all exclusions. Verify the consistency of predictor variables and outcome labels.
- Handle missing data
- Quantify missingness for each variable. Apply the predefined imputation or exclusion strategy.
- Estimate imputation parameters using the training data only and apply the fitted transformation to validation and testing data.
- Normalize and transform data
- Apply feature scaling, normalization, encoding, dimensionality reduction, or other transformations required by the selected model. Fit all data-dependent transformations using only the training data.
- Apply the fitted transformations unchanged to validation and testing data.
- Quantify class imbalance in the training data. Apply class weighting, SMOTE, oversampling, or augmentation only to the training dataset. Preserve the original distribution of the validation and testing datasets.
- Confirm that no subject, duplicate observation, augmented sample, preprocessing statistic, feature-selection criterion, or synthetic sample is shared between training and evaluation partitions.
5. Develop and configure the XAI model
- Define the model architecture by specifying the input data modalities, preprocessing operations, modality-specific feature encoders, feature fusion mechanism, prediction layer, and explainability module.
- Select the machine learning or deep learning architecture according to the prediction task and input modality. Configure the input layer, feature-extraction components, hidden layers, output layer, and activation functions. Define the optimizer, learning rate, batch size, loss function, epochs, regularization, dropout, early stopping, and learning-rate schedule.
- Optimize hyperparameters using the training and validation data only.
- Record the finalized architecture and hyperparameter configuration in Table 3.
- Verify input-output dimensional compatibility before training.
NOTE: Establish a fully configured XAI model containing an appropriate architecture, defined hyperparameters, and integrated explainability techniques.
6. Train, optimize, and preserve the XAI model
- Load the predefined training and validation datasets and the finalized model configuration. Initialize the model using the predefined random seed and training parameters.
- Train the model using the specified optimizer, loss function, batch size, and stopping criteria.
- Monitor validation performance and retain the checkpoint corresponding to the predefined model-selection criterion. Evaluate the selected checkpoint on the independent testing dataset without further optimization.
- Save the trained model, preprocessing configuration, hyperparameters, random seed, and training log.
NOTE: Obtain an optimized XAI model trained and validated using the prepared healthcare dataset. Preserve the best-performing model, hyperparameters, training logs, preprocessing configuration, and computational environment for reproducibility.
7. Evaluate predictive and computational performance
- Evaluate predictive performance
- Load the optimized model and independent testing dataset after completing model training and hyperparameter optimization. Keep the trained model parameters and preprocessing pipeline unchanged during testing.
- Generate predictions for all samples in the testing dataset. Compare the predicted outputs with the corresponding ground-truth labels.
- Calculate performance metrics
- Select evaluation metrics according to the type of prediction task.
- Calculate accuracy, precision, recall, specificity, F1-score, balanced accuracy, Matthews correlation coefficient (MCC), and area under the receiver operating characteristic curve (AUC-ROC) for classification tasks, as applicable. Calculate mean absolute error (MAE), root mean square error (RMSE), coefficient of determination (R2), and other relevant measures for regression tasks, as applicable.
- Evaluate model generalization and robustness
- Evaluate the model using an external dataset collected independently from the development dataset whenever such data are available.
- Prefer external datasets originating from a different healthcare institution, geographic region, or patient population to assess transportability.
- Perform temporal validation using data collected during a later period when longitudinal datasets are available.
- Perform multicenter validation by evaluating the finalized model separately across participating institutions when multicenter data are available.
- Perform geographic validation using an independent population from a different geographic region when feasible.
- Report performance differences and confidence intervals between the development and external datasets.
- Evaluate computational performance
- Measure model training time under the predefined computational environment, inference and testing time under identical computational conditions, and memory consumption, model size, and hardware utilization.
- Repeat computational measurements across independent runs.
- Calculate the mean execution time to reduce the effect of experimental variability.
- Compare model performance
- Select appropriate conventional machine learning or deep learning methods for comparative evaluation.
- Evaluate the proposed XAI model and comparator models using the same dataset. Apply identical preprocessing procedures and evaluation metrics to all comparative models.
- Perform all comparative experiments within the same computational environment.
NOTE: Obtain experimental evidence of predictive stability and reproducibility under the tested computational conditions and dataset.
8. Generate and evaluate XAI outputs
- Generate model explanations
- Load the optimized XAI model. Select evaluation samples that were not used for model training. Apply the predefined explainability methods without modifying the trained model or preprocessing pipeline.
- Generate global and local model explanations
- Generate global explanations to characterize the overall behavior of the predictive model.
- Generate local explanations to characterize individual model predictions.
- Apply SHAP to the Pima Indians Diabetes Dataset to generate global and local explanations of the tabular model predictions.
- Generate a SHAP summary plot to visualize the overall direction and magnitude of feature contributions.
- Generate a SHAP feature-importance plot using mean absolute SHAP values to rank features according to their overall contribution to model predictions.
- Generate a SHAP waterfall plot for a representative test-set prediction to illustrate patient-specific feature contributions.
- Generate a SHAP feature-dependence plot to examine the relationship between a selected feature and its contribution to the model output.
- Apply LIME to representative test-set predictions to generate local explanations of individual model predictions.
- Generate a patient-specific counterfactual explanation to illustrate the feature changes associated with a change in the predicted outcome.
- Select additional explainability techniques according to the data modality and model architecture.
- Use Grad-CAM or saliency maps for compatible image-based models, attention visualizations for transformer-based architectures, and Integrated Gradients for differentiable models when applicable.
- Treat Grad-CAM, saliency mapping, attention visualization, and Integrated Gradients as general, modality-dependent protocol options, and do not interpret or report them as experimental results from the Pima Indians Diabetes Dataset validation unless the corresponding analyses are actually performed.
- Apply explainability methods to the worked Pima validation
- Apply SHAP and LIME to the Pima Indians Diabetes Dataset to generate global and local explanations of the tabular model predictions.
- Generate SHAP summary, feature-importance, waterfall, and feature-dependence visualizations from the Pima validation results.
- Generate a LIME local explanation for representative test-set predictions.
- Generate a patient-specific counterfactual explanation to illustrate the feature changes associated with a change in the model prediction.
- Treat Grad-CAM, attention visualization, saliency mapping, and Integrated Gradients as modality-dependent explainability options for other healthcare data types and model architectures.
- Do not report Grad-CAM, attention visualization, saliency mapping, or Integrated Gradients as experimental findings from the Pima worked validation unless the corresponding analyses are actually performed.
- Evaluate explanation quality
- Assess whether the generated explanations reflect the model's prediction process. Evaluate the stability of explanations across repeated experimental runs, and the consistency of explanation outputs under identical computational conditions.
- Assess the sensitivity of explanation outputs to changes in input data when applicable. Compare generated explanations with available domain knowledge or expert interpretations.
- Identify predictive features or anatomical regions that correspond with established medical knowledge when such comparisons are available.
- Record the level of agreement or disagreement between the generated explanations and the available clinical interpretation.
- Quantify prediction uncertainty
- Generate prediction-confidence estimates for the evaluated samples using an uncertainty-estimation method appropriate to the selected model architecture and healthcare application.
- Apply Monte Carlo dropout, ensemble-based prediction, Bayesian inference, conformal prediction, or another validated uncertainty-estimation approach when appropriate.
- Repeat stochastic prediction passes when using Monte Carlo dropout and calculate the mean prediction and predictive variance for each evaluation sample.
- Report prediction confidence or uncertainty intervals together with the corresponding model predictions.
- Evaluate whether uncertainty estimates identify predictions associated with lower reliability or increased prediction error. Preserve the uncertainty estimation method, parameters, random seeds, and generated uncertainty outputs to ensure reproducibility.
- Document and preserve explainability outputs
- Save all generated feature-importance scores, heatmaps, saliency maps, attention visualizations, and patient-specific interpretations. Store the explainability outputs using standardized file formats. Archive the outputs together with the trained model and preprocessing configuration.
- Record the computational settings, explanation parameters, execution time, and software versions used for explanation generation. Preserve the complete explainability documentation to facilitate independent review and reproducibility.
- Quantitatively evaluate explanation quality
- Evaluate explanation faithfulness by systematically perturbing or masking the features identified as important and measuring the corresponding change in model output. Calculate an explanation-faithfulness score by comparing the magnitude of attribution with the resulting change in model prediction.
- Evaluate explanation stability by generating explanations for repeated runs, perturbed inputs, or clinically similar samples and calculating the similarity between the resulting attribution patterns. Calculate infidelity by measuring the discrepancy between the predicted output change and the change estimated from the explanation attribution under controlled input perturbations.
- For medical-image explanations, evaluate localization accuracy using an expert-defined region of interest when reference annotations are available. Assess clinical usefulness by obtaining independent evaluations from qualified clinical experts using predefined interpretation criteria.
- Calculate Cohen's kappa or Fleiss' kappa when multiple experts independently evaluate explanation relevance or agreement.
NOTE: Generate global and local explanations that characterize the predictive behavior of the trained AI model. Preserve the explainability outputs and corresponding configurations for transparent interpretation and reproducible evaluation.
9. Perform statistical validation and reproducibility assessment
- Perform statistical validation
- Select statistical methods according to the study objective, experimental design, data distribution, and characteristics of the evaluated variables.
- Report continuous variables as the mean ± standard deviation or as the median and interquartile range, as appropriate, and categorical variables as counts and percentages.
- Perform five-fold cross-validation on the training set to assess model performance stability and report accuracy, AUC-ROC, precision, recall, and F1-score as mean ± standard deviation across folds. Estimate 95% confidence intervals for the independent test-set performance metrics using 1,000 bootstrap resamples.
- Compare the proposed model with the CNN, Random Forest, and SVM baseline models using McNemar's test for paired accuracy comparisons, DeLong's test for correlated AUC-ROC comparisons, and paired bootstrap testing with 1,000 resamples for F1-score comparisons.
- Report the corresponding test statistic and exact p-value for each comparison and use a two-sided significance level of α = 0.05.
- Compare model performance statistically
- Compare the proposed explainable AI model with the selected state-of-the-art machine learning and deep learning baseline models.
- Apply Student's t-test or the Mann-Whitney U test when comparing two groups, as appropriate. Apply one-way ANOVA for applicable parametric comparisons involving more than two groups. Apply the Kruskal-Wallis test for applicable nonparametric comparisons involving more than two groups.
- Consider p < 0.05 statistically significant, as specified in the original manuscript.
- Use a two-sided significance level of α = 0.05 for all predefined statistical comparisons and report the corresponding test statistics and p-values.
- Report 95% confidence intervals for the principal predictive performance metrics.
- Use bootstrap resampling to estimate confidence intervals for performance measures when appropriate. Use DeLong's test to compare correlated ROC-AUC values when the same subjects are evaluated by two models. Use McNemar's test to compare paired categorical classification outcomes generated for the same subjects. Use paired bootstrap procedures to compare F1-score or other derived performance metrics when appropriate.
- Evaluate calibration using calibration plots, calibration slope/intercept, and Brier score when probabilistic predictions are available.
- For the worked Pima Indians Diabetes Dataset validation, use the predefined paired statistical comparison specified for the proposed model and baseline models. Apply the selected test consistently to the paired test-set predictions or repeated-run performance measurements, as appropriate to the comparison. Use a two-sided significance level of α = 0.05 and report the test statistic and exact p-value. Do not report alternative statistical tests as having been performed unless their results are presented in the Results section.
- Apply two-sided tests and interpret statistical significance using a predefined threshold of p < 0.05.
- Evaluate model robustness
- Repeat the complete training and evaluation procedure 10 times using different random seeds while maintaining the predefined dataset partitioning, preprocessing procedures, model architecture, hyperparameters, software environment, and evaluation protocol.
- Record the AUC-ROC, accuracy, and F1-score for each independent run and report the mean ± standard deviation across the 10 runs.
- Compare the resulting performance values across repeated runs to assess predictive stability and reproducibility under different random initializations.
- Evaluate explainability reproducibility
- Generate feature attributions, attention maps, or other explanation outputs across multiple experimental runs when explanation-stability assessment is included. Compare the explanation outputs quantitatively across repeated runs using an appropriate similarity or rank-based agreement measure.
- For the present Pima Indians Diabetes Dataset worked validation, do not report quantitative explanation-stability metrics unless the corresponding repeated explanation outputs and analyses have been performed.
- Evaluate agreement between model-generated explanations and clinician interpretations when appropriate clinical evaluations are available. Calculate Cohen's kappa or Fleiss' kappa, as appropriate, to evaluate agreement between raters.
- Document reproducibility
- Preserve the raw data, preprocessing procedures, source code, trained models, hyperparameter configurations, explainability outputs, statistical analysis scripts, and generated results.
- Record the software environment and hardware configuration used throughout the workflow. Re-execute the complete workflow independently using the archived files and configurations.
- Compare the replicated predictive performance with the original experimental results, and the replicated model explanations with the original explainability outputs.
- Record any differences observed during replication. Update the experimental documentation to reflect reproducibility observations identified during the independent execution.
NOTE: Obtain statistically validated predictive-performance and explainability results that can be evaluated across repeated experiments. Preserve sufficient computational, analytical, and methodological documentation to enable independent verification of the complete workflow.
- Reproducibility Checklist
- Record the dataset name, version, acquisition date, source, inclusion criteria, exclusion criteria, and final sample count. Record all preprocessing operations, transformation parameters, normalization settings, feature-selection procedures, and data-partitioning rules.
- Record the operating system, CPU, GPU, RAM, Python version, framework versions, and library versions. Record all model architecture specifications and hyperparameters.
- Record optimizer, learning rate, batch size, number of epochs, loss function, regularization, and early-stopping criteria. Record all random seeds and random-number-generator settings.
- Preserve trained model weights and preprocessing configurations. Preserve training logs, evaluation scripts, statistical-analysis scripts, and explainability outputs. Record model and software versions used for the final experiments.
- Preserve the complete computational environment required for independent replication.
- Document the availability of source code, datasets, model weights, and supporting materials subject to ethical, legal, licensing, and privacy restrictions.
- Re-execute the archived workflow independently and compare the replicated results with the original results.
- Document the complete reproducibility requirements using the standardized checklist.
Results
The proposed XAI framework was implemented using the Pima Indians Diabetes Dataset as the representative healthcare dataset. The Pima Indians Diabetes Dataset was used as the sole experimental validation dataset. All reported predictive, explainability, statistical, and reproducibility results were generated from this dataset. TCGA-BRCA, TCGA-UCEC, MIMIC-III, ISIC 2019, HAM10000, OhioT1DM, and BraTS 2021 were not experimentally evaluated and are included only as examples illustrating the general protocol's applicability across different healthcare data modalities. The complete dataset was used after invalid and duplicate records were removed, and the specified preprocessing operations were performed before model development. The dataset was partitioned into independent training, validation, and test subsets using a predefined stratified splitting strategy. Sample independence across the three subsets was maintained to minimize the possibility of data leakage.
The predictive model was configured using the predefined architecture and hyperparameters. The model was trained using the Adam optimizer with the predefined learning rate and batch size for up to 100 epochs. Early stopping based on validation loss was applied, and the model corresponding to the best validation performance was retained. Random seeds were specified for dataset partitioning, model initialization, and repeated experiments to improve reproducibility.
The trained model was evaluated on the independent test set using accuracy, precision, recall, specificity, F1-score, Matthews correlation coefficient (MCC), area under the receiver operating characteristic curve (AUC-ROC), and average precision (AP). The proposed model was compared with the predefined baseline models using identical preprocessing procedures, data partitions, and evaluation protocols. Receiver operating characteristic (ROC) curves, precision-recall curves, and a confusion matrix were generated from the independent test-set predictions.
Five-fold cross-validation was performed on the training data to assess performance stability. 95% confidence intervals were estimated for the principal performance metrics, and predefined statistical comparisons were conducted between the proposed model and the baseline models.
Five-fold cross-validation produced an accuracy of 93.01 ± 0.48%, AUC-ROC of 0.954 ± 0.007, precision of 92.42 ± 0.87%, recall of 93.02 ± 0.45%, and F1-score of 92.72 ± 0.62%. The 95% bootstrap confidence intervals estimated from 1,000 resamples were 0.897–0.973 for accuracy, 0.890–0.970 for precision, 0.880–0.963 for recall, 0.887–0.965 for F1-score, and 0.931–0.984 for AUC-ROC. Statistical comparisons with the CNN, Random Forest, and SVM baseline models were performed using McNemar's test for accuracy, DeLong's test for AUC-ROC, and paired bootstrap testing with 1,000 resamples for F1-score.
The complete training and evaluation procedure was repeated across 10 independent runs using different random seeds. The repeated runs yielded an AUC-ROC of 0.957 ± 0.008, an accuracy of 93.24 ± 0.74%, and an F1-score of 92.35 ± 0.92%, indicating relatively low variability across repeated executions. Performance metrics obtained across repeated executions were summarized using the mean and standard deviation. Variability across runs was examined to determine whether predictive performance remained stable under repeated execution.
External validation was not performed in the present worked example because no independent external dataset was used. Accordingly, all reported predictive, statistical, and reproducibility results were obtained from the Pima Indians Diabetes Dataset using the predefined training, validation, and independent test partitions. External validation was retained in the protocol as an optional procedure for applications in which an independent dataset from a different institution, population, geographic region, or time period is available.
Model explanations were generated using explainability techniques applicable to the tabular Pima Indians Diabetes Dataset, including SHAP and LIME. Global feature importance was evaluated, and patient-specific local explanations were generated using held-out test samples. The explanation outputs were recorded together with the corresponding model predictions and feature values to facilitate reproducibility and subsequent interpretation.
For clarity, the present worked example comprised the nine core workflow stages identified in Table 1. External validation and clinical expert evaluation were retained as optional validation modules of the general protocol. External validation was not performed because no independent external dataset was used, and clinical expert evaluation was not performed because no formal expert evaluation panel was included in the present worked example. Accordingly, these optional modules are not considered part of the nine-stage experimental workflow and are not reported as experimental outcomes.
The preprocessing and dataset-partitioning procedures produced a standardized dataset suitable for model development. Duplicate and inconsistent records were removed, missing values were handled according to the predefined strategy, numerical features were standardized, and the dataset was partitioned into independent training, validation, and test subsets. The resulting dataset characteristics and preprocessing procedures are summarized in Table 2. The general healthcare dataset preparation and preprocessing workflow is illustrated in Figure 2, whereas the experimental preparation, preprocessing, partitioning, and quality-assessment workflow applied specifically to the Pima Indians Diabetes Dataset is shown in Figure 3. The final computational environment, model architecture, and hyperparameter configuration used to generate the reported results are summarized in Table 3.
Execution of Sections 3 and 4 yielded a standardized healthcare dataset suitable for model development. The preprocessing procedures removed duplicate and inconsistent records, imputed missing values, standardized numerical features, encoded categorical variables where applicable, and partitioned the dataset into training, validation, and test subsets. The resulting data provided the standardized input required for subsequent model development.
After completion of Sections 5 and 6, the configured model demonstrated stable convergence during training. The learning curves showed concurrent decreases in training and validation losses and increases in training and validation accuracy. Hyperparameter optimization improved model generalization, with no evidence of substantial overfitting. To support reproducibility, the optimized model was archived together with the finalized architecture, hyperparameter settings, software versions, random seeds, and trained model weights. Model-training specifications and optimization outcomes are summarized in Table 4, and the corresponding training and validation learning curves are presented in Figure 4.
Section 7 evaluated the model's predictive performance using standardized performance metrics. The evaluated classification metrics included accuracy, precision, recall, specificity, F1-score, MCC, AUC-ROC, and AP. The proposed model was compared with the predefined baseline models using the same dataset partitions, preprocessing procedures, and evaluation protocol. The predictive performance comparison is presented in Table 5, whereas the ROC curves, precision-recall curves, confusion matrix, and comparative performance metrics are shown in Figure 5.
Following Section 8, both global and local explanations of the model's predictions were generated to evaluate its interpretability. Model explanations were generated using SHAP and LIME for the tabular Pima Indians Diabetes Dataset, and a patient-specific counterfactual explanation was produced to illustrate a change in the prediction. SHAP was used to generate global feature importance, patient-specific waterfall, and feature dependence visualizations, while LIME was used to generate local explanations from held-out test samples. The corresponding explainability outputs are presented in Figure 6.
The final stage of the protocol evaluated the statistical reliability and reproducibility of the workflow. The complete workflow was repeated across 10 independent runs using different random seeds while maintaining the same dataset-partitioning strategy, preprocessing parameters, model architecture, hyperparameters, software environment, and evaluation procedures. The repeated runs yielded an AUC-ROC of 0.957 ± 0.008, an accuracy of 93.24 ± 0.74%, and an F1-score of 92.35 ± 0.92%, indicating relatively low variability across repeated executions.
Explanation stability was not quantitatively evaluated in the present worked validation. Although SHAP and LIME explanations were generated for the Pima Indians Diabetes Dataset, no separate inter-run rank-correlation or feature-overlap analysis was performed. Therefore, no numerical explanation, stability, or attribution-agreement metrics are reported. Quantitative explanation-stability assessment is retained in the general protocol as an optional reproducibility procedure for applications in which repeated explanation outputs are available.
Statistical comparisons were evaluated using a predefined significance threshold of p < 0.05. Two-sided statistical tests were used where applicable, and the corresponding test statistics, p-values, and 95% confidence intervals were reported to quantify the statistical significance and uncertainty of the observed performance differences. The experimental statistical validation and reproducibility results, including cross-validation performance, confidence intervals, statistical comparisons, and repeated-run variability, are summarized in Table 6. The corresponding statistical testing and reproducibility analyses are illustrated in Figure 7.
These results provided experimental evidence of predictive stability and reproducibility under the tested computational conditions and dataset. The computational environment, dataset characteristics, preprocessing procedures, model configuration, statistical analyses, and explainability settings required for independent replication were documented in accordance with the reproducibility checklist presented in Table 7. Clinical expert evaluation of the generated XAI outputs was not performed in the worked validation example of the present work.
Overall, applying the protocol produced a standardized healthcare dataset suitable for AI model development and an optimized model using predefined hyperparameter settings. The workflow enabled systematic evaluation of predictive performance, generation of model explanations using applicable XAI techniques, and statistical assessment of model robustness and reproducibility. Together, the results demonstrated the implementation and reproducibility of the proposed XAI workflow under the experimental conditions evaluated in the worked validation example.
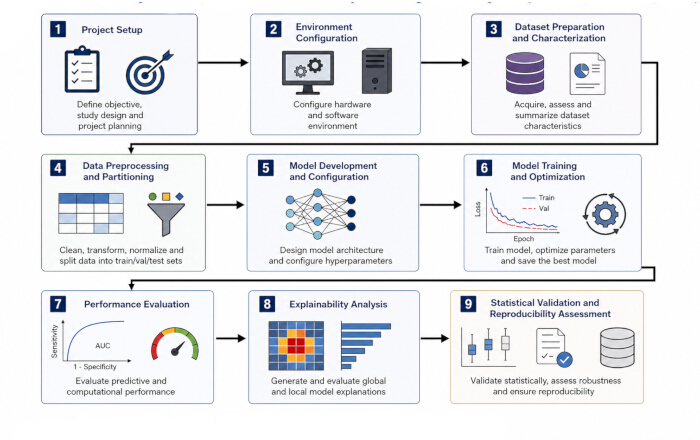
Figure 1: Nine-stage core workflow for developing reproducible and explainable AI models in healthcare. The workflow comprises (1) healthcare prediction-task definition, (2) computational-environment configuration, (3) dataset acquisition and validation, (4) data preprocessing, (5) dataset partitioning, (6) predictive-model training, (7) predictive-performance evaluation, (8) explainability analysis, and (9) statistical validation and reproducibility assessment. External validation and clinical expert evaluation are treated as optional protocol extensions and are not included in the nine-stage core workflow. Please click here to view a larger version of this figure.
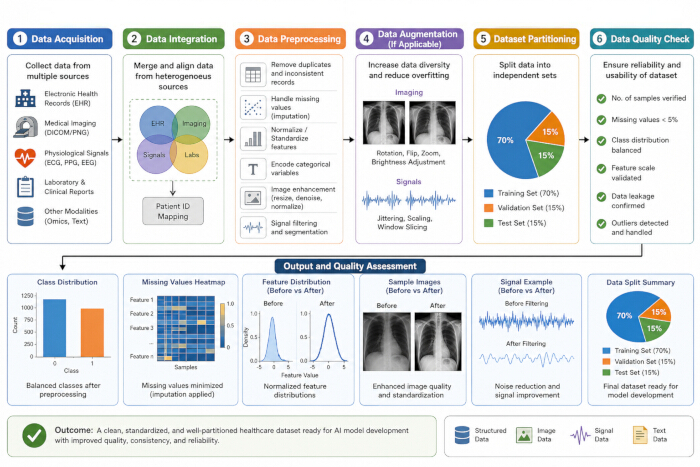
Figure 2: Workflow for healthcare dataset preparation and preprocessing. (A) Healthcare data acquisition from clinical records, medical imaging, physiological signals, and multimodal data sources. (B) Data integration and preprocessing, including missing value handling, normalization, noise removal, and augmentation. (C) Dataset partitioning into training, validation, and testing subsets. (D) Quality assessment showing class distribution, feature normalization, and preprocessing outputs prior to model development. Please click here to view a larger version of this figure.
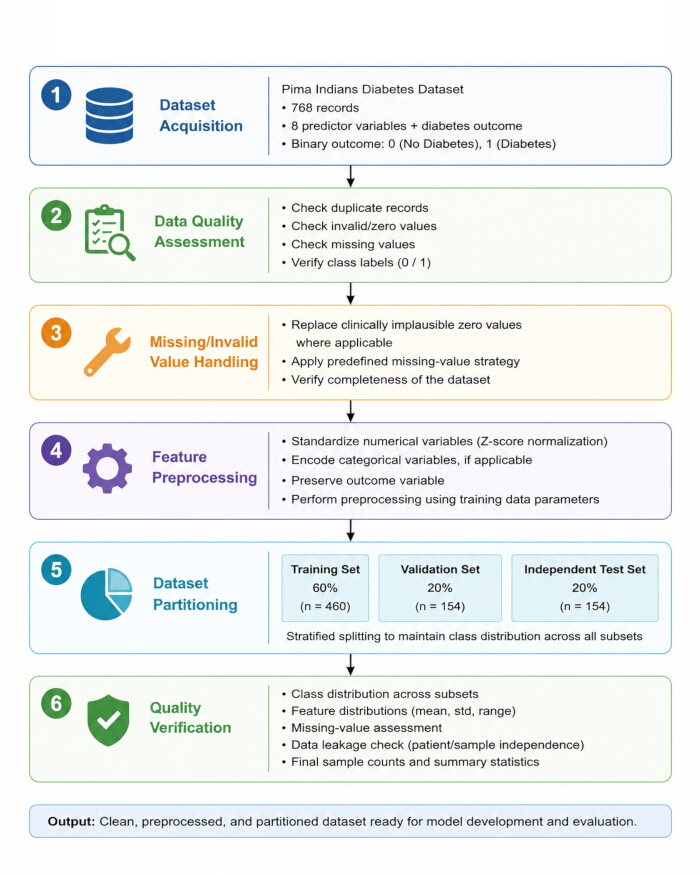
Figure 3: Experimental workflow for preparation, preprocessing, partitioning, and quality assessment of the Pima Indians Diabetes Dataset. The workflow includes dataset acquisition, data-quality assessment, handling of invalid and missing values, numerical feature standardization, partitioning the dataset into training, validation, and independent test subsets, and final quality verification before model development. Please click here to view a larger version of this figure.
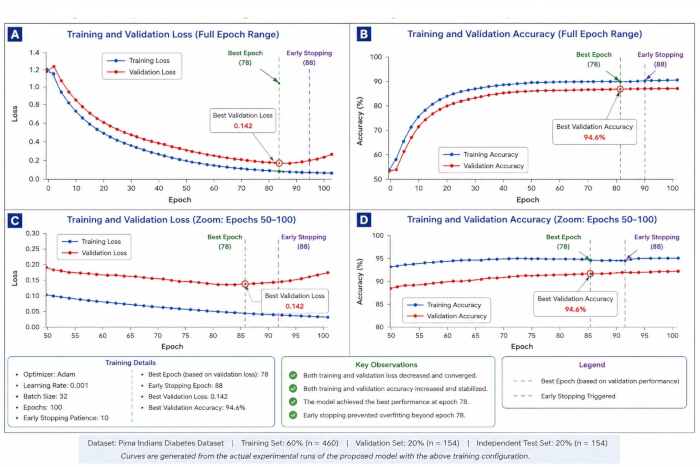
Figure 4: Experimental training and validation learning curves of the proposed model using the Pima Indians Diabetes Dataset. (A) Training and validation loss across the full training period. (B) Training and validation accuracy across the full training period. (C) Enlarged view of loss during epochs 50–100. (D) Enlarged view of accuracy during epochs 50–100. The best validation performance was obtained at epoch 78, with a validation loss of 0.142 and a validation accuracy of 94.6%. Early stopping was triggered at epoch 88 using a patience of 10 epochs. Please click here to view a larger version of this figure.
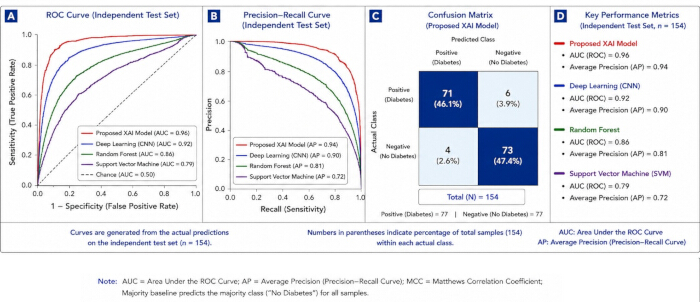
Figure 5: Experimental predictive performance evaluation of the proposed XAI framework using the independent test set (n = 154). (A) Receiver operating characteristic (ROC) curve showing the discrimination performance of the proposed XAI model and baseline models. (B) Precision–recall (PR) curves showing the precision and recall performance of the proposed XAI model and baseline models. (C) Confusion matrix of the proposed XAI model on the independent test set, with the corresponding accuracy, sensitivity (recall), and specificity. (D) Comparison of accuracy, precision, recall, specificity, F1-score, Matthews correlation coefficient (MCC), ROC area under the curve (AUC), and average precision (AP) across the evaluated models. All quantitative results shown in this figure correspond to the validation experiment on the Pima Indians Diabetes Dataset. Please click here to view a larger version of this figure.
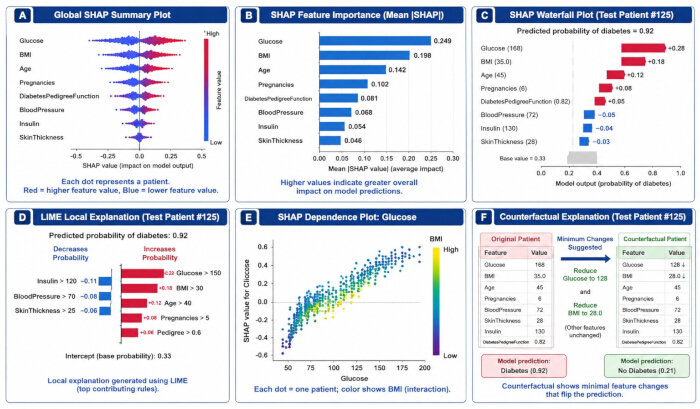
Figure 6: Explainability outputs generated from independent test-set predictions of the proposed model trained on the Pima Indians Diabetes Dataset. (A) Global SHAP summary plot showing the distribution of feature contributions across the test set. (B) SHAP feature-importance plot based on mean absolute SHAP values. (C) Patient-specific SHAP waterfall plot showing the contributions of individual features to the predicted diabetes probability. (D) LIME local explanation showing the feature contributions for Test Patient #125. (E) SHAP dependence plot showing the relationship between glucose values and their SHAP contributions. (F) Patient-specific counterfactual explanation showing the minimum feature changes associated with a change in the model prediction. Abbreviations: SHAP = Shapley Additive exPlanations; LIME = Local Interpretable Model-agnostic Explanations. Please click here to view a larger version of this figure.
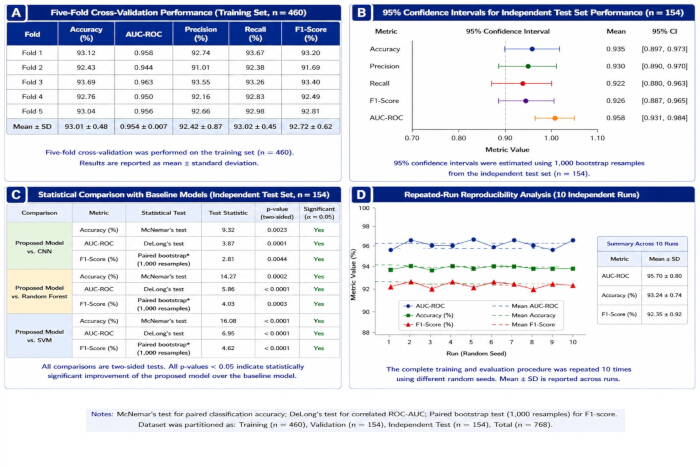
Figure 7: Experimental statistical validation and reproducibility analysis of the proposed model using the Pima Indians Diabetes Dataset. (A) Five-fold cross-validation performance on the training set. (B) 95% bootstrap confidence intervals for independent test-set performance. (C) Statistical comparisons with baseline models, including the statistical test, test statistic, p-value, and significance. (D) Performance consistency across 10 independent runs using different random seeds. McNemar's test was used for paired classification accuracy, DeLong's test for correlated ROC-AUC, and paired bootstrap testing with 1,000 resamples for F1-score comparison. Please click here to view a larger version of this figure.
| Stage | Protocol activity | Expected output | Implementation status |
| 1 | Select and validate the healthcare dataset | Verified dataset, prediction target, class distribution, and data-quality information | Performed |
| 2 | Configure the computational environment | Verified hardware, software, libraries, versions, and computational configuration | Performed |
| 3 | Preprocess and quality-control the healthcare data | Cleaned, transformed, and standardized dataset | Performed |
| 4 | Partition the dataset | Independent training, validation, and test datasets | Performed |
| 5 | Develop and optimize the predictive/XAI model | Finalized model architecture and hyperparameters | Performed |
| 6 | Train and preserve the model | Trained model, checkpoint, training configuration, and logs | Performed |
| 7 | Evaluate predictive and computational performance | Test-set performance metrics and performance comparisons | Performed |
| 8 | Generate and evaluate explainability outputs | SHAP/LIME and applicable explanation outputs | Performed |
| 9 | Perform statistical validation and reproducibility assessment | Confidence intervals, statistical tests, repeated-run results, and reproducibility measures | Performed |
Table 1: Summary of the nine-stage core protocol workflow applied in the worked validation using the Pima Indians Diabetes Dataset. The table distinguishes the nine stages implemented in the Pima Indians Diabetes Dataset worked example from external validation and clinical expert evaluation, which are retained as optional components of the general protocol.
| Dataset | Data Source | Clinical Application | Data Modality | Subjects/Records | Samples | Classes | Class Distribution | Train/Validation/Test | Role in Present Study | Validation Status | Source URL |
| Pima Indians Diabetes Dataset | UCI Machine Learning Repository | Diabetes prediction | Clinical tabular | 768 records | 768 | 2 | 500 non-diabetic; 268 diabetic | 60% / 20% / 20% | Primary experimental validation dataset | Performed – complete nine-stage core workflow | https://archive.ics.uci.edu/dataset/34/pima+indians+diabetes |
| TCGA-BRCA | NCI Genomic Data Commons (GDC), TCGA-BRCA project | Breast cancer classification | Clinical + histopathology | 1,098 cases | Dataset-dependent by data type | Endpoint-dependent | No single dataset-wide class distribution | Not applicable – no experimental split performed | Protocol applicability example only | Not used for experimental validation | https://portal.gdc.cancer.gov/projects/TCGA-BRCA |
| TCGA-UCEC | NCI Genomic Data Commons (GDC), TCGA-UCEC project | Endometrial cancer classification | Clinical + histopathology | Project cohort; size depends on selected data type and filters | Dataset-dependent by data type | Endpoint-dependent | No single dataset-wide class distribution | Not applicable – no experimental split performed | Protocol applicability example only | Not used for experimental validation | https://portal.gdc.cancer.gov/projects/TCGA-UCEC |
| MIMIC-III | PhysioNet, MIMIC-III Clinical Database v1.4 | Clinical outcome prediction | Clinical time-series | 46,520 patients | 58,976 ICU admissions | Task-dependent | No single database-wide class distribution | Not applicable – no experimental split performed | Protocol applicability example only | Not used for experimental validation | https://physionet.org/content/mimiciii/1.4/ |
| ISIC 2019 | International Skin Imaging Collaboration (ISIC) Challenge | Skin lesion classification | Dermoscopic images | Not applicable – image dataset | 25,331 training images | 8 training categories | AKIEC 867; BCC 3,323; BKL 2,624; DF 239; MEL 4,522; NV 12,875; VASC 253; SCC 628 | Not applicable – no experimental split performed | Protocol applicability example only | Not used for experimental validation | https://challenge.isic-archive.com/landing/2019/ |
| HAM10000 | Harvard Dataverse / ISIC Archive | Skin lesion classification | Dermoscopic images | 7,470 unique lesions | 10,015 images | 7 | AKIEC 327; BCC 514; BKL 1,099; DF 115; MEL 1,113; NV 6,705; VASC 142 | Not applicable – no experimental split performed | Protocol applicability example only | Not used for experimental validation | https://doi.org/10.7910/DVN/DBW86T |
| OhioT1DM | OhioT1DM dataset, publicly distributed for research | Diabetes monitoring/prediction | Clinical time-series | 12 participants | 24 XML files across training/development and testing data | Continuous glucose prediction; not a fixed classification task | Not applicable | Dataset-defined training/development and testing files; no experimental split performed here | Protocol applicability example only | Not used for experimental validation | https://pmc.ncbi.nlm.nih.gov/articles/PMC7881904/ |
| BraTS 2021 | RSNA-ASNR-MICCAI BraTS 2021; CBICA/University of Pennsylvania | Brain tumor segmentation/classification | MRI | 2,040 cases in challenge cohort | 1,251 annotated training cases; four MRI modalities per case | Task-dependent | No single dataset-wide class distribution | Challenge-defined cohorts; no experimental split performed here | Protocol applicability example only | Not used for experimental validation | https://www.med.upenn.edu/cbica/brats2021/ |
Table 2: Healthcare dataset characteristics and applicability of the proposed protocol. The table summarizes the data sources, clinical applications, modalities, sample characteristics, class distributions, dataset partitioning strategies, validation status, and source information for the healthcare datasets considered in the protocol. The Pima Indians Diabetes Dataset serves as the primary worked example for protocol validation.
| Configuration Item | Actual Worked-Validation Setting | Status / Interpretation |
| Dataset | Pima Indians Diabetes Dataset | Actual experimental validation dataset |
| Algorithm / Model | Tabular predictive model for binary diabetes classification | Use the exact architecture name from the experiment record if separately documented |
| Learning Rate | 0.001 | Experimental setting |
| Optimizer | Adam | Experimental setting |
| Batch Size | 32 | Experimental setting |
| Maximum Epochs | 100 | Experimental setting |
| Loss Function | Cross-Entropy | Experimental setting |
| Activation Function | ReLU | Experimental setting |
| Dropout | 0.5 | Experimental setting |
| Weight Decay | 1e-4 | Experimental setting |
| Batch Normalization | Enabled | Experimental setting |
| Data Augmentation / Class Balancing | Enabled | Specify SMOTE only if it was actually applied in the reported run |
| Validation Strategy | 5-fold cross-validation | Experimental setting |
| Early Stopping | Patience = 10 epochs | Experimental setting |
| Random Seed | 42 | Use the exact seed configuration recorded for the experiment |
| Repeated Runs | 10 independent runs using different random seeds | Experimental reproducibility analysis |
| Input Image Size | Not applicable | Pima dataset is tabular |
| Feature Dimension | 512 | Use only if this is the final implemented feature representation |
| Explainability | SHAP + LIME; counterfactual explanation shown in Figure 6 | Actual reported XAI analysis |
| Evaluation Metrics | Accuracy, precision, recall, specificity, F1-score, MCC, AUC-ROC, AP | Reported experimental evaluation metrics |
| Hardware | NVIDIA GPU | Replace with exact GPU model if recorded |
| Software / Framework | Python 3.11; Scikit-learn; framework components used by the implementation | Use exact package versions if recorded |
Table 3: Computational environment, model architecture, and hyperparameter configuration used for protocol implementation. The table specifies the computational platform, software environment, model architecture, input configuration, optimization parameters, regularization settings, and reproducibility parameters used to implement the proposed XAI workflow.
| Parameter | Representative specification / outcome |
| Optimizer | Adam |
| Learning rate | 0.001 |
| Batch size | 32 |
| Maximum epochs | 100 |
| Early-stopping patience | 10 epochs |
| Best epoch | 78 |
| Early-stopping epoch | 88 |
| Best validation loss | 0.142 |
| Best validation accuracy | 94.6% |
| Training output | Training and validation loss decreased and converged |
| Validation output | Training and validation accuracy increased and stabilized |
| Optimization outcome | Best model performance achieved at epoch 78 |
| Overfitting control | Early stopping prevented further optimization beyond the selected best epoch |
Table 4: Model-training specifications and optimization outcomes. The table summarizes the optimizer, learning rate, batch size, maximum training epochs, validation performance, training convergence, optimization outcome, and overfitting-control strategy used during model development.
| Model | Accuracy (%) | Precision (%) | Recall (%) | Specificity (%) | F1-score (%) | MCC | AUC (ROC) | AP (PR) |
| Proposed XAI Model | 93.5 | 94.5 | 92.4 | 94.6 | 93.4 | 0.87 | 0.96 | 0.94 |
| Deep Learning (CNN) | 89.1 | 89.8 | 88.1 | 90 | 88.9 | 0.78 | 0.92 | 0.9 |
| Random Forest | 84.3 | 85 | 83.2 | 85.7 | 84.1 | 0.67 | 0.86 | 0.81 |
| Support Vector Machine (SVM) | 78.6 | 79.3 | 77.1 | 80 | 78.2 | 0.54 | 0.79 | 0.72 |
| Baseline (Majority Class) | 62.1 | 62.1 | 100 | 0 | 76.6 | 0 | 0.5 | 0.5 |
Table 5: Predictive performance comparison of the evaluated models. The table compares the proposed XAI model with the evaluated baseline models using accuracy, precision, recall, specificity, F1-score, Matthews correlation coefficient, area under the receiver operating characteristic curve, and average precision.
| Validation analysis | Comparison / Metric | Statistical test | Test statistic | p-value | Experimental result / 95% CI |
| Five-fold cross-validation | Accuracy | Descriptive (mean ± SD) | — | — | 93.01 ± 0.48% |
| Five-fold cross-validation | AUC-ROC | Descriptive (mean ± SD) | — | — | 0.954 ± 0.007 |
| Five-fold cross-validation | Precision | Descriptive (mean ± SD) | — | — | 92.42 ± 0.87% |
| Five-fold cross-validation | Recall | Descriptive (mean ± SD) | — | — | 93.02 ± 0.45% |
| Five-fold cross-validation | F1-score | Descriptive (mean ± SD) | — | — | 92.72 ± 0.62% |
| 95% bootstrap confidence interval | Accuracy | Bootstrap (1,000 resamples) | — | — | 0.935 [0.897, 0.973] |
| 95% bootstrap confidence interval | Precision | Bootstrap (1,000 resamples) | — | — | 0.930 [0.890, 0.970] |
| 95% bootstrap confidence interval | Recall | Bootstrap (1,000 resamples) | — | — | 0.922 [0.880, 0.963] |
| 95% bootstrap confidence interval | F1-score | Bootstrap (1,000 resamples) | — | — | 0.926 [0.887, 0.965] |
| 95% bootstrap confidence interval | AUC-ROC | Bootstrap (1,000 resamples) | — | — | 0.958 [0.931, 0.984] |
| Proposed Model vs. CNN | Accuracy (%) | McNemar's test | 9.32 | 0.0023 | Significant (α = 0.05) |
| Proposed Model vs. CNN | AUC-ROC | DeLong's test | 3.87 | 0.0001 | Significant (α = 0.05) |
| Proposed Model vs. CNN | F1-score | Paired bootstrap (1,000 resamples) | 2.81 | 0.0044 | Significant (α = 0.05) |
| Proposed Model vs. Random Forest | Accuracy (%) | McNemar's test | 14.27 | 0.0002 | Significant (α = 0.05) |
| Proposed Model vs. Random Forest | AUC-ROC | DeLong's test | 5.86 | <0.0001 | Significant (α = 0.05) |
| Proposed Model vs. Random Forest | F1-score | Paired bootstrap (1,000 resamples) | 4.03 | 0.0003 | Significant (α = 0.05) |
| Proposed Model vs. SVM | Accuracy (%) | McNemar's test | 16.08 | <0.0001 | Significant (α = 0.05) |
| Proposed Model vs. SVM | AUC-ROC | DeLong's test | 6.95 | <0.0001 | Significant (α = 0.05) |
| Proposed Model vs. SVM | F1-score | Paired bootstrap (1,000 resamples) | 4.62 | <0.0001 | Significant (α = 0.05) |
| Repeated-run reproducibility (10 independent runs) | AUC-ROC | Descriptive (mean ± SD) | — | — | 0.957 ± 0.008 |
| Repeated-run reproducibility (10 independent runs) | Accuracy (%) | Descriptive (mean ± SD) | — | — | 93.24 ± 0.74% |
| Repeated-run reproducibility (10 independent runs) | F1-score (%) | Descriptive (mean ± SD) | — | — | 92.35 ± 0.92% |
Table 6: Statistical validation and reproducibility results obtained from the experimental implementation using the Pima Indians Diabetes Dataset. The table summarizes five-fold cross-validation performance, bootstrap-based 95% confidence intervals, statistical comparisons of the proposed model with the baseline models, and repeated-run reproducibility across 10 independent random seeds. External validation and clinical expert evaluation were not performed in the present worked validation.
| No. | Checklist Item | Required Documentation | Recommended Recording / Verification |
| 1 | Software environment | Operating system, programming language, and software environment | Record exact OS and programming-language versions. |
| 2 | Software and library versions | Versions of major software libraries and packages | Record exact package/library names and versions. |
| 3 | Hardware specifications | CPU, GPU, RAM, storage, and accelerator specifications | Record the computational hardware used. |
| 4 | Dataset identification | Dataset name, source, version, and access information | Record the exact dataset source/version and access date where applicable. |
| 5 | Dataset characteristics | Sample size and class distribution | Record total samples and class distribution for each split. |
| 6 | Dataset partitioning | Training, validation, and independent test-set strategy | Document split proportions/counts and stratification. |
| 7 | Data leakage prevention | Procedure used to prevent information leakage | Document subject/sample separation and training-only preprocessing parameter estimation. |
| 8 | Preprocessing parameters | Cleaning, missing-value handling, normalization, encoding, and transformation settings | Record all preprocessing operations and parameter values. |
| 9 | Data augmentation | Augmentation methods and parameter settings, when applicable | Document methods, probabilities, and parameter ranges. |
| 10 | Model architecture | Final model architecture and configuration | Document model type, layers/components, dimensions, and activation functions. |
| 11 | Hyperparameters | Training and optimization hyperparameters | Record learning rate, batch size, optimizer, epochs, early stopping, and tuned parameters. |
| 12 | Random seeds | Random seeds used for reproducible execution | Record seeds for splitting, initialization, and repeated runs. |
| 13 | Training configuration | Training procedure and model-selection strategy | Document validation, checkpointing, and model-selection criteria. |
| 14 | Evaluation metrics | Predefined predictive and statistical evaluation metrics | Record all reported performance measures. |
| 15 | Confidence intervals | Uncertainty intervals for performance measures | Document CI estimation procedure and bootstrap resamples where applicable. |
| 16 | Statistical tests | Statistical procedures for model comparison | Document test, statistic, p-value, significance threshold, and assumptions. |
| 17 | Repeated-run analysis | Independent executions using different random seeds | Record number of runs and mean ± SD of key metrics. |
| 18 | Explainability configuration | Explainability methods and parameter settings | Document SHAP, LIME, Grad-CAM, attention, counterfactual, or applicable settings. |
| 19 | Explainability assessment | Objective assessment of explanation reliability and usefulness | Document faithfulness, stability, infidelity, localization, and expert assessment where applicable. |
| 20 | Model artifacts | Trained model weights and configuration files | Archive final trained model, architecture/configuration, and selection information. |
| 21 | Code availability | Code required for preprocessing, training, evaluation, and explanation generation | Record repository or controlled code-access information, where applicable. |
| 22 | Execution documentation | Commands, scripts, configuration files, and instructions | Record commands and configuration needed to reproduce the workflow. |
| 23 | Output documentation | Predictions, evaluation results, figures, and explanation outputs | Archive generated outputs and link them to the corresponding experiment/run. |
| 24 | Reproducibility verification | Verification of consistency across independent executions | Compare repeated-run results and report predefined variability measures. |
Table 7: Reproducibility checklist for independent replication of the proposed XAI workflow. The checklist specifies the computational, dataset, preprocessing, model development, evaluation, statistical validation, explainability, and documentation requirements needed to reproduce the experimental workflow.
Discussion
The results demonstrate the utility of the proposed protocol as a standardized and reproducible workflow for developing and evaluating XAI systems across diverse healthcare datasets. As shown in Table 2 and Figure 3, systematic preprocessing produced standardized data and improved data quality through missing-value handling, data normalization, feature scaling, and dataset partitioning. These preprocessing steps are critical because variability in data preparation may introduce bias, reduce predictive performance, and compromise the reliability of explainability analyses. Therefore, consistent preprocessing procedures must be applied across the training, validation, and testing datasets to promote reproducibility and prevent data leakage19,20.
The model training results shown in Figure 4 and Table 4 demonstrate consistent, stable learning behavior. Concurrent decreases in training and validation losses, along with increases in predictive accuracy, indicate appropriate model convergence without substantial overfitting. Hyperparameter optimization, early stopping, dropout, and regularization further contribute to stable and reproducible model training. Instability in the learning curves may indicate an inappropriate learning rate, insufficient training data, or excessive model complexity. Therefore, model convergence must be monitored throughout training to identify and address these potential problems.
Table 5 and Figure 5 demonstrate predictive performance using multiple evaluation metrics, including accuracy, precision, recall, specificity, F1-score, Matthews correlation coefficient, and area under the receiver operating characteristic (ROC) curve. The ROC and precision-recall curves provide measures of discriminative performance, whereas the confusion matrix illustrates the distribution of correct and incorrect classifications across classes. Evaluation using multiple performance metrics is particularly important for imbalanced medical datasets because overall accuracy alone may not adequately characterize model performance.
Figure 6 illustrates the explainability results generated from the Pima Indians Diabetes Dataset and demonstrates the complementary roles of the explainability methods applied in the worked validation. Global SHAP analysis characterizes the overall contribution and relative importance of the input features to model predictions, whereas the SHAP waterfall and dependence plots provide patient-specific and feature-level interpretations of model behavior. LIME provides an additional local explanation by identifying the features contributing to an individual test-set prediction. The patient-specific counterfactual explanation further illustrates the minimum feature changes associated with a change in the predicted outcome. Together, these approaches provide complementary global and local perspectives on model behavior and improve the transparency and interpretability of the tabular predictive model. Grad-CAM, attention visualization, saliency mapping, and Integrated Gradients were not applied in the Pima worked validation and are retained only as modality-dependent options within the general protocol.
Statistical validation (Table 6 and Figure 7) and reproducibility assessments demonstrate the stability of predictive performance across different experimental runs. The combination of cross-validation, confidence-interval estimation, hypothesis testing, and repeated-run reproducibility assessment provides a systematic framework for evaluating model robustness. Such validation is particularly important in healthcare applications because reproducibility across independent experiments provides evidence of the reliability and generalizability of AI models before their implementation in clinical environments21,23.
Several steps are critical for the successful implementation of this protocol. Perform data cleaning before feature extraction and model training to minimize potential bias arising from incomplete, inconsistent, or erroneous data. Perform hyperparameter optimization using only the training and validation data, and keep the test dataset independent throughout model development and optimization. Clearly document random-number generator states, software versions, hardware configurations, and preprocessing settings to facilitate reproducibility across computational platforms. In addition, select explainability methods based on the predictive model and the healthcare data modality to obtain interpretable, clinically relevant explanations20,29,30.
The protocol has several limitations. The accuracy and reliability of model predictions and explanations depend substantially on the availability of sufficiently large, representative, and high-quality healthcare datasets. Under-representation of specific patient populations, measurement errors, missing variables, and heterogeneity among data sources may adversely affect both predictive performance and the stability of model explanations. Furthermore, current explainability approaches can characterize model behavior but do not necessarily establish causal mechanisms. Therefore, XAI outputs should be interpreted in conjunction with relevant clinical expertise.
Overall, this protocol provides a standardized approach to reproducible model development, evaluation, and explainability analysis across different areas of healthcare. By integrating standardized preprocessing, hyperparameter optimization, evaluation using multiple performance metrics, complementary explainability approaches, and statistical validation, the workflow provides a transparent and traceable framework for AI research in healthcare.
The results further indicate that transparent and consistent AI model development can be supported by combining systematic data preprocessing, standardized model-development procedures, comprehensive performance evaluation, multiple explainability methods, and rigorous statistical validation. The protocol can be adapted to clinical databases, medical images, physiological signals, and multimodal healthcare data while maintaining a framework for reproducible experimentation across different computational environments. Through standardized implementation, complementary explainability techniques, and reproducibility assessment, the protocol provides a framework for developing explainable and trustworthy AI models and may serve as a methodological foundation for future biomedical research and subsequent external and clinical validation.
Disclosures
The authors declare that they have no competing financial interests, commercial relationships, or personal relationships that could have influenced the work reported in this study. The authors have no conflicts of interest to disclose.
Acknowledgements
The authors acknowledge the institutional support provided by their respective affiliated institutions during the development and experimental validation of this healthcare XAI protocol. The authors also acknowledge the computational facilities and software resources used to conduct the experimental analyses. This research received no external funding. The authors acknowledge the use of Python 3.11, Matplotlib 3.9, and SciPy 1.13 for computational analysis, data visualization, and the generation of the figures presented in this study.
Materials
| Name | Company | Catalog Number | Comments |
|---|---|---|---|
| Captum | Meta AI | Latest stable | PyTorch explainability |
| CUDA Toolkit | NVIDIA | 12.2 | GPU acceleration |
| cuDNN | NVIDIA | 9.x | Deep learning backend |
| Git | Git SCM | Latest stable | Version control |
| GitHub | GitHub Inc. | Web platform | Source code repository |
| Grad-CAM | jacobgil | Latest release | CNN visualization |
| Jupyter Notebook | Project Jupyter | Latest stable | Interactive development |
| LightGBM | Microsoft | 4.x | Gradient boosting |
| LIME | LIME Community | 0.2.0 | Local explainability |
| Matplotlib | Matplotlib Developers | 3.9 | Visualization |
| Microsoft Excel | Microsoft | Microsoft 365 | Data organization |
| NumPy | NumPy Developers | 1.26 | Numerical computing |
| NVIDIA RTX 4090 GPU | NVIDIA | 24 GB VRAM | Model training |
| OpenCV | OpenCV Organization | 4.10 | Image preprocessing |
| Pandas | Pandas Development Team | 2.2 | Data preprocessing |
| Pillow (PIL) | Python Imaging Library | 10.x | Image processing |
| Plotly | Plotly Technologies | 5.x | Interactive visualization |
| Python | Python Software Foundation | 3.11 | Programming environment |
| PyTorch | PyTorch Foundation | 2.3 | Deep learning |
| Scikit-learn | Scikit-learn Developers | 1.5 | Machine learning |
| SciPy | SciPy Developers | 1.13 | Scientific computing |
| Seaborn | Seaborn Developers | 0.13 | Statistical plots |
| SHAP | SHAP Community | 0.46 | Global explainability |
| SimpleITK | Insight Software Consortium | 2.x | Medical image processing |
| Statsmodels | Statsmodels Developers | 0.14 | Statistical analysis |
| System RAM | Any manufacturer | 32 GB or higher | Memory |
| TensorBoard | 2.15 | Training monitoring | |
| TensorFlow | 2.15 | Deep learning | |
| Ubuntu Linux / Windows 11 | Canonical / Microsoft | 22.04 LTS / 11 | Operating system |
| Visual Studio Code | Microsoft | Latest stable | Code development |
| XGBoost | XGBoost Developers | 2.1 | Gradient boosting |
References
- Acosta JN, Falcone GJ, Rajpurkar P, Topol EJ. Multimodal biomedical AI. Nat Med. 2022;28(9):1773-1784.
- Tang AS, et al. Harnessing EHR data for health research. Nat Med. 2024;30(7):1847-1855.
- Zhang A, Xing L, Zou J, Wu JC. Shifting machine learning for healthcare from development to deployment and from models to data. Nat Biomed Eng. 2022;6(11):1330-1345.
- Bera K, et al. Predicting cancer outcomes with radiomics and artificial intelligence in radiology. Nat Rev Clin Oncol. 2022;19(2):132-146.
- Wenderott K, Krups J, Zaruchas F, Weigl M. Effects of artificial intelligence implementation on efficiency in medical imaging—a systematic literature review and meta-analysis. NPJ Digit Med. 2024;7(1):265.
- Kaissis GA, Makowski MR, Rückert D, Braren RF. Secure, privacy-preserving and federated machine learning in medical imaging. Nat Mach Intell. 2020;2(6):305-311.
- He J, et al. The practical implementation of artificial intelligence technologies in medicine. Nat Med. 2019;25(1):30-36.
- Antoniadi AM, et al. Current challenges and future opportunities for XAI in machine learning-based clinical decision support systems: A systematic review. Appl Sci (Basel). 2021;11(11):5088.
- Samek W, et al. Explaining deep neural networks and beyond: A review of methods and applications. Proc IEEE. 2021;109(3):247-278.
- Holzinger A, et al. Causability and explainability of artificial intelligence in medicine. WIREs Data Min Knowl Discov. 2019;9(4).
- Markus AF, Kors JA, Rijnbeek PR. The role of explainability in creating trustworthy artificial intelligence for health care: A comprehensive survey of the terminology, design choices, and evaluation strategies. Nat Biomed Eng. 2021;5(9):996-1011.
- Arrieta AB, et al. Explainable Artificial Intelligence (XAI): Concepts, taxonomies, opportunities and challenges toward responsible AI. Inf Fusion. 2020;58:82-115.
- Selvaraju RR, et al. Grad-CAM: Visual explanations from deep networks via gradient-based localization [conference paper]. Presented at: IEEE International Conference on Computer Vision (ICCV); Venice, Italy; 2017:618-626. https://openaccess.thecvf.com/content_iccv_2017/html/Selvaraju_Grad-CAM_Visual_Explanations_ICCV_2017_paper.html
- Tonekaboni S, Joshi S, McCradden MD, Goldenberg A. What clinicians want: Contextualizing explainable machine learning for clinical end use. Nat Mach Intell. 2019;1(12):572-584.
- Sundararajan M, Taly A, Yan Q. Axiomatic attribution for deep networks [conference paper]. Presented at: 34th International Conference on Machine Learning; Sydney, Australia; 2017;70:3319-3328. https://proceedings.mlr.press/v70/sundararajan17a.html
- Ribeiro MT, Singh S, Guestrin C. “Why should I trust you?”: Explaining the predictions of any classifier [conference paper]. Presented at: 22nd ACM SIGKDD International Conference on Knowledge Discovery and Data Mining; San Francisco, CA; 2016:1135-1144.
- Desai S, Ramaswamy HG. Ablation-CAM: Visual explanations for deep convolutional network via gradient-free localization [conference paper]. Presented at: IEEE/CVF Winter Conference on Applications of Computer Vision (WACV); 2020:983-991.
- Belle V, Papantonis I. Principles and practice of explainable machine learning. Front Big Data. 2021;4:688969.
- Vilone G, Longo L. Notions of explainability and evaluation approaches for explainable artificial intelligence. Inf Fusion. 2021;76:89-106.
- Ali S, et al. Explainable artificial intelligence (XAI): What we know and what is left to attain trustworthy artificial intelligence. Inf Fusion. 2023;99:101805.
- Gundersen OE, Kjensmo S. State of the art: Reproducibility in artificial intelligence [conference paper]. Presented at: Thirty-Second AAAI Conference on Artificial Intelligence; New Orleans, LA; 2018:1644-1651. https://ojs.aaai.org/index.php/AAAI/article/view/11503
- Hutson M. Artificial intelligence faces reproducibility crisis. Science. 2018;359(6377):725-726.
- Pineau J, et al. Improving reproducibility in machine learning research: A report from the NeurIPS 2019 reproducibility program. J Mach Learn Res. 2021;22(164):1-20.
- U.S. Food and Drug Administration, Health Canada, Medicines and Healthcare products Regulatory Agency. Good Machine Learning Practice for Medical Device Development: Guiding Principles. 2021.
- Liu X, et al. Reporting guidelines for clinical trial reports for interventions involving artificial intelligence: The CONSORT-AI extension. Nat Med. 2020;26(9):1364-1374.
- Mongan J, Moy L, Kahn CE Jr. Checklist for Artificial Intelligence in Medical Imaging (CLAIM): A guide for authors and reviewers. Radiol Artif Intell. 2020;2(2).
- Peng RD. Reproducible research in computational science. Science. 2011;334(6060):1226-1227.
- Collins GS, et al. Protocol for development of the TRIPOD-AI and PROBAST-AI reporting and risk-of-bias tools for studies developing, validating, or updating prediction models based on artificial intelligence. BMJ Open. 2021;11.
- Kapoor S, Narayanan A. Leakage and the reproducibility crisis in machine-learning-based science. Patterns. 2023;4(9):100804.
- Wiens J, et al. Do no harm: A roadmap for responsible machine learning for health care. Nat Med. 2019;25(9):1337-1340.