Integrated bulk and single-cell transcriptomic analyses identified six heme metabolism-related diagnostic biomarkers for keloids. Experimental validation supported feline leukemia virus subgroup C receptor 1 (FLVCR1) dysregulation in keloid fibroblasts, while molecular docking identified (+)-gallocatechin as a potential FLVCR1-interacting compound warranting further functional investigation.
Research Article
Identification of Heme Metabolism-Related Biomarkers in Keloids Using Transcriptomic Analysis and Cultured Human Fibroblasts
In This Article
Summary
Abstract
Keloid is a fibroproliferative disorder with high recurrence and unclear pathogenesis, lacking effective therapeutic targets. Recent evidence suggests metabolic reprogramming, particularly in heme metabolism, may drive fibrosis. This study investigates the role of heme metabolism, focusing on feline leukemia virus subgroup C receptor 1 (FLVCR1), in keloid pathogenesis and explores its diagnostic and therapeutic potential. We analyzed bulk RNA-seq datasets and single-cell RNA-seq data (scRNA-seq). Differential expression, least absolute shrinkage and selection operator (LASSO), and random forest (RF) models identified heme metabolism-related diagnostic biomarkers. Immune infiltration, single-cell mapping, microRNA (miRNA) network construction, and molecular docking with traditional Chinese medicine compounds were performed. Six heme metabolism-related biomarkers were identified, forming a diagnostic nomogram with high accuracy. FLVCR1, enriched in endothelial cells and melanocytes, correlated negatively with T follicular helper cells, suggesting immunometabolic crosstalk. MiRNA regulatory network analysis revealed five miRNAs co-targeting all six biomarkers. Molecular docking identified (+)-gallocatechin as a high-affinity FLVCR1 ligand. These findings suggest an association between FLVCR1-related heme metabolism and immune alterations in keloid pathogenesis. The biomarker panel showed exploratory diagnostic potential, and (+)-gallocatechin was identified as a candidate FLVCR1-interacting compound requiring further validation. This study reframes keloid within the metabo-fibrotic spectrum and proposes metabolic-immune intervention as a novel therapeutic strategy.
Introduction
Keloid, a fibroproliferative disorder characterized by excessive extracellular matrix deposition extending beyond the boundaries of the original skin injury, affects 4–16% of the global population, with markedly higher prevalence among individuals of African, Asian, and Hispanic descent1,2. Despite its histologically benign nature, keloid imposes substantial physical and psychosocial burdens through persistent pruritus, pain, functional contracture, and cosmetic disfigurement. Current therapeutic modalities, including intralesional corticosteroids, surgical excision, radiotherapy, and laser therapy, remain suboptimal, with recurrence rates exceeding 50% following monotherapy3,4,5. This therapeutic impasse underscores a fundamental gap in our understanding of keloid pathogenesis, particularly the upstream drivers that initiate and sustain the fibrotic cascade beyond canonical profibrotic signaling.
Contemporary research has predominantly focused on canonical pathways such as TGF-β/Smad signaling and aberrant fibroblast activation6,7,8. While immune cell infiltration—particularly M2-polarized macrophages, regulatory T cells, and dysregulated dendritic cells—has been documented in keloid tissues9,10, these investigations largely treat immune alterations as downstream consequences of fibroblast dysfunction rather than upstream orchestrators. Critically, the metabolic programs that may actively shape this immunofibrotic crosstalk remain entirely unexplored in keloid pathogenesis11,12,13. This knowledge gap is striking, given emerging paradigms in fibrotic disorders in which metabolic rewiring serves as a master regulator of tissue remodeling.
Metabolic reprogramming has recently emerged as a central node in fibrogenesis across multiple organ systems. In pulmonary and hepatic fibrosis, dysregulated heme homeostasis—through altered expression of transporters, scavengers, or biosynthetic enzymes—triggers oxidative stress, ferroptosis, and sterile inflammation that directly promote collagen deposition14. Heme accumulation activates the NLRP3 inflammasome to drive fibroblast activation, while feline leukemia virus subgroup C receptor 1 (FLVCR1) deficiency exacerbates tissue fibrosis through unresolved heme toxicity. These findings position heme metabolism not merely as a housekeeping process but as a dynamic signaling hub capable of initiating fibrotic cascades—a paradigm yet to be tested in cutaneous fibroproliferative disorders.
The plausibility of heme-mediated immunomodulation is further supported by mechanistic evidence from cancer and chronic inflammation models. Heme functions as a signaling molecule that directly modulates immune cell fate: it promotes M1-to-M2 macrophage polarization via TLR4/NF-κB signaling15, influences T-cell differentiation through Bach2-mediated transcriptional repression16, and critically regulates dendritic cell maturation via FLVCR1-dependent heme export17,18. Notably, FLVCR1, a plasma membrane heme exporter essential for cellular heme homeostasis, has recently been implicated in immune cell development and endothelial dysfunction19. These convergent lines of evidence position FLVCR1 as a plausible molecular nexus linking heme metabolic dysregulation to pathological immune remodeling—a hypothesis with profound implications for keloid pathogenesis given its characteristic immune-rich microenvironment.
Despite significant advances in understanding heme-immune crosstalk in other disease contexts, it remains entirely unexplored whether dysregulated heme metabolism serves as an upstream driver initiating or amplifying the pathological immune landscape in keloids. This critical knowledge gap warrants urgent investigation for several interconnected reasons: keloids share hallmark pathological features—including persistent inflammation and oxidative stress—with metabolically driven fibrotic disorders such as pulmonary and hepatic fibrosis, suggesting a potential commonality in underlying regulatory mechanisms. The FLVCR1-centered heme export machinery has been mechanistically validated in non-cutaneous tissues to directly govern key immune functions such as macrophage polarization and dendritic cell maturation, providing a solid theoretical foundation for its extrapolation to keloid immunopathology20. Most importantly, targeting this metabolic-immune axis offers a paradigm-shifting opportunity to move beyond current symptomatic therapies that merely suppress downstream fibrotic effects, potentially enabling upstream intervention at the metabolic origin of disease progression21.
Building upon this rationale, we hypothesized that FLVCR1-centered dysregulation of heme metabolism actively remodels the immune microenvironment to drive keloid pathogenesis. To systematically validate this hypothesis, we integrated bulk and single-cell transcriptomic analyses in a multi-tiered approach: we first identified and validated heme metabolism-associated diagnostic biomarkers in keloid tissues using machine learning algorithms and independent cohort verification; we then resolved the spatial expression patterns of these biomarkers across distinct cellular compartments—including endothelial cells, fibroblasts, melanocytes, and immune subsets—through single-cell resolution mapping; subsequently, we delineated their quantitative correlations with specific immune cell populations to establish functional immune-metabolic linkages; and finally, we constructed an FLVCR1-centered microRNA (miRNA) regulatory network and performed molecular docking with traditional Chinese medicine compounds to identify druggable intervention points. This comprehensive investigation not only uncovers a previously unrecognized heme metabolism-immune axis in keloid pathogenesis but also delivers a translationally relevant biomarker panel with dual diagnostic and therapeutic potential for this recalcitrant fibroproliferative disorder.
Protocol
Ethical approval and informed consent were not applicable for this study because all data were obtained from publicly available databases, including the Gene Expression Omnibus (GEO), and no identifiable human participants or animal subjects were directly involved.
Data acquisition and preprocessing
The heme metabolism-associated genes were obtained from the Molecular Signatures Database (MSigDB; see the Table of Materials and Supplemental Table S1), including gene sets from REACTOME_Heme_Biosynthesis, REACTOME_Heme_Degradation, Wikipathway_Heme_Biosynthesis, REACTOME_Scavenging_Heme_from_Plasma, and HALLMARK_Heme_Metabolism. All datasets analyzed in this study were obtained from publicly available sources. Two bulk gene-expression microarray datasets were retrieved from the Gene Expression Omnibus (GEO) database: GSE44270, comprising 18 keloid and 14 normal skin samples, and GSE7890, comprising 10 keloid and 9 normal skin samples. GSE44270 and GSE7890 were generated on the GPL6244 and GPL570 platforms, respectively. The series matrix files and corresponding sample information were downloaded and imported into the R environment. Because the expression values in the series matrix files had already been preprocessed and normalized by the original data submitters, no additional log2 transformation or between-sample normalization was performed. The two datasets were processed independently and were not merged because they were generated on different microarray platforms. The datasets were preprocessed as described below (see the Table of Materials). Gene probes were mapped to their corresponding gene symbols, and probes that either lacked gene annotations or matched multiple genes were excluded. For genes with multiple probe sets, the expression value was assigned based on the highest detected expression level. Additionally, single-cell RNA sequencing data (scRNA-seq) from GSE163973, containing three keloid samples, were downloaded and processed following the quality control standards defined in the original study.
Screening and validation of heme metabolism-related diagnostic markers in keloid
To identify differentially expressed heme metabolism-associated genes in keloid, the Wilcoxon rank-sum test was applied to GSE44270 using the R function wilcox.test, with a significance threshold of P < 0.05. To identify potential diagnostic markers for keloid, two machine-learning models were employed: random forest (RF) and least absolute shrinkage and selection operator (LASSO) logistic regression. Random Forest analysis was performed with a random seed of 1 to ensure reproducibility (see the Table of Materials). The model was constructed using 500 trees (ntree = 500), and gene importance was evaluated based on the mean decrease in node impurity (IncNodePurity). Genes with importance values greater than 0.3 were selected as Random Forest-derived candidate biomarkers. LASSO logistic regression was performed with α = 1, and 50 lambda values were evaluated during model training (see the Table of Materials). The optimal penalty parameter was determined using 5-fold cross-validation with the cv.glmnet function, with a binomial response. Genes with non-zero regression coefficients were retained as LASSO-selected candidates. Finally, the intersection of genes identified by Random Forest and LASSO regression was considered as the final diagnostic gene signature. The final diagnostic gene signature was evaluated using a nomogram-based model. All feature selection and model parameter estimation were performed exclusively in the discovery cohort (GSE44270), and the established six-gene signature was further evaluated in the independent validation cohort (GSE7890). The diagnostic performance of the nomogram was evaluated by calculating the area under the receiver operating characteristic curve (AUC). To examine model stability, the analysis included five-fold cross-validation and 1,000 bootstrap resampling iterations, from which an optimism-corrected AUC was derived. Decision curve analysis (DCA) was then used to estimate the potential net benefit of the nomogram; however, this result was interpreted with caution due to the small sample size.
Immune cell infiltration and correlation analysis
Immune cell enrichment was evaluated by single-sample gene set enrichment analysis (ssGSEA) (see the Table of Materials). The immune cell signature matrix was obtained from a previously published study by Charoentong et al.22. and contained 782 marker genes representing 28 adaptive and innate immune cell populations. The analysis was performed using a Gaussian kernel on the continuous, normalized microarray expression values. A minimum gene-set size of 10 was required after matching the marker genes to the expression matrix, and the resulting ssGSEA scores were normalized. All other settings were retained at their default values. Pearson correlation coefficients were subsequently calculated to assess the relationships between immune cell enrichment scores and diagnostic gene expression. The resulting correlation matrix was visualized as a correlation plot, and selected associations were further displayed as lollipop plots (see the Table of Materials).
Single-cell RNA sequencing data processing and analysis
Single-cell RNA sequencing data were obtained from GSE163973, and only the three keloid samples, KF1, KF2, and KF3, were included in the present analysis. The expression data were imported and processed as described below (see the Table of Materials). Cells with fewer than 200 or more than 6,000 total unique molecular identifier (UMI) counts were excluded, and predicted doublets were removed. Gene-expression counts for each cell were normalized to the total cellular expression, multiplied by a scale factor of 10,000, and log-transformed. Batch-associated variation was regressed out during data scaling, and the resulting scaled residuals were used for downstream analysis. The top 2,000 highly variable genes were selected based on their average expression and dispersion, and principal component analysis was performed on them. The first 15 principal components were used to construct a k-nearest-neighbor graph based on Euclidean distances, which was subsequently converted into a shared nearest-neighbor graph. Cells were clustered with the Louvain algorithm at a resolution of 0.8, and uniform manifold approximation and projection were performed using the same 15 principal components. Cell types were annotated according to the cell-type definitions reported in the original study, and the resulting annotations were recorded in the metadata field. Cell-type annotations and cluster assignments were visualized on the uniform manifold approximation and projection coordinates, and diagnostic gene expression was displayed across the annotated cell populations.
Construction of the miRNA–mRNA regulatory network
The miRNA–mRNA regulatory network was constructed as described below (see the Table of Materials). Homo sapiens was selected as the organism, and gene identifiers were provided as Official Gene Symbols. Candidate genes were submitted to the Gene–miRNA Interactions module, and TarBase v9.0 was selected as the interaction database. TarBase contains experimentally validated miRNA–gene regulatory interactions. Only experimentally supported miRNA–mRNA interactions involving the input candidate genes were retained for network construction, whereas predicted interactions without experimental evidence were excluded. No additional confidence-score threshold was imposed.
Structure-based virtual screening and molecular docking analysis
Virtual screening was performed to prioritize candidate ligands from the compound library against human FLVCR1 (feline leukemia virus subgroup C receptor-related protein 1; see the Table of Materials) using a structure-based virtual screening (SBVS) workflow. The three-dimensional structure of human FLVCR1 was retrieved from the Protein Data Bank (PDB ID: 8UBZ). This structure represents choline-bound human FLVCR1 determined by single-particle cryo-electron microscopy at a global resolution of 3.02 Å (EMDB accession: EMD-42110). The experimentally determined structure was selected because it contains the substrate-bound conformation of FLVCR1 and thus provides structural information to define the physiologically relevant ligand-binding cavity. During receptor preparation, the co-resolved choline (CHT) and cholesterol hemisuccinate (Y01) molecules were retained to preserve the structural environment surrounding the substrate-entry and ligand-binding region. The docking search space was defined around the FLVCR1 substrate/ligand-binding cavity encompassing the co-resolved choline-binding region. The grid box was centered at x = 160.587 Å, y = 160.613 Å, and z = 160.484 Å. The dimensions of the docking box were set to [X × Y × Z Å] to ensure adequate coverage of the substrate-binding cavity and its surrounding residues. Candidate compounds were subsequently docked into this predefined binding region. Docking poses were ranked according to their predicted binding affinities, with more negative docking scores indicating more favorable predicted ligand–FLVCR1 interactions. The top-ranked compounds were selected for subsequent binding-mode and protein–ligand interaction analyses.
Molecular dynamics simulation and MM/GBSA binding free energy calculation
Molecular dynamics (MD) simulation was used to further examine the predicted protein–ligand complex (see the Table of Materials). Ligand topology was prepared by assigning General Amber Force Field (GAFF) parameters and incorporating restrained electrostatic potential (RESP) charges. The complex was then described with the Amber99SB-ILDN force field, placed in a transferable intermolecular potential with 3 points water model, and neutralized with three Na⁺ ions. After steepest-descent energy minimization, the system was equilibrated for 100 ps under the constant number of particles, volume, and temperature ensemble and for another 100 ps under the constant number of particles, pressure, and temperature ensemble, with 100,000 steps in each phase. A 100 ns production run was subsequently carried out at 300 K and 1 bar using a 2 fs time step. The resulting trajectory was analyzed for root mean square deviation (RMSD), root mean square fluctuation (RMSF), radius of gyration (Rg), solvent-accessible surface area (SASA), hydrogen-bond persistence, and molecular mechanics/generalized Born surface area (MM/GBSA) binding free energy.
Cell culture
The NHDF normal human dermal fibroblast cell line and PKF primary keloid fibroblast cell line were cultured in fibroblast growth medium supplemented with 2% fetal calf serum, recombinant human basic fibroblast growth factor (1 ng/mL), and insulin (5 µg/mL). Both cell lines were maintained in a humidified incubator at 37 °C with 5% CO₂ and passaged upon reaching 80–90% confluence.
Western blot analysis
Total protein was isolated from NHDF and PKF cells with a lysis buffer composed of radioimmunoprecipitation assay, phenylmethylsulfonyl fluoride, a protease inhibitor cocktail, and phosphatase inhibitors. Protein concentration was determined with a bicinchoninic acid assay, after which equal amounts of protein were resolved by sodium dodecyl sulfate–polyacrylamide gel electrophoresis and transferred to a polyvinylidene fluoride membrane. The membrane was blocked for 90 min at room temperature with 5% nonfat dry milk prepared in Tween/Tris-buffered saline, then probed overnight at 4 °C with primary antibodies against FLVCR1 (rabbit polyclonal, 1:1,000) and GAPDH (mouse monoclonal, 1:20,000). The following day, incubation with the secondary antibody was performed for 90 min at room temperature. Band intensities were measured with ImageJ, and relative protein levels were normalized to the GAPDH internal control. A minimum of three independent biological replicates was used for every western blot assay.
Real-time fluorescent quantitative reverse-transcription PCR (qRT-PCR) analysis
Total RNA was prepared from NHDF and PKF cells with the referenced kit. cDNA was then generated with the referenced cDNA Synthesis Mix for qPCR (with dsDNase). qRT-PCR was carried out on a real-time PCR system, and FLVCR1 expression was measured with the referenced SYBR Green Fast Mix. GAPDH mRNA served as the internal reference for normalization. Every qRT-PCR reaction was run in technical triplicates, and relative mRNA levels were computed by the 2−ΔΔCt method. Each experiment was performed independently at least three times, and the primer sequences are provided in Supplemental Table S2.
Statistical analysis
Group differences were tested with the Wilcoxon rank-sum test, and values are reported as the mean ± standard deviation (SD). Associations between continuous variables were examined using Pearson’s correlation coefficient. Results with P < 0.05 were considered statistically significant. Significance levels were indicated as ns, P > 0.05; *, P < 0.05; **, P < 0.01; ***, P < 0.001; and ****, P < 0.0001.
Results
Screening for candidate diagnostic biomarkers for keloid using a machine learning algorithm
A total of 283 heme metabolism-related genes were included in this study. Differential expression analysis of the GSE44270 dataset comparing keloid and normal skin tissues identified 25 significantly differentially expressed genes (Figure 1A and Supplemental Table S3). To further screen disease-associated biomarkers, LASSO regression identified 9 candidate genes (Figure 1B,C and Supplemental Table S3), while the random forest (RF) algorithm selected 11 genes with high predictive importance (Figure 1D and Supplemental Table S3). The overlap between the LASSO and RF results was visualized using a Venn diagram, yielding six core biomarkers, namely, FLVCR1, TMCC2, EIF2AK1, XK, HPX, and KEL (Figure 1E and Supplemental Table S3). Receiver operating characteristic (ROC) analysis in the GSE44270 cohort demonstrated favorable diagnostic performance for all six biomarkers, with AUC values of 0.8016 for FLVCR1, 0.7063 for TMCC2, 0.7817 for EIF2AK1, 0.7460 for XK, 0.7500 for HPX, and 0.7857 for KEL (Figure 1F). Based on these six biomarkers, a diagnostic nomogram for keloid was subsequently constructed using the rms package in R (Figure 1G).
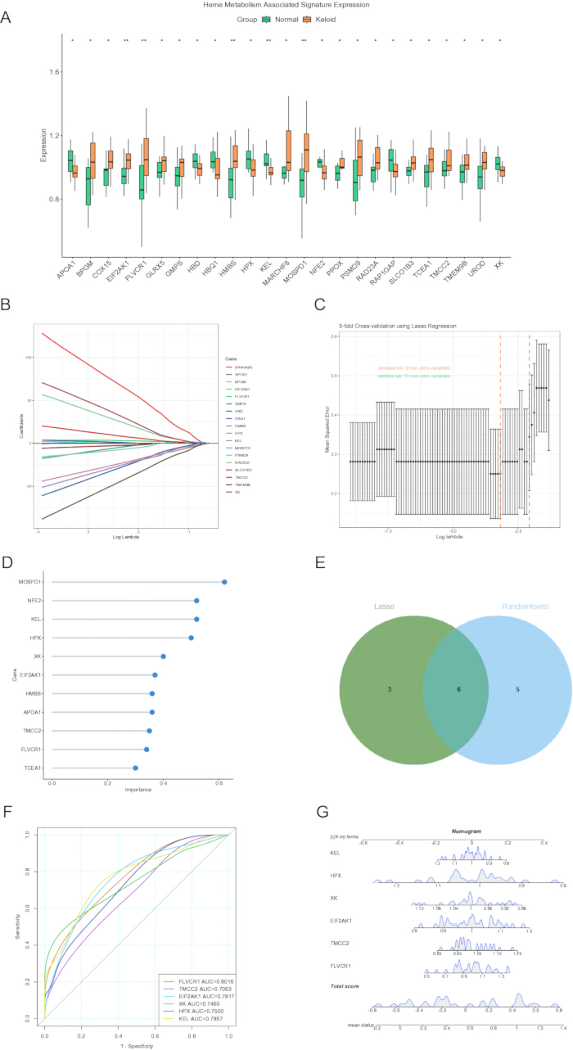
Figure 1: Identification of candidate heme metabolism-related genes associated with keloid using machine-learning algorithms. (A) Box plot illustrating the differential expression of heme metabolism-related genes between keloid and normal tissues. (B,C) LASSO logistic regression analysis for screening candidate diagnostic markers. (D) Candidate biomarkers selected by the RF algorithm. (E) Venn diagram showing the overlapping genes identified by the two machine-learning algorithms. (F) ROC curve analysis evaluating the diagnostic performance of the candidate biomarkers. (G) Nomogram for keloid prediction based on the six-gene signature. Abbreviations: LASSO, least absolute shrinkage and selection operator; RF, random forest; ROC, receiver operating characteristic. Statistical significance: ns, P > 0.05; *, P < 0.05; **, P < 0.01; ***, P < 0.001; and ****, P < 0.0001. Please click here to view a larger version of this figure.
The predictive performance of the diagnostic nomogram was assessed in both the training cohort (GSE44270) and the validation cohort (GSE7890). The model demonstrated excellent diagnostic accuracy, achieving AUC values of 0.984 (95% CI: 0.950–1.000) and 0.922 (95% CI: 0.806–1.000), respectively (Figure 2A,D). To further evaluate the robustness and potential overfitting of the six-gene diagnostic signature, additional internal validation analyses were performed in the discovery cohort (GSE44270). Fivefold cross-validation demonstrated consistent discriminative performance across subsets, with a mean AUC of 0.925, indicating that the model maintained stable classification performance despite variations in the training samples. Furthermore, bootstrap validation with 1,000 resampling iterations yielded a mean AUC of 0.930 (95% CI: 0.794–1.000). After adjustment for potential optimism caused by the limited sample size, the optimism-corrected AUC remained 0.930, suggesting that the diagnostic performance of the six-gene signature was relatively stable after internal validation. Furthermore, decision curve analysis (DCA) suggested that the nomogram exhibited a higher potential net benefit than alternative diagnostic strategies across a range of threshold probabilities, although these findings should be interpreted with caution given the limited sample size (Figure 2B,E). Additionally, keloid samples exhibited significantly higher risk scores than healthy controls in both the training and validation cohorts (Figure 2C,F), further demonstrating the diagnostic model's stability and reliability.
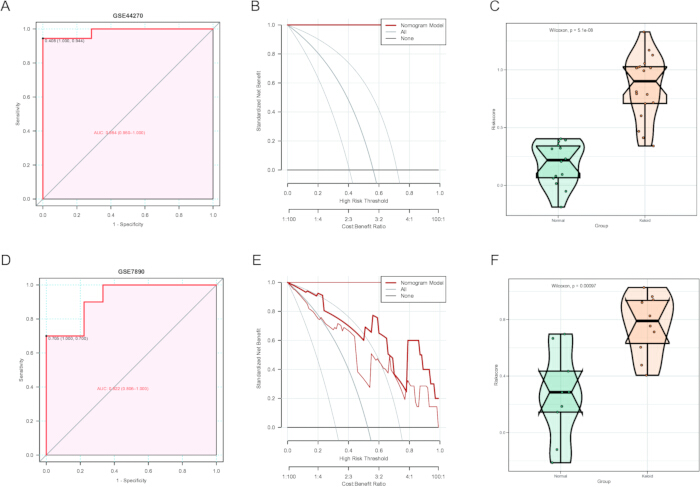
Figure 2: Validation of the nomogram for keloid prediction. (A) ROC curve evaluating the predictive performance of the nomogram in the GSE44270 dataset. (B) DCA evaluating the clinical utility of the nomogram in GSE44270. (C) Risk score distribution comparing keloid and healthy samples in GSE44270. (D) ROC curve evaluating the predictive performance of the nomogram in the independent GSE7890 dataset. (E) DCA evaluating the clinical utility of the nomogram in GSE7890. (F) Risk score distribution comparing keloid and healthy samples in GSE7890. Abbreviations: ROC = receiver operating characteristic; DCA = decision curve analysis. Please click here to view a larger version of this figure.
Diagnostic biomarkers are associated with the immune characteristics of keloid
To explore the relationship between the six diagnostic biomarkers and the immune microenvironment, correlation analysis was performed to assess the associations between biomarker expression and immune cell infiltration. The results revealed that all six biomarkers were significantly associated with multiple infiltrating immune cell populations (Figure 3A). Specifically, FLVCR1 expression was negatively associated with T follicular helper cells (Figure 3B). TMCC2 showed positive correlations with natural killer cells and activated dendritic cells, whereas it was negatively correlated with immature dendritic cells and immature B cells (Figure 3C–F). In addition, EIF2AK1 expression was negatively associated with CD56dim natural killer cells (Figure 3G), whereas XK was negatively associated with eosinophils (Figure 3H).
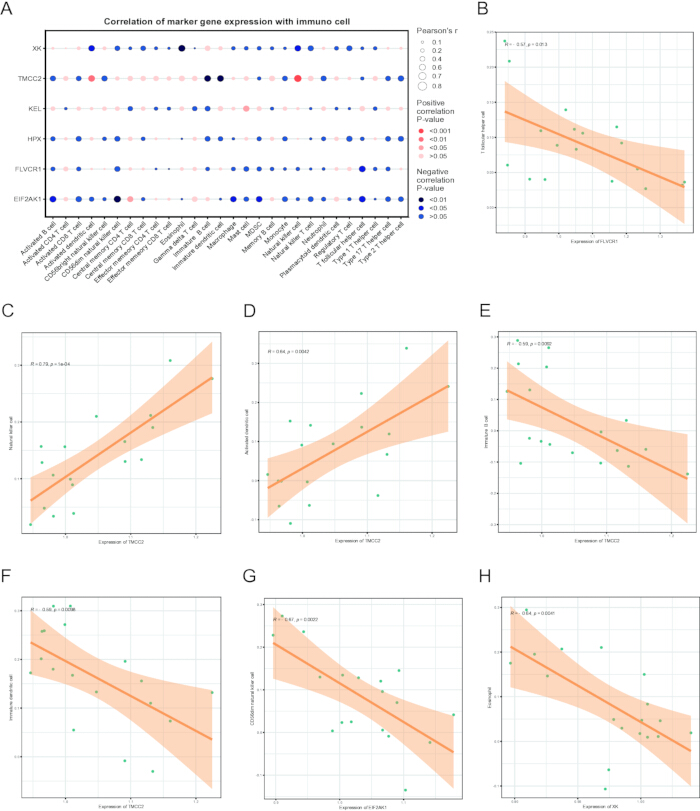
Figure 3: Correlation between candidate heme metabolism-related genes and immune cell infiltration. (A) Heatmap showing correlations between candidate genes and immune cell populations. Red indicates positive correlations, whereas blue indicates negative correlations. (B). Correlation between FLVCR1 expression and T follicular helper cells. (C-F) Correlations between TMCC2 expression and natural killer cells, activated dendritic cells, immature dendritic cells, and immature B cells, respectively. (G) Correlation between EIF2AK1 expression and CD56dim natural killer cells. (H). Correlation between XK expression and eosinophils. Abbreviations: FLVCR1 = feline leukemia virus subgroup C receptor 1; TMCC2 = transmembrane and coiled-coil domains 2; EIF2AK1 = eukaryotic translation initiation factor 2 alpha kinase 1; CD56dim = cluster of differentiation 56 dim. Please click here to view a larger version of this figure.
Single-cell transcriptome data analysis
To characterize the expression patterns of the identified diagnostic biomarkers within the keloid microenvironment, we analyzed the single-cell RNA sequencing dataset GSE163973. After quality control and data integration, 21,488 high-quality cells were retained for downstream analyses. Cells with fewer than 200 or more than 6,000 total unique molecular identifier (UMI) counts were excluded, and potential doublets were identified and removed using the DoubletDetection package. The 2,000 genes exhibiting the greatest expression variability were selected, followed by dimensionality reduction and visualization with Uniform Manifold Approximation and Projection (UMAP). A total of 10 major cell populations were identified, including endothelial cells, fibroblasts, muscle fibers, keratinocytes, immune cells, lymphatic endothelial cells, glandular cells, neural cells, melanocytes, and an unclassified cell population (Figure 4A,B). Expression profiling revealed distinct cell-type-specific distribution patterns of the diagnostic biomarkers. FLVCR1 was predominantly expressed in endothelial cells and melanocytes, whereas EIF2AK1 showed relatively high expression in neural cells, glandular cells, and fibroblasts. HPX was primarily enriched in melanocytes, while KEL exhibited predominant expression in glandular cells (Figure 4C,D).
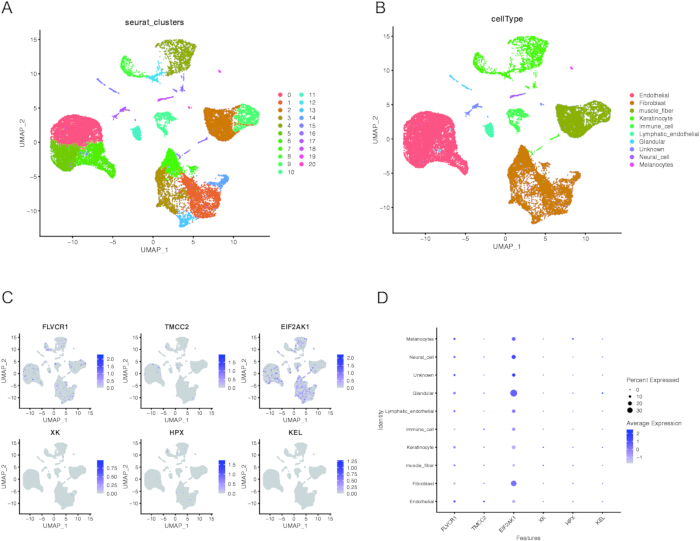
Figure 4: Distribution of heme metabolism-related diagnostic biomarkers in the keloid single-cell transcriptome. (A) UMAP plot showing 21 cell clusters comprising 21,488 cells from keloid samples. (B) Cell-type annotations based on the annotations reported in the original study. (C) Feature plots showing the expression of heme metabolism-related diagnostic biomarkers across different cell types. (D) Bubble plot showing the average expression levels and percentages of cells expressing the heme metabolism-related diagnostic biomarkers across different cell types. Abbreviation: UMAP = uniform manifold approximation and projection. Please click here to view a larger version of this figure.
Identification and interaction network analysis of candidate diagnostic biomarkers
To explore the regulatory mechanisms underlying the candidate diagnostic biomarkers, a miRNA–mRNA regulatory network was constructed. To improve the reliability of the predicted interactions, overlapping miRNAs targeting the candidate biomarkers were identified. A total of 282 miRNAs interacting with the six diagnostic biomarkers were obtained, and the resulting regulatory network is shown in Figure 5. Notably, hsa-miR-34a-5p, hsa-let-7a-5p, hsa-let-7d-5p, hsa-let-7e-5p, and hsa-miR-26b-5p were predicted to simultaneously regulate all six candidate biomarkers.
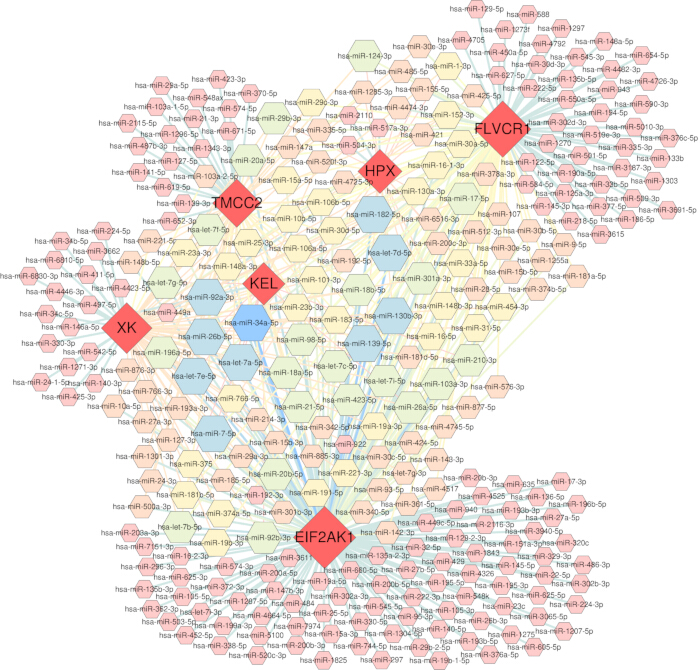
Figure 5: miRNA regulatory network of heme metabolism-related diagnostic biomarkers. The network illustrates the regulatory relationships between the six diagnostic biomarker genes (FLVCR1, HPX, TMCC2, KEL, XK, and EIF2AK1) and their associated miRNAs. Gene nodes represent the diagnostic biomarkers, whereas the surrounding nodes represent miRNAs. Edges indicate experimentally supported miRNA–mRNA interactions. Abbreviations: FLVCR1 = feline leukemia virus subgroup C receptor 1; HPX = hemopexin; TMCC2 = transmembrane and coiled-coil domains 2; KEL = Kell metallo-endopeptidase; XK = X-linked Kx blood group; EIF2AK1 = eukaryotic translation initiation factor 2 alpha kinase 1; miRNA = microRNA; mRNA = messenger RNA. Please click here to view a larger version of this figure.
Experimental validation of FLVCR1 expression and molecular docking analysis of potential therapeutic compounds
To validate the bioinformatic findings and confirm the functional relevance of the identified hub gene, we experimentally assessed FLVCR1 expression in PKF and NHDF. Both qRT-PCR and western blot analyses consistently demonstrated that FLVCR1 was significantly upregulated in keloid fibroblasts compared to normal controls (Figure 6A–C, Supplemental Figure S1, and Supplemental Table S4). This elevated cellular expression supports the potential involvement of FLVCR1-associated heme metabolic dysregulation in keloid pathogenesis.
Given the potential involvement of FLVCR1 in heme metabolism-associated immune changes, we next sought to identify potential therapeutic compounds that could directly target FLVCR1 to interrupt this pathogenic axis. High-throughput virtual screening was performed using a traditional Chinese medicine (TCM) compound library and the prepared protein structure. The 20 compounds with the most favorable docking scores were selected for further evaluation (Supplemental Table S5). In general, a lower binding energy indicates a stronger binding affinity and docking energies below −5 kcal/mol are considered indicative of stable ligand–protein interactions. Among the screened compounds, (+)-Gallocatechin, (−)-Epicatechin, (−)-Gallocatechin, and Cyanidin (chloride) exhibited favorable binding affinities toward FLVCR1. Notably, (+)-Gallocatechin showed the strongest interaction with FLVCR1 by forming four hydrogen bonds with GLU214, ASN245, GLN246, and GLN471, suggesting a stable ligand–protein binding mode (Figure 6D–G). These findings highlight (+)-gallocatechin as a promising candidate for mechanism-based therapeutic intervention targeting FLVCR1.
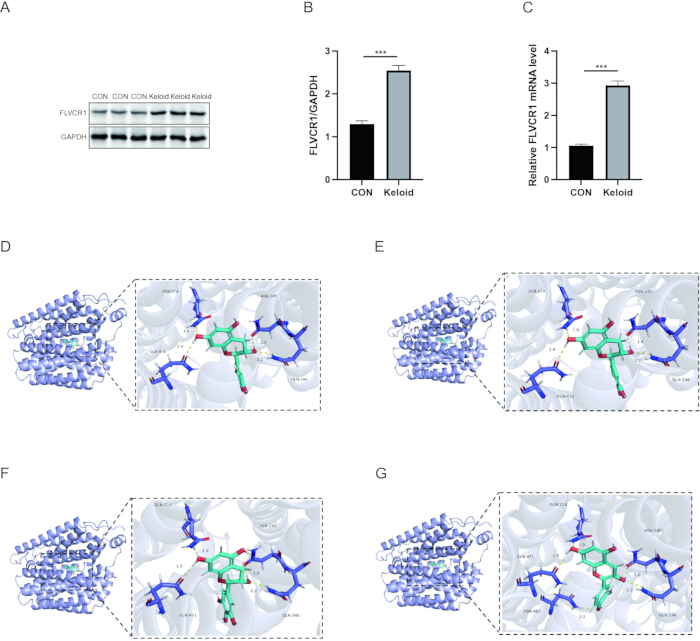
Figure 6: Experimental validation of FLVCR1 expression and molecular docking of potential compounds targeting FLVCR1. (A) Representative western blot images showing FLVCR1 protein expression in CON and keloid. GAPDH served as the loading control. (B) Quantification of FLVCR1 protein levels normalized to GAPDH. (C) Relative mRNA expression levels of FLVCR1 in CON and keloid fibroblasts were determined by qRT-PCR. GAPDH was used as an internal reference. (D–G) Three-dimensional representations of the predicted binding modes between FLVCR1 and selected small-molecule compounds: (D) (+)-Gallocatechin. (E) (-)-Epicatechin. (F) (-)-Gallocatechin. (G) Cyanidin (Chloride). Abbreviations: FLVCR1 = feline leukemia virus subgroup C receptor 1; CON, control; GAPDH, glyceraldehyde-3-phosphate dehydrogenase; qRT-PCR, quantitative reverse transcription polymerase chain reaction; SD, standard deviation. Data are presented as the mean ± SD. Statistical significance: ns, P > 0.05; *, P < 0.05; **, P < 0.01; ***, P < 0.001; and ****, P < 0.0001. Please click here to view a larger version of this figure.
Confirmation of the stability of the FLVCR1–(+)-Gallocatechin complex with molecular dynamics simulation
To examine the reliability of the predicted ligand–protein binding mode, molecular dynamics (MD) simulation was carried out for the FLVCR1–(+)-gallocatechin complex. The analysis focused on whether the complex remained structurally stable over time and whether ligand binding altered the protein’s conformational behavior using RMSD, RMSF, radius of gyration (Rg), SASA, hydrogen bond analysis, and MM/GBSA calculations. RMSD analysis (Figure 7A) showed that both the apo protein and ligand-bound complex underwent initial fluctuations within the first 20 ns, followed by gradual stabilization, indicating that the systems reached equilibrium during the simulation. After equilibration, the RMSD value of the FLVCR1–(+)-Gallocatechin complex remained below 0.2 nm, suggesting that ligand binding contributed to maintaining the structural stability of FLVCR1. RMSF analysis (Figure 7B) demonstrated that most residues exhibited limited fluctuations throughout the simulation, indicating the preservation of overall protein integrity, while several flexible regions may represent loop regions involved in ligand accommodation. Furthermore, stable Rg and SASA profiles (Figure 7C,D) indicated that the complex maintained a compact conformation, with no obvious structural expansion or changes in solvent exposure. Hydrogen bond analysis (Figure 7E) revealed that the FLVCR1–(+)-Gallocatechin complex maintained persistent intermolecular interactions, with approximately 3–4 hydrogen bonds formed during the simulation, supporting the stability of the ligand–protein association. MM/GBSA analysis further showed that the FLVCR1–(+)-Gallocatechin complex exhibited a favorable binding free energy (ΔGtotal = −34.87 ± 4.13 kcal/mol) (Supplemental Table S6). Energy decomposition analysis indicated that van der Waals interactions (ΔVDWAALS = −46.34 ± 2.16 kcal/mol) and electrostatic interactions (ΔEelec = −14.09 ± 3.45 kcal/mol) were the major favorable contributors to binding, despite the unfavorable contribution from polar solvation energy (ΔGsolvation = 25.55 ± 0.74 kcal/mol) (Supplemental Table S6). Collectively, these MD simulation results demonstrated that (+)-Gallocatechin formed a stable complex with FLVCR1 and further supported the reliability of the docking-predicted binding mode.
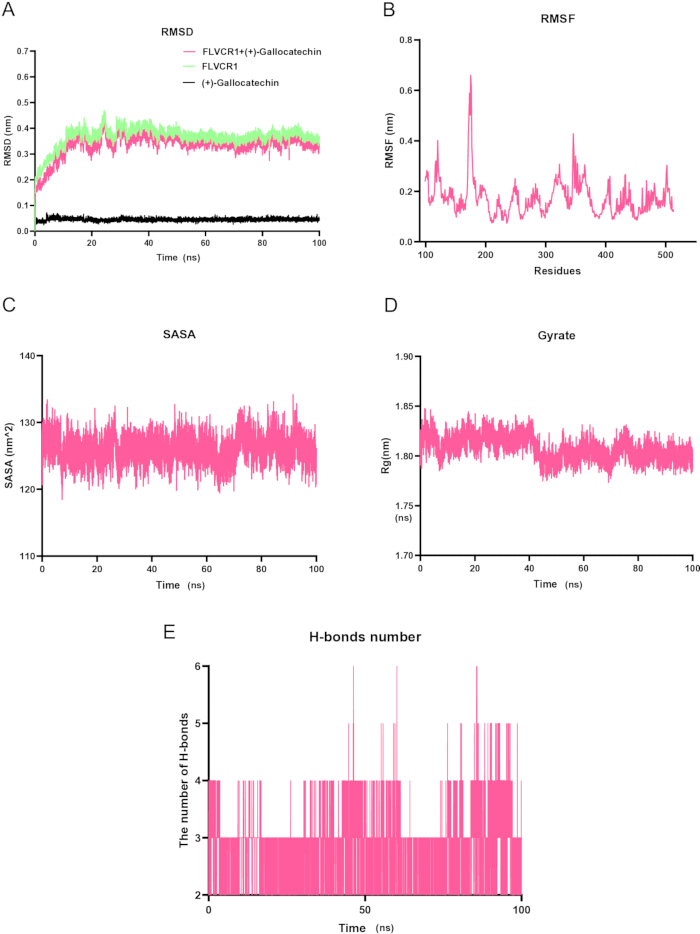
Figure 7: Molecular dynamics simulation analysis of the FLVCR1–(+)-Gallocatechin complex. (A) RMSD profiles of apo FLVCR1 and the FLVCR1–(+)-Gallocatechin complex during the 100 ns molecular dynamics simulation. (B) RMSF profile showing residue-level fluctuations of FLVCR1 during the simulation. (C) SASA profile showing changes in the solvent-accessible surface area of the FLVCR1–(+)-Gallocatechin complex. (D) Rg profile evaluating the compactness of the FLVCR1–(+)-Gallocatechin complex during the simulation. (E) Hydrogen-bond analysis showing dynamic intermolecular interactions between FLVCR1 and (+)-Gallocatechin throughout the simulation. Abbreviations: FLVCR1 = feline leukemia virus subgroup C receptor 1; RMSD = root mean square deviation; RMSF = root mean square fluctuation; SASA = solvent-accessible surface area; Rg = radius of gyration. Please click here to view a larger version of this figure.
Data Availability:
The publicly available transcriptomic datasets analyzed in this study can be accessed through the Gene Expression Omnibus (GEO) under accession numbers GSE44270, GSE7890, and GSE163973. The source data generated in this study and underlying the experimental validation, including qRT-PCR measurements, original western blot images, and western blot quantification data, are provided as Supplementary Figure S1, Supplementary Table S1, Supplementary Table S2, Supplementary Table S3, and Supplementary Table S4. The molecular docking results and MM/GBSA binding free energy data are also provided in Supplementary Table S5 and Supplementary Table S6.
Supplemental Figure S1: Original data of western blotting.Please click here to download this file.
Supplemental Table S1: Heme metabolism-related genes.Please click here to download this file.
Supplemental Table S2: Primer sequences of selected genes. Please click here to download this file.
Supplemental Table S3: Machine-learning approaches for identifying potential diagnostic biomarkers in keloid. Please click here to download this file.
Supplemental Table S4: Raw data supporting the experimental validation of FLVCR1 expression. Please click here to download this file.
Supplemental Table S5: Top 20 candidate compounds identified by molecular docking with FLVCR1.Please click here to download this file.
Supplemental Table S6: MM/GBSA binding free-energy analysis of the FLVCR1–(+)-Gallocatechin complex.Please click here to download this file.
Discussion
This study identifies a potential association between dysregulated heme metabolism, FLVCR1 expression, and immune microenvironment changes in keloid formation. By integrating bulk and single-cell transcriptomics, we established FLVCR1 as a molecular nexus linking heme export deficiency to pathological immune reprogramming, positioning keloid within the emerging spectrum of "metabo-fibrotic" disorders23,24,25. The potential importance of FLVCR1 is supported by convergent evidence across multiple analytical tiers. Bulk transcriptomics revealed its significant upregulation in keloid tissues with robust diagnostic capacity, while single-cell resolution mapping localized its expression predominantly to endothelial cells and melanocytes—two cell types critically implicated in keloid pathogenesis through aberrant angiogenesis and hyperpigmentation, respectively26,27. Most compellingly, FLVCR1 expression exhibited a strong negative correlation with T follicular helper (Tfh) cells, a lymphocyte subset increasingly recognized for promoting Th2-skewed immunity and collagen deposition in fibrotic microenvironments28. Previous studies have demonstrated that FLVCR1-mediated heme export is involved in dendritic cell maturation and antigen presentation29, suggesting a potential link between FLVCR1-associated heme homeostasis and immune regulation. The observed upregulation of FLVCR1 and its negative correlation with Tfh cell infiltration may therefore reflect alterations in immune homeostasis, potentially involving Tfh-associated profibrotic cytokines such as IL-4 and IL-1329,30,31.
Furthermore, intracellular heme accumulation resulting from FLVCR1 dysfunction likely activates the NLRP3 inflammasome—a mechanism well-documented in hepatic fibrosis, where heme serves as a damage-associated molecular pattern (DAMP) triggering sterile inflammation32,33,34. Such inflammasome activation would promote IL-1β/IL-18 release, driving M2 macrophage polarization via TLR4/NF-κB signaling and creating a self-sustaining loop of oxidative stress and fibroblast activation35,36. Collectively, these data support FLVCR1 as a candidate biomarker and possible contributor to heme metabolism–immune interactions in keloid; however, the proposed mechanistic cascade requires direct functional validation. Intracellular heme retention first induces oxidative damage and activates the inflammasome, which subsequently leads to dendritic cell dysfunction, thereby promoting skewing toward follicular helper T cells and Th2-type immune responses; this immune deviation further drives macrophage polarization toward the M2 phenotype, ultimately resulting in fibroblast activation and the progression of fibrogenesis.
Beyond FLVCR1 acting alone, the synergistic dysregulation of all six biomarkers reveals a coordinated collapse of heme homeostasis across multiple regulatory nodes. TMCC2, positively correlated with activated dendritic cells yet negatively associated with immature subsets, may represent a compensatory mechanism attempting to restore immune competence amid heme stress37,38. EIF2AK1, highly expressed in keloid fibroblasts and glandular cells, serves as a direct molecular sensor of heme excess that phosphorylates eIF2α to globally suppress protein synthesis while selectively upregulating stress-response genes39,40,41. This positions EIF2AK1 as the critical bridge translating heme accumulation into fibroblast phenotypic switching—potentially explaining why keloid fibroblasts exhibit heightened resistance to apoptosis and exaggerated collagen production42,43,44. HPX, the primary plasma heme scavenger, showed restricted expression in melanocytes, suggesting a cell-autonomous attempt to buffer heme toxicity within pigment-rich compartments45,46,47. The concurrent dysregulation of XK and KEL further implicates erythroid-lineage heme handling machinery in keloid pathogenesis—a finding with intriguing implications for understanding why keloids frequently arise at sites of trauma with microhemorrhage. Rather than viewing these six genes as independent markers, we interpret their collective dysregulation as evidence of a system-wide failure in heme compartmentalization, in which impaired export (FLVCR1), sensing (EIF2AK1), scavenging (HPX), and membrane trafficking (XK, KEL) converge to create a pro-fibrotic, heme-rich microenvironment.
This metabolic-immune model is further reinforced by a compelling epigenetic layer: we identified a ceRNA network wherein the downregulation of specific miRNAs (e.g., the let-7 family and miR-34a-5p) may simultaneously derepress heme metabolism-related and fibrotic pathways, although this regulatory model requires further validation23. The spatial resolution afforded by single-cell analysis illuminates the cellular choreography underlying this process, demonstrating how metabolic dysfunction in structural cells actively seeds the immune-rich microenvironment through paracrine heme signaling, thereby transforming our understanding from a "bulk tissue" perspective to a dynamic cellular ecosystem model48,49,50. Endothelial heme accumulation could promote vascular leakage and leukocyte extravasation via heme oxygenase-1 induction and adhesion molecule upregulation, thereby seeding the immune-rich microenvironment observed in keloid51,52,53. Concurrently, FLVCR1 expression in melanocytes aligns with clinical observations of keloid hyperpigmentation and suggests metabolic vulnerabilities shared between pigmentary and fibrotic pathways—possibly mediated by oxidative stress responses54,55. This spatial mapping transforms our understanding from a "bulk tissue" perspective to a cellular ecosystem model wherein metabolic dysfunction in structural cells (endothelium, melanocytes) actively shapes immune cell behavior through paracrine heme signaling.
From a translational standpoint, our nomogram integrating all six biomarkers achieved near-perfect diagnostic accuracy, substantially outperforming any single marker and demonstrating clear clinical net benefit via decision curve analysis. More provocatively, molecular docking identified (+)-gallocatechin—a bioactive polyphenol abundant in green tea and traditional Chinese medicinal herbs—as a high-affinity FLVCR1 ligand forming stable hydrogen bonds with GLU-214, ASN-245, GLN-246, and GLN-471. This finding is particularly compelling given prior evidence that catechins suppress collagen synthesis, inhibit transforming growth factor-beta 1 secretion, and attenuate oxidative stress in keloid fibroblasts56,57,58. We hypothesize that (+)-gallocatechin may stabilize FLVCR1 conformation to enhance heme export capacity, thereby interrupting the metabolic trigger of fibrosis at its source—a strategy fundamentally distinct from current therapies that merely suppress downstream collagen production. Whether this type of metabolic intervention could affect keloid recurrence requires further experimental and clinical validation.
Of course, this study also has limitations. First, our analyses remain largely computational, and the observed association between FLVCR1 expression and T follicular helper (Tfh) cell infiltration does not establish a direct causal relationship. Flow cytometric validation of Tfh cells and functional studies involving FLVCR1 knockdown or overexpression in keloid fibroblasts, together with fibroblast–immune cell interaction or conditioned-media assays, are needed to clarify the potential role of FLVCR1 in immune regulation. Second, the relatively small sample size may introduce uncertainty and optimism in the estimated performance of the six-gene signature. Although internal validation was performed, reliable assessment of diagnostic performance and calibration remains limited. Therefore, the six-gene panel should be considered an exploratory molecular signature requiring further validation in larger, independent cohorts. Third, the single-cell dataset requires expansion to better capture inter-patient heterogeneity and rare cell populations. Fourth, protein-level validation of biomarker expression and spatial localization via immunohistochemistry would strengthen the clinical relevance of our findings. Finally, while molecular docking suggests potential binding between (+)-gallocatechin and FLVCR1, in vitro binding assays, and in vivo efficacy studies are needed before clinical translation. Despite these limitations, our findings provide a multidimensional framework linking FLVCR1-associated heme metabolism with immune alterations in keloid and identify potential molecular biomarkers and therapeutic candidates for further investigation.
Disclosures
The authors have no conflicts of interest to declare.
Authors’ contributions
Qiuyan Yang contributed to the design of the study. Jianping Zhang contributed to the data collection. Qiuyan Yang and Xiaofang Sun contributed to the statistical analysis. Qiuyan Yang and Jing Wang contributed to making diagrams and finishing the manuscript. All authors read and approved the final version of the manuscript.
Acknowledgements
We gratefully acknowledge the researchers who generated and publicly shared the GSE44270, GSE7890, and GSE163973 datasets through the Gene Expression Omnibus (GEO) database.
Materials
| Name | Company | Catalog Number | Comments |
|---|---|---|---|
| AmberTools | Amber Project | https://ambermd.org/AmberTools.php | Version 22; Generation of ligand parameters using the GAFF force field |
| Anti-FLVCR1 | Proteintech | 26841-1-AP | |
| Anti-GAPDH | Proteintech | 60004-1-Ig | |
| AutoDock Vina | The Scripps Research Institute | https://vina.scripps.edu/ | Version 1.2.3; Molecular docking and prediction of ligand-binding affinity |
| AutoDockTools | The Scripps Research Institute | https://ccsb.scripps.edu/autodocksuite/adt/ | Version 1.5.6; Ligand and receptor preparation for molecular docking |
| BCA protein assay kit | Servicebio | G2026 | |
| cDNA synthesis mix for qPCR with dsDNase | UnionScript | Reverse transcription for qRT-PCR | |
| ChemBio3D | PerkinElmer | https://revvitysignals.com/products/research/chemdraw | Version 14.0; 3D conformational optimization and energy minimization of ligands |
| Chemiluminescence imaging system | Visualization of western blot bands | ||
| DoubletDetection package | GitHub / JonathanShor | https://github.com/JonathanShor/DoubletDetection | Detection and removal of predicted doublets in scRNA-seq analysis |
| ECL chemiluminescent substrate | Western blot signal detection | ||
| Fetal calf serum | 2% final concentration; Supplement for fibroblast culture medium | ||
| Fibroblast Growth Medium 2 | PromoCell | C-23020 | |
| FLVCR1 and GAPDH primers | Supplemental Table S2 | qRT-PCR amplification of target and reference genes | |
| Gaussian | Gaussian, Inc. | https://gaussian.com/ | Gaussian 16W; Calculation of RESP atomic charges for ligand parameterization |
| Gel electrophoresis apparatus | SDS-PAGE protein separation | ||
| GEOquery package | Bioconductor | https://bioconductor.org/packages/GEOquery/ | Version 2.68.0; Retrieval of gene expression and metadata from the GEO database |
| ggplot2 package | CRAN | https://cran.r-project.org/package=ggplot2 | Version 4.0.2; Data visualization |
| glmnet package | CRAN | https://cran.r-project.org/package=glmnet | Version 4.1.10; LASSO feature selection |
| GROMACS | GROMACS Development Team | https://www.gromacs.org/ | Version 2022.3; Molecular dynamics simulations and trajectory analysis |
| GS AntiQ qPCR SYBR Green Fast Mix (Universal) | Genesand | SQ410 | |
| GSE163973 | GEO database | https://www.ncbi.nlm.nih.gov/geo/query/acc.cgi?acc=GSE163973 | 3 keloid samples; Single-cell expression analysis |
| GSE44270 | GEO database | https://www.ncbi.nlm.nih.gov/geo/query/acc.cgi?acc=GSE44270 | 18 keloid and 14 normal samples; Differential expression and biomarker screening |
| GSE7890 | GEO database | https://www.ncbi.nlm.nih.gov/geo/query/acc.cgi?acc=GSE7890 | 10 keloid and 9 normal samples; Independent validation of diagnostic biomarkers |
| GSVA package | Bioconductor | https://bioconductor.org/packages/GSVA/ | Version 1.48.3; ssGSEA-based immune cell infiltration analysis |
| HRP-conjugated goat anti-mouse IgG | Abcam | ab97040 | |
| HRP-conjugated goat anti-rabbit IgG | Abcam | ab97051 | |
| Humidified CO2 incubator | 37 °C, 5% CO2; Maintenance of NHDF and PKF cells | ||
| ImageJ | National Institutes of Health | https://imagej.nih.gov/ij/ | Quantification of western blot band intensity |
| Insulin | 5 μg/mL final concentration; Supplement for fibroblast culture medium | ||
| Molecular Signatures Database (MSigDB) | Broad Institute | https://www.gsea-msigdb.org/gsea/msigdb | Version 2024.1.Hs; Source of heme metabolism-associated gene sets |
| NetworkAnalyst | NetworkAnalyst | https://www.networkanalyst.ca/ | Version 3.0; Construction of the miRNA-mRNA interaction network |
| NHDF | Procell | CP-H106 | |
| Nonfat dry milk | 5% solution; Membrane blocking for western blot analysis | ||
| Optical sealing film or caps | Sealing qRT-PCR reactions | ||
| PBS | Procell | PB180327 | |
| PDB ID: 8UBZ | RCSB PDB | https://www.rcsb.org/structure/8UBZ | Human FLVCR1 structure; Source of the FLVCR1 protein structure for structure-based virtual screening |
| Phosphatase inhibitors | Supplement for protein lysis buffer | ||
| PKF | Procell | GCP-H235 | |
| PMSF | Servicebio | G2008-1ML | |
| pROC package | CRAN | https://cran.r-project.org/package=pROC | Version 1.19.0.1; ROC curve and AUC analysis |
| Protease inhibitor cocktail | Roche | 4693124001 | |
| Protein transfer apparatus | Transfer of proteins to PVDF membrane | ||
| PVDF membrane | Millipore | IPVH08100 | |
| PyMOL | Schrödinger, LLC | https://pymol.org/ | Version 2.6.1; Visualization and analysis of protein-ligand docking poses and molecular interactions |
| qRT-PCR plates or tubes | qRT-PCR reaction setup | ||
| R | R Foundation for Statistical Computing | https://www.r-project.org/ | Version 4.3.1; Statistical and bioinformatics analyses |
| randomForest package | CRAN | https://cran.r-project.org/package=randomForest | Version 4.7.1.2; Random forest feature selection |
| REACTOME_HEME_BIOSYNTHESIS; REACTOME_HEME_DEGRADATION; WIKIPATHWAYS_HEME_BIOSYNTHESIS; REACTOME_SCAVENGING_HEME_FROM_PLASMA; HALLMARK_HEME_METABOLISM | Molecular Signatures Database (MSigDB) | https://www.gsea-msigdb.org/gsea/msigdb | Version 2024.1.Hs; 283 unique genes after merging; Definition of heme metabolism-associated genes |
| Real-time PCR system | qRT-PCR amplification and detection | ||
| Recombinant human basic fibroblast growth factor | 1 ng/mL final concentration; Supplement for fibroblast culture medium | ||
| RIPA buffer | Servicebio | G2002 | |
| rms package | CRAN | https://cran.r-project.org/package=rms | Version 6.7.1; Nomogram construction |
| SDS-PAGE reagents or precast gels | Protein separation by SDS-PAGE | ||
| Seurat package | CRAN | https://satijalab.org/seurat/ | Version 5.4.0; scRNA-seq preprocessing, clustering, and visualization |
| TarBase | DIANA Tools | https://carolina.imis.athena-innovation.gr/diana_tools/ | Version 9.0; Source of experimentally supported miRNA-mRNA interactions |
| Total RNA Kit II | Omega | R6934-01 | |
| Traditional Chinese medicine active compound library | Source of candidate compounds for virtual screening | ||
| Tween/Tris-buffered saline | Preparation of blocking buffer and membrane washing | ||
| UnionScript First-strand cDNA Synthesis Mix for qPCR (with dsDNase) | Genesand | SR511 |
References
- Dirand Z, et al. Macrophage phenotype is determinant for fibrosis development in keloid disease. Matrix Biol. 2024;128:79-92.
- Fang X, et al. Hypertrophic scarring and keloids: epidemiology, molecular pathogenesis, and therapeutic interventions. MedComm (2020). 2025;6(10):e70381.
- Adler R, et al. Pentoxifylline and long-term risk of keloid formation: a real-world 10-year outcomes study using TriNetX. J Am Acad Dermatol. 2026;94(5):1561-3.
- Banerjee P, et al. Anti-fibrotic properties of a decellularized extracellular matrix scaffold from porcine small intestinal submucosa in normal human and keloid fibroblasts. Int J Mol Sci. 2025;26(24):11764.
- Chang YH, McGrath JA, Hsu CK. Regression of extensive keloids during imatinib therapy for gastrointestinal stromal tumor. JAMA Dermatol. 2025;161(12):1293-4.
- Wang QR, et al. CCL17 drives fibroblast activation in the progression of pulmonary fibrosis by enhancing the TGF-β/Smad signaling. Biochem Pharmacol. 2023;210:115475.
- Higuchi Y, et al. Cavin-2 promotes fibroblast-to-myofibroblast trans-differentiation and aggravates cardiac fibrosis. ESC Heart Fail. 2024;11(1):167-78.
- Zhang H, et al. Plasma apolipoprotein E protein attenuates pulmonary fibrosis through LRP1 and PLAU dual receptor-mediated TGF-β/Smad inhibition. J Adv Res. 2025. doi:10.1016/j.jare.2025.12.045.
- Chen Q, et al. Immune imbalance drives keloid pathogenesis: emerging targets for precision immunotherapy. Adv Wound Care (New Rochelle). 2026:21621918261417702.
- Deng CC, et al. Single-cell RNA-seq reveals immune cell heterogeneity and increased Th17 cells in human fibrotic skin diseases. Front Immunol. 2024;15:1522076.
- Wang Q, et al. Weighted gene co-expression network analysis and machine learning identified the lipid metabolism-related gene LGMN as a novel biomarker for keloid. Exp Dermatol. 2024;33(1):e14974.
- Zhang W, et al. New insights into keloid pathogenesis: biomarker potential for CDK7 and DDB2. Front Cell Dev Biol. 2025;13:1718189.
- Li W, et al. Altered arginine metabolism affects proliferation and radiosensitivity of keloids. Exp Dermatol. 2025;34(3):e70077.
- Jiang J, et al. Ambient fine particulate matter induces cardiac fibrosis through triggering ferroptosis by heme degradation induced-iron overload. Ecotoxicol Environ Saf. 2025;297:118227.
- Lin W, et al. Heme oxygenase-1 overexpression activates the IRF1/DRP1 signaling pathway to promote M2-type polarization of spinal cord microglia. Drug Dev Res. 2024;85(8):e70033.
- Knez J, Kovačič B, Goropevšek A. The role of regulatory T-cells in the development of endometriosis. Hum Reprod. 2024;39(7):1367-80.
- Voltarelli VA, et al. Heme: the lord of the iron ring. Antioxidants (Basel). 2023;12(5):1074.
- Wilks A, Egoshi R. Heme trafficking and the importance of handling nature's most versatile cofactor. Chem Rev. 2025;125(23):11358-78.
- Bertino F, et al. Dysregulation of FLVCR1a-dependent mitochondrial calcium handling in neural progenitors causes congenital hydrocephalus. Cell Rep Med. 2024;5(7):101647.
- Kumar A, et al. Iron regulates the quiescence of naive CD4 T cells by controlling mitochondria and cellular metabolism. Proc Natl Acad Sci U S A. 2024;121(17):e2318420121.
- Jiang H, et al. Gut microbiota dysbiosis in diabetic nephropathy: mechanisms and therapeutic targeting via the gut-kidney axis. Front Endocrinol (Lausanne). 2025;16:1661037.
- Charoentong P, et al. Pan-cancer immunogenomic analyses reveal genotype-immunophenotype relationships and predictors of response to checkpoint blockade. Cell Rep. 2017;18(1):248-62.
- Chen Y, et al. 5-ALA photodynamic metabolite-powered zero-waste ferroptosis amplifier for enhanced hypertrophic scar therapy. Nat Commun. 2025;16(1):8321.
- Li X, et al. Hypericin-mediated photodynamic therapy promotes apoptosis and inhibits fibrosis by inducing HMOX1-mediated ferroptosis in hypertrophic scar fibroblasts. J Photochem Photobiol B. 2025;273:113303.
- Chen Y, et al. Functional transdermal nanoethosomes enhance photodynamic therapy of hypertrophic scars via self-generating oxygen. ACS Appl Mater Interfaces. 2021;13(7):7955-65.
- Oh S, et al. Revealing the pathogenesis of keloids based on the status: active vs inactive. Exp Dermatol. 2024;33(5):e15088.
- Zhao S, et al. New anti-fibrotic strategies for keloids: insights from single-cell multi-omics. Cell Prolif. 2025;58(6):e13818.
- Yasujima T, et al. The role of FLVCR1 and FLVCR2 in choline transport in the Caco-2 intestinal epithelial cell model and rat small intestine. Biochim Biophys Acta Mol Basis Dis. 2025;1871(6):167883.
- Zhang M, Chen H, Qian H, Wang C. Characterization of the skin keloid microenvironment. Cell Commun Signal. 2023;21(1):207.
- Wang Y, et al. FoxC1 activates Notch3 signaling to promote the inflammatory phenotype of keloid fibroblasts and aggravates keloid. Exp Cell Res. 2025;444(2):114402.
- Zhang J, et al. ERG transcriptionally activates SFRP1 to promote apoptosis of keloid fibroblasts and inhibit epithelial-mesenchymal transition and fibrosis through the Wnt3a/β-catenin pathway. Arch Dermatol Res. 2025;317(1):467.
- Ramos-Tovar E, Muriel P. NLRP3 inflammasome in hepatic diseases: a pharmacological target. Biochem Pharmacol. 2023;217:115861.
- Brahadeeswaran S, et al. NLRP3: a new therapeutic target in alcoholic liver disease. Front Immunol. 2023;14:1215333.
- Xiao Y, et al. STING mediates hepatocyte pyroptosis in liver fibrosis by epigenetically activating the NLRP3 inflammasome. Redox Biol. 2023;62:102691.
- Paolucci T, et al. Quantum molecular resonance inhibits NLRP3 inflammasome/nitrosative stress and promotes M1 to M2 macrophage polarization: potential therapeutic effect in osteoarthritis model in vitro. Antioxidants (Basel). 2023;12(7):1358.
- Wei J, et al. FERM domain containing kindlin 1 knockdown attenuates inflammation induced by intracerebral hemorrhage in rats via NLR family pyrin domain containing 3/nuclear factor kappa B pathway. Exp Anim. 2023;72(3):324-35.
- Tao L, Zhou Y, Wu L, Liu J. Comprehensive analysis of sialylation-related genes and construct the prognostic model in sepsis. Sci Rep. 2024;14(1):18110.
- Sun Q, et al. Identification of hub genes and key pathways associated with sepsis progression using weighted gene co-expression network analysis and machine learning. Int J Mol Sci. 2025;26(9):4433.
- Chen JJ. HRI protein kinase in cytoplasmic heme sensing and mitochondrial stress response: relevance to hematological and mitochondrial diseases. J Biol Chem. 2025;301(5):108494.
- Chakrabarty Y, Yang Z, Chen H, Chan DC. The HRI branch of the integrated stress response selectively triggers mitophagy. Mol Cell. 2024;84(6):1090-100.e6.
- Bora P, et al. Drug repurposing screen identifies an HRI activating compound that promotes adaptive mitochondrial remodeling in MFN2-deficient cells. Proc Natl Acad Sci U S A. 2025;122(48):e2517552122.
- Zhang C, et al. CaMKII suppresses proteotoxicity by phosphorylating BAG3 in response to proteasomal dysfunction. EMBO Rep. 2024;25(10):4488-514.
- Chaabani H, et al. Trifloxystrobin induces oxidative stress-dependent activation of the OMA1-DELE1-HRI integrated stress response leading to apoptosis in human neuroblastoma cells. Environ Pollut. 2026;390:127562.
- Das R, et al. CMT2A-linked MFN2 mutation, T206I promotes mitochondrial hyperfusion and predisposes cells towards mitophagy. Mitochondrion. 2024;74:101825.
- De Simone G, et al. Heme scavenging and delivery: the role of human serum albumin. Biomolecules. 2023;13(3):575.
- Turilli-Ghisolfi ES, Lualdi M, Fasano M. Ligand-based regulation of dynamics and reactivity of hemoproteins. Biomolecules. 2023;13(4):683.
- Zhang P, et al. Risk factors and prediction models for cardiotoxicity induced by anthracyclines in malignant chemotherapy. Cancer Chemother Pharmacol. 2025;95(1):73.
- Petrillo S, et al. Endothelial cells require functional FLVCR1a during developmental and adult angiogenesis. Angiogenesis. 2023;26(3):365-84.
- Fiorito V, Tolosano E. Unearthing FLVCR1a: tracing the path to a vital cellular transporter. Cell Mol Life Sci. 2024;81(1):166.
- Manco M, et al. FLVCR1a controls cellular cholesterol levels through the regulation of heme biosynthesis and tricarboxylic acid cycle flux in endothelial cells. Biomolecules. 2024;14(2):149.
- Shi X, et al. Increased melanin induces aberrant keratinocyte-melanocyte-basal-fibroblast cell communication and fibrogenesis by inducing iron overload and ferroptosis resistance in keloids. Cell Commun Signal. 2025;23(1):141.
- Khunger N, Dash A. Impact of air pollution on skin pigmentation: mechanisms and protective strategies. Int J Dermatol. 2025;64(10):1788-801.
- Ahuja K, Raju S, Dahiya S, Motiani RK. ROS and calcium signaling are critical determinant of skin pigmentation. Cell Calcium. 2025;125:102987.
- Dutta A, Chakraborty S, Roy A, Mittal A, et al. Tissue fibrosis in cardiorenal syndrome: crosstalk between heart and kidneys. Nephrol Dial Transplant. 2025;40(7):1273-83.
- Noah AA, et al. Reversal of fibrosis and portal hypertension by empagliflozin treatment of CCl4-induced liver fibrosis: emphasis on gal-1/NRP-1/TGF-β and gal-1/NRP-1/VEGFR2 pathways. Eur J Pharmacol. 2023;959:176066.
- Murakami T, Shigeki S. Pharmacotherapy for keloids and hypertrophic scars. Int J Mol Sci. 2024;25(9):4674.
- Jin J, Zheng Z. Gut microbiota-derived metabolites in keloid and hypertrophic scarring. Front Microbiol. 2025;16:1644758.
- Aubert A, et al. Potential implications of granzyme B in keloids and hypertrophic scars through extracellular matrix remodeling and latent TGF-β activation. Front Immunol. 2024;15:1484462.