Eight weeks of treadmill exercise was associated with cardiac, intestinal barrier, and Nlrp3-related transcriptional changes, as well as altered gut microbiota, particularly increased Akkermansia muciniphila, in diabetic mice.
Research Article
Treadmill Exercise is Associated with Intestinal Barrier and Cardiac Nlrp3 Gene Expression Changes in Diabetic Mice
In This Article
Summary
Abstract
This study investigated associations between exercise, intestinal barrier-related gene expression, and cardiac Nlrp3 inflammasome-related gene expression in a diabetic mouse model. Metabolic dysregulation was induced in male C57BL/6J mice using a high-fat diet combined with low-dose streptozotocin, followed by 8 weeks of treadmill exercise (5° slope, 12 m/min, 20–50 min/day, 5 days/week). Compared with sedentary diabetic mice, exercised mice showed lower fasting glucose, insulin resistance, and serum lipid levels, along with higher colonic Occludin mRNA expression (relative expression: 0.38 ± 0.04 in diabetic mice vs. 0.79 ± 0.05 in exercised mice, P < 0.001), lower cardiac Nlrp3, IL-1β, TNF-α, Col1a1, and Tgfb1 mRNA expression, and a lower Bax/Bcl-2 mRNA ratio (3.06 ± 0.19 vs. 1.48 ± 0.10, P < 0.001). Fecal qPCR analysis of six selected taxa showed that exercise was associated with increased relative abundances of Akkermansia muciniphila (0.31 ± 0.04 to 0.84 ± 0.07) and Lactobacillus (0.48 ± 0.05 to 1.01 ± 0.07) and decreased Escherichia coli (3.84 ± 0.33 to 1.68 ± 0.13, P < 0.01). In exercised mice, A. muciniphila abundance was negatively correlated with cardiac Nlrp3 mRNA expression (R = −0.81, P = 0.0046). These correlational findings indicate associations among exercise, cardiac and intestinal transcriptional changes, and selected gut microbial taxa in diabetic mice but do not establish causal relationships. All molecular findings are limited to mRNA-level changes and do not demonstrate intestinal barrier function, inflammasome activation, myocardial fibrosis, apoptosis, or other functional or protein-level effects.
Introduction
Diabetes mellitus is a growing global health threat, and diabetic cardiac complications remain serious conditions with limited specific therapies1,2,3,4. Exercise training can improve cardiac function in diabetic animal models5,6, but the underlying mechanisms, particularly those involving the gut microbiota and intestinal barrier, remain incompletely understood.
The gut microbiota regulates host metabolism and immunity7. In diabetes, gut dysbiosis and impaired barrier integrity can increase lipopolysaccharide (LPS) translocation, promote TLR4-mediated inflammation, and exacerbate myocardial injury8,9. This gut-derived inflammatory burden may contribute to the progression of diabetic complications, including cardiac dysfunction. Beneficial bacteria such as Akkermansia and Faecalibacterium may be reduced, whereas bacteria such as E. coli may increase10,11. Such microbial alterations may contribute to local intestinal inflammation and systemic endotoxemia, potentially affecting distant organs, including the heart. The NLRP3 inflammasome is an important mediator of cardiac inflammation in diabetic cardiac pathology, and its activation may be modulated by gut microbial metabolites12,13. Certain microbial products, particularly short-chain fatty acids and LPS, have opposing effects on NLRP3 priming and assembly, suggesting a potential association between the gut microbial environment and myocardial inflammatory status.
Exercise can alter the gut microbiota and improve intestinal barrier function14,15, but the associations among exercise, intestinal barrier-related gene expression, and cardiac NLRP3 inflammasome-related gene expression in diabetic models remain incompletely understood. The intestinal epithelium serves as an interface between luminal microbes and the systemic circulation and may therefore contribute to associations between changes in the gut microbiota and cardiac inflammatory responses. However, direct experimental evidence establishing a causal relationship among exercise-induced changes in the intestinal barrier, NLRP3 inflammasome activation, and cardiac protection in diabetic models remains lacking.
Therefore, the hypothesis was that treadmill exercise would be associated with cardiac transcriptional changes, altered selected gut microbial taxa, preservation of intestinal barrier-related gene expression, and reduced cardiac NLRP3 inflammasome-related gene expression in diabetic mice. A diabetic mouse model was established using a high-fat diet combined with low-dose streptozotocin, followed by an 8-week treadmill exercise intervention. Assessments included metabolic parameters, colonic Occludin mRNA expression, cardiac NLRP3 inflammasome-related gene expression, and inflammatory, fibrotic, and apoptotic gene-expression markers. Selected gut microbial taxa were also quantified to assess exercise-associated changes in the gut microbiota. Correlation analyses were used to examine associations among selected gut microbial taxa, intestinal barrier-related gene expression, and cardiac transcriptional markers. These analyses were designed to identify associations rather than establish a causal gut-barrier-NLRP3 mechanism.
Protocol
All animal procedures were performed at an animal facility accredited by an international laboratory animal care accreditation organization. The protocol was reviewed and approved by the facility’s Institutional Animal Care and Use Committee (IACUC; approval ID: VS212500103). The experiments were conducted at an approved external facility because the home institution lacked a licensed animal facility for this specific model.
Establishment of the diabetic mouse model
Male C57BL/6J mice (8 weeks old, specific-pathogen-free grade, body weight 20–22 g) were acclimatized for 1 week under controlled conditions (22 ± 2 °C, 50 ± 10% relative humidity, 12 h light/dark cycle) with ad libitum access to standard chow and water.
After acclimatization, mice were randomly allocated using a random-number table to a normal control group (Control, n = 10) or a diabetes induction group. Experimental procedures and outcome measurements were performed with investigators blinded to group allocation. Animals were housed four per cage in standard polycarbonate cages with enriched bedding under specific-pathogen-free conditions. Only male mice were used to minimize potential variability associated with estrous cycles and because the high-fat diet/STZ model produced more consistent metabolic phenotypes in males.
Mice undergoing diabetes induction were fed a high-fat diet (60% kcal from fat) for 4 weeks, followed by intraperitoneal injections of streptozotocin (STZ; 30 mg/kg body weight) for 5 consecutive days. STZ was freshly dissolved in 0.1 mol/L citrate buffer (pH 4.5), protected from light, and administered within 15 min of preparation. Control mice received equivalent volumes of citrate buffer. One week after the final injection, fasting blood glucose (FBG) was measured from tail-tip blood after a 6 h fast. Mice with FBG ≥ 11.1 mmol/L were considered diabetic. These mice were maintained on the high-fat diet for an additional 4 weeks to allow the development of diabetes-related changes in gene expression.
A total of 35 mice underwent model induction, of which 28 met the diabetes criterion. Body weight and food intake were monitored weekly but were not used as exclusion criteria. No animals died or were excluded during the modeling or intervention phases. Successfully modeled mice were randomly subdivided into a diabetes group (DM, n = 10) and an exercise intervention group (DM+Ex, n = 10). The final sample size was n = 10 per group across all analyses, with each individual mouse as the experimental unit.
Treadmill exercise intervention
Mice in the DM+Ex group performed treadmill exercise at a 5° incline and 12 m/min, 5 days/week for 8 weeks. All exercise sessions were conducted between 9:00 and 11:00 AM. Before the intervention, mice were acclimatized to treadmill running for 3 days at 6 m/min for 5 min/day at a 0° incline. Each exercise session included a 5-min warm-up at 6 m/min and a 5-min cool-down at 6 m/min. Mild prodding was used to encourage running, and electrical stimulation was not used.
Daily running durations were 20 min in week 1, 25 min in week 2, 30 min in week 3, 35 min in week 4, 40 min in week 5, 45 min in week 6, and 50 min in weeks 7–8. Control and DM mice were placed on stationary treadmills for equivalent durations to control for handling and environmental exposure. A predefined exclusion criterion was failure to complete more than 80% of the prescribed exercise sessions. No animals met this criterion; all animals completed the prescribed exercise sessions, and no adverse events were observed.
Sample collection
Twelve hours after the final exercise session, mice were fasted for 6 h and anesthetized by isoflurane inhalation (3% induction and 1.5–2% maintenance in 100% O₂ at 1 L/min). Approximately 500 µL of blood was collected from the retro-orbital venous plexus, allowed to clot at room temperature for 30 min, and centrifuged at 3,000 × g for 15 min at 4 °C. The resulting serum was stored at −80 °C.
Mice were subsequently euthanized by cervical dislocation under deep anesthesia. Hearts were rapidly excised and flushed with ice-cold phosphate-buffered saline (PBS). Left ventricular tissue was isolated; one portion was snap-frozen in liquid nitrogen and stored at −80 °C for RNA extraction, and the remaining tissue was fixed in 4% paraformaldehyde. Approximately 1 cm of distal colonic tissue was collected, flushed with PBS, snap-frozen, and stored at −80 °C. Fresh fecal samples were collected directly from the rectum between 9:00 and 10:00 AM to minimize cage contamination, transferred to sterile tubes, and stored at −80 °C within 15 min of collection.
Serum biochemical measurements
FBG was measured using a blood glucose measurement system. Serum insulin was determined by enzyme-linked immunosorbent assay, and total cholesterol and triglycerides were measured using an automated biochemical analyzer. Insulin resistance was calculated using the homeostatic model assessment: HOMA-IR = FBG (mmol/L) × insulin (mIU/L)/22.5.
RNA extraction and real-time quantitative PCR from myocardial tissue
Approximately 30 mg of left ventricular tissue was homogenized in a phenol-guanidinium-based RNA extraction reagent, and total RNA was extracted according to the reagent protocol. RNA concentration and purity were assessed spectrophotometrically, with an A260/A280 ratio of 1.8–2.0 considered acceptable. Total RNA (1 µg) was reverse-transcribed into complementary DNA (cDNA).
Quantitative PCR (qPCR) was performed in a 20 µL reaction mixture containing a fluorescent DNA-binding qPCR master mix, 0.4 µmol/L each of forward and reverse primers, and 2 µL of cDNA template. The amplification conditions were 95 °C for 30 s, followed by 40 cycles of 95 °C for 5 s and 60 °C for 34 s. Melt-curve analysis was performed over the range 65–95 °C to verify amplification specificity. All reactions were performed in duplicate, and no-template and no-reverse-transcription controls were included. Amplification efficiencies for all primer pairs ranged from 90–105%. Primers for Tnfa, Il1b, Tgfb1, Col1a1, Nlrp3, and Gapdh are listed in Table 1. Relative gene expression was calculated using the 2−ΔΔCt method and expressed as fold change relative to the Control group.
Fecal microbiota DNA extraction and qPCR quantification
Total microbial DNA was extracted from fecal samples using a stool DNA extraction protocol. The relative abundances of six selected bacterial taxa—Faecalibacterium prausnitzii, Akkermansia muciniphila, Lactobacillus genus, Bifidobacterium genus, Escherichia coli, and Desulfovibrio genus—were determined by qPCR using taxon-specific primers listed in Table 1. Universal bacterial 16S rRNA primers were used as the reference for total bacterial abundance.
Relative abundance was calculated using the 2−ΔΔCt method with total bacterial 16S rRNA as the reference and was normalized to the Control group. Standard curves were generated for each target using serial dilutions of plasmid DNA at known concentrations to verify amplification efficiency. All reactions were performed in duplicate with melt-curve analysis. Because bacterial taxa differ in 16S rRNA gene copy number, the results were reported as 2−ΔΔCt relative abundance rather than absolute copy numbers.
Assessment of colonic Occludin expression
Approximately 30 mg of colonic tissue was processed for total RNA extraction and cDNA synthesis as described above. Occludin mRNA expression was measured by qPCR using the following primers: forward, 5′-GTCGAATGTCTTTGCTGGTGGT-3′; reverse, 5′-GCAGCAGCCATGTACTCTTCAC-3′. Gapdh was used as the internal reference, and relative expression was calculated using the 2−ΔΔCt method.
Statistical analysis
Data were presented as mean ± standard deviation (SD). Normality was assessed using the Shapiro-Wilk test, and homogeneity of variance was assessed using Levene's test. Between-group data that met parametric assumptions were analyzed using one-way analysis of variance (ANOVA), followed by Tukey's honestly significant difference (HSD) test for post hoc pairwise comparisons. Two-group comparisons were performed using an unpaired two-tailed Student's t-test.
Spearman's rank correlation was used to assess associations between variables. For the correlation heatmap, partial Spearman correlations controlling for the experimental group were calculated. P values were adjusted for multiple comparisons using the Benjamini-Hochberg false discovery rate (FDR) procedure, and an FDR-adjusted P < 0.05 was considered statistically significant. Effect sizes (Cohen's f for ANOVA and r for correlations) and 95% confidence intervals for key mean differences were reported where applicable. All statistical analyses were performed using statistical computing software (version 4.2.0).
Results
Treadmill exercise was associated with amelioration of metabolic abnormalities in diabetic mice
Compared with the Control group, diabetic mice exhibited significantly higher fasting blood glucose (18.23 ± 0.61 vs. 6.03 ± 0.21 mmol/L, P < 0.001), serum insulin (16.30 ± 1.04 vs. 8.23 ± 0.38 mIU/L, P < 0.001), HOMA-IR (13.19 ± 1.18 vs. 2.21 ± 0.17, P < 0.001), total cholesterol (4.62 ± 0.23 vs. 2.01 ± 0.09 mmol/L, P < 0.001), and triglycerides (2.12 ± 0.15 vs. 0.80 ± 0.08 mmol/L, P < 0.001). Following the 8-week treadmill exercise intervention, these parameters decreased to 12.03 ± 0.63 mmol/L, 10.61 ± 0.71 mIU/L, 5.69 ± 0.67, 3.09 ± 0.24 mmol/L, and 1.20 ± 0.14 mmol/L, respectively, compared with diabetic mice (P < 0.01 or P < 0.001); however, most values remained higher than those in the Control group (Figure 1A–E). One-way ANOVA showed significant group effects for all parameters (all F(2,27) > 25.0, P < 0.001).
Exercise training was associated with higher colonic Occludin mRNA expression and lower cardiac inflammasome-related gene expression
In diabetic mice, colonic Occludin mRNA expression was approximately 62% lower than that in the Control group (0.38 ± 0.04 vs. 1.00 ± 0.06, P < 0.001). Concurrently, cardiac Nlrp3, Il1b, and Tnfa mRNA expression increased to 5.6-fold, 6.5-fold, and 5.1-fold of Control values, respectively (all P < 0.001). Following exercise intervention, Occludin mRNA expression increased to 0.79 ± 0.05 (P < 0.001 vs. diabetic mice), whereas Nlrp3, Il1b, and Tnfa mRNA expression decreased to 2.30 ± 0.21, 2.66 ± 0.25, and 2.14 ± 0.17, respectively (all P < 0.001 vs. diabetic mice; Figure 2A–D).
Exercise was associated with lower myocardial fibrosis- and apoptosis-related gene expression
The diabetic group showed increased cardiac expression of the fibrosis-related genes Col1a1 (4.46 ± 0.29-fold, P < 0.001) and Tgfb1 (4.17 ± 0.24-fold, P < 0.001), together with a higher Bax/Bcl2 mRNA ratio (3.06 ± 0.19, P < 0.001) compared with the Control group. Following exercise training, Col1a1 and Tgfb1 mRNA expression decreased to 2.02 ± 0.16 and 1.92 ± 0.16, respectively (both P < 0.001 vs. diabetic mice), and the Bax/Bcl2 mRNA ratio decreased to 1.48 ± 0.10 (P < 0.001 vs. diabetic mice; Figure 3A–C).
Exercise was associated with changes in selected gut microbial taxa in diabetic mice
Compared with the Control group, diabetic mice exhibited significantly lower relative abundances of four selected bacterial taxa: F. prausnitzii (0.25 ± 0.03 vs. 1.01 ± 0.07), A. muciniphila (0.31 ± 0.04 vs. 1.00 ± 0.06), Lactobacillus (0.48 ± 0.05 vs. 0.99 ± 0.04), and Bifidobacterium (0.56 ± 0.06 vs. 1.00 ± 0.06; all P < 0.001). In contrast, the relative abundances of E. coli (3.84 ± 0.33 vs. 0.99 ± 0.08) and Desulfovibrio (3.07 ± 0.26 vs. 0.99 ± 0.07) were significantly higher (both P < 0.001). Exercise intervention was associated with significantly higher relative abundances of F. prausnitzii, A. muciniphila, Lactobacillus, and Bifidobacterium (P < 0.01 or P < 0.001), with A. muciniphila reaching 0.84 ± 0.07. Concurrently, the relative abundances of E. coli and Desulfovibrio decreased to 1.68 ± 0.13 and 1.52 ± 0.08, respectively (both P < 0.001 vs. diabetic mice; Figure 4A–F).
Selected microbial alterations were correlated with cardiac and colonic gene expression
Spearman's correlation analysis was performed to assess associations between the relative abundances of selected microbial taxa and gene-expression markers in cardiac and colonic tissues (Figure 5A). The relative abundance of A. muciniphila was negatively correlated with cardiac Nlrp3 mRNA (R = −0.81, P = 0.0046) and Tnfa mRNA (R = −0.80, P = 0.0054). The relative abundance of E. coli was positively correlated with colonic Occludin mRNA expression (R = 0.66, P = 0.036; Figure 5B–D). These findings showed associations between selected gut microbial taxa and cardiac and colonic transcriptional markers but did not establish causal relationships.
DATA AVAILABILITY:
The datasets generated and/or analyzed during the current study are available from the corresponding author upon reasonable request.
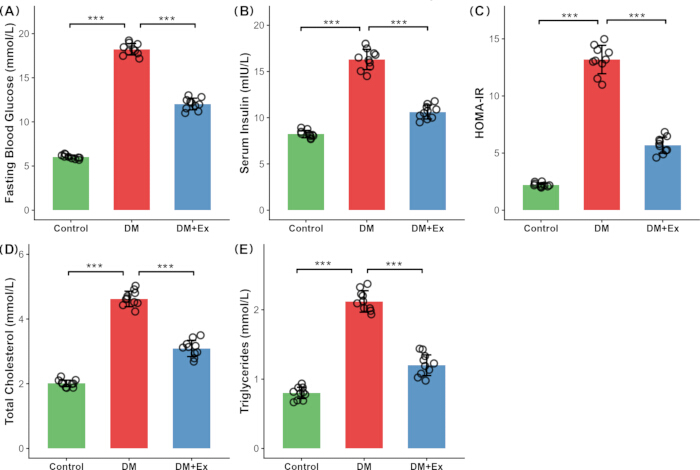
Figure 1: Effects of treadmill exercise on metabolic parameters in diabetic mice. (A) Fasting blood glucose. (B) Serum insulin. (C) HOMA-IR. (D) Total cholesterol. (E) Triglycerides in the Control, DM, and DM+Ex groups. Data are presented as mean ± SD (n = 10 per group), with individual data points overlaid on each bar. Comparisons among groups were performed using one-way ANOVA followed by Tukey's post hoc test. *P < 0.05, **P < 0.01, ***P < 0.001; ns = not significant. Abbreviations: DM = diabetes model; Ex = exercise; HOMA-IR = homeostatic model assessment of insulin resistance; SD = standard deviation. Please click here to view a larger version of this figure.
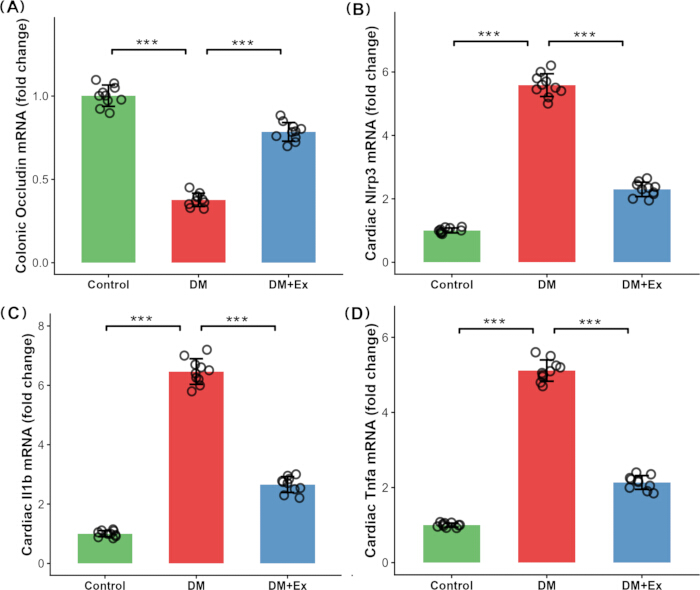
Figure 2: Effects of treadmill exercise on intestinal barrier-related and cardiac inflammasome-related gene expression in diabetic mice. (A) Relative colonic Occludin mRNA expression. (B) Relative cardiac Nlrp3 mRNA expression. (C) Relative cardiac Il1b mRNA expression. (D) Relative cardiac Tnfa mRNA expression. Gene expression was normalized to Gapdh and expressed as fold change relative to the Control group. Data are presented as mean ± SD (n = 10 per group). *P < 0.05, **P < 0.01, ***P < 0.001. Abbreviations: IL-1β = interleukin-1β; TNF-α = tumor necrosis factor-α; SD = standard deviation. Please click here to view a larger version of this figure.
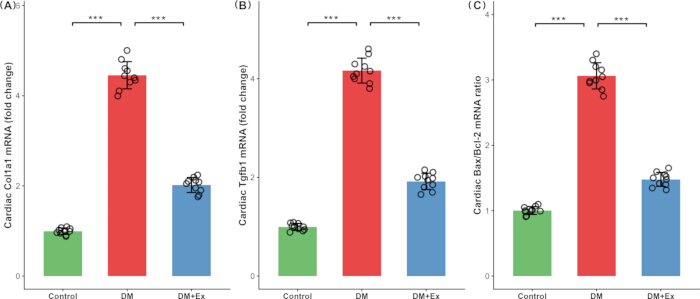
Figure 3: Effects of treadmill exercise on myocardial fibrosis-related and apoptosis-related gene expression in diabetic mice. (A) Relative cardiac Col1a1 mRNA expression. (B) Relative cardiac Tgfb1 mRNA expression. (C) Bax/Bcl2 mRNA ratio. Gene expression was normalized to Gapdh and expressed as fold change relative to the Control group. The Bax/Bcl2 ratio was calculated from relative mRNA expression values. Data are presented as mean ± SD (n = 10 per group), with individual data points overlaid on each bar. *P < 0.05, **P < 0.01, ***P < 0.001. Abbreviations: Col1a1 = collagen type I alpha 1; Tgfb1 = transforming growth factor-β1; Bax = BCL2-associated X protein; Bcl2 = B-cell lymphoma 2; SD = standard deviation. Please click here to view a larger version of this figure.
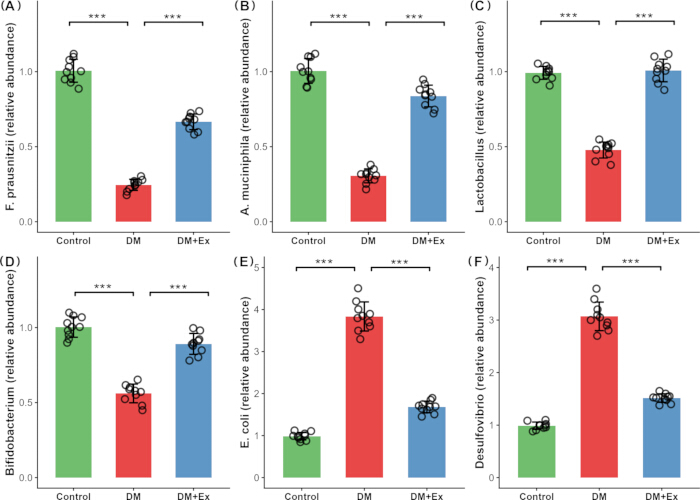
Figure 4: Effects of treadmill exercise on the relative abundances of selected gut microbial taxa in diabetic mice. (A) Faecalibacterium prausnitzii. (B) Akkermansia muciniphila. (C) Lactobacillus. (D) Bifidobacterium. (E) Escherichia coli. (F) Desulfovibrio. Relative abundances were determined by qPCR using taxon-specific 16S rRNA targets relative to total bacterial 16S rRNA and normalized to the Control group. Data are presented as mean ± SD (n = 10 per group). *P < 0.05, **P < 0.01, ***P < 0.001. Abbreviation: SD = standard deviation. Please click here to view a larger version of this figure.
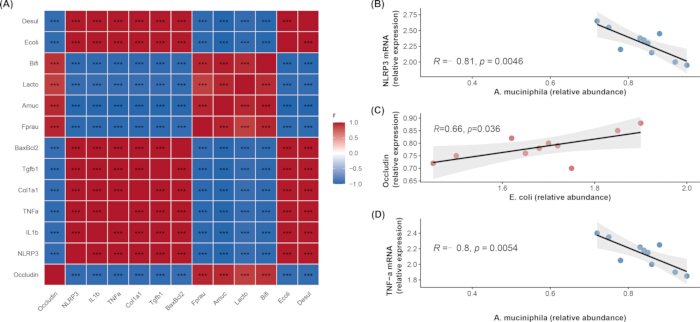
Figure 5: Correlation analysis between selected gut microbial taxa and cardiac and colonic gene-expression parameters. (A) Heatmap showing Spearman's correlation coefficients between selected bacterial taxa and colonic Occludin mRNA, cardiac Nlrp3, Il1b, and Tnfa mRNAs, Col1a1 and Tgfb1 mRNAs, and the Bax/Bcl2 mRNA ratio. Correlations were calculated using data from all three groups (n = 30) as partial Spearman correlations controlling for the experimental group. The color scale ranges from blue for negative correlations to red for positive correlations. Asterisks within the heatmap indicate significance after FDR correction (*P < 0.05, **P < 0.01, ***P < 0.001). (B) Correlation between A. muciniphila relative abundance and cardiac Nlrp3 mRNA expression within the DM+Ex group. (C) Correlation between E. coli relative abundance and colonic Occludin mRNA expression within the DM+Ex group. (D) Correlation between A. muciniphila relative abundance and cardiac Tnfa mRNA expression within the DM+Ex group. Each point represents an individual mouse. Linear regression lines and 95% confidence intervals are shown for visualization. Abbreviations: DM = diabetes model; Ex = exercise; FDR = false discovery rate. Please click here to view a larger version of this figure.
| Gene/Microbial | Forward Primer | Reverse Primer |
| Tnfa | CCCTCACACTCAGATCATCTTCT | GCTACGACGTGGGCTACAG |
| Il1b | GCAACTGTTCCTGAACTCAACT | ATCTTTTGGGGTCCGTCAACT |
| Tgfb1 | CTCCCGTGGCTTCTAGTGC | GCCTTAGTTTGGACAGGATCTG |
| Col1a1 | GCTCCTCTTAGGGGCCACT | CCACGTCTCACCATTGGGG |
| Bax | AGACAGGGGCCTTTTTGCTAC | AATTCGCCGGAGACACTCG |
| Bcl2 | GCTACCGTCGTGACTTCGC | CCCCACCGAACTCAAAGAAGG |
| Nlrp3 | GTGAGCCCACACCACAGTTC | GACGTTCACCTCGCAGATGA |
| Gapdh | AGGTCGGTGTGAACGGATTTG | TGTAGACCATGTAGTTGAGGTCA |
| Total bacteria (16S rRNA) | ACTCCTACGGGAGGCAGCAG | ATTACCGCGGCTGCTGG |
| F. prausnitzii | GGAGGAAGAAGGTCTTCGG | AATTCCGCCTACCTCTGCACT |
| A. muciniphila | CAGCACGTGAAGGTGGGGAC | CCTTGCGGTTGGCTTCAGAT |
| Lactobacillus | AGCAGTAGGGAATCTTCCA | ATTYCACCGCTACACATG |
| Bifidobacterium | TCGCGTCCGGTGTGAAAG | CCACATCCAGCATCCAC |
| E. coli | AGGCCTTCGGGTTGTAAAGT | GTTAGCCGGTGCTTCTTCTG |
| Desulfovibrio | CCGTAGATATCTGGAGGAACATCAG | ACATCTAGCATCCATCGTTTACAGC |
Table 1: Primer sequences used for real-time quantitative PCR.
Discussion
In the present study, a diabetic mouse model induced by a high-fat diet combined with low-dose STZ was used to evaluate exercise-associated metabolic, intestinal, cardiac, and microbial changes. Eight weeks of treadmill exercise were associated with improved metabolic parameters, higher colonic Occludin mRNA expression, lower cardiac Nlrp3 inflammasome-related gene expression, and lower myocardial inflammation, fibrosis, and apoptosis-related gene expression. Exercise was also associated with changes in the relative abundances of selected gut microbial taxa. Collectively, these findings suggest that exercise-associated cardiac transcriptional changes may be related to alterations in intestinal barrier-related gene expression and selected gut microbial taxa, although causality was not established.
As expected for the diabetic model, mice developed pronounced metabolic disturbances, including hyperglycemia, hyperinsulinemia, insulin resistance, and dyslipidemia, consistent with the well-established pathological paradigm16,17. The 8-week exercise regimen was associated with reductions of approximately 34% in fasting glucose and 57% in HOMA-IR, indicating partial improvement in insulin resistance. At the myocardial level, exercise was associated with 40%–60% reductions in the expression of proinflammatory (Tnfa, Il1b), profibrotic (Tgfb1, Col1a1), and apoptosis-related (Bax/Bcl2) mRNA markers, consistent with previous studies linking aerobic exercise to AMPK activation and NF-κB inhibition18,19. However, none of these parameters returned to Control levels, indicating that the 8-week intervention was insufficient to normalize the established diabetes-associated transcriptional phenotype, which may be related to persistent glycemic memory effects20.
Colonic Occludin mRNA expression was approximately 62% lower in diabetic mice, suggesting reduced intestinal barrier-related gene expression. Concurrently, cardiac Nlrp3, Il1b, and Tnfa mRNA expression increased by 5.6-fold, 6.5-fold, and 5.1-fold, respectively. The NLRP3 inflammasome is an important sensor of the innate immune system and has been implicated in diabetic cardiac pathology. Hyperglycemia can increase myocardial Nlrp3 gene expression through reactive oxygen species (ROS) and thioredoxin-interacting protein (TXNIP) pathways, with subsequent effects on IL-1β- and IL-18-related inflammatory signaling21,22. Increased systemic translocation of lipopolysaccharide (LPS) secondary to intestinal barrier disruption has also been described as an upstream stimulus for NLRP3 priming23. LPS can increase Nlrp3 and pro-Il1b expression through the TLR4/MyD88/NF-κB signaling axis, providing the first signal required for inflammasome priming24. In the present diabetic model, an increased relative abundance of E. coli was observed, along with reduced colonic Occludin mRNA expression and increased cardiac inflammasome-related gene expression. These parallel changes are compatible with a possible gut-associated inflammatory pathway but do not demonstrate increased LPS translocation or a causal gut-heart mechanism.
Exercise intervention was associated with an increase in colonic Occludin mRNA expression to approximately 79% of the Control value, whereas cardiac Nlrp3, Il1b, and Tnfa mRNA expression decreased to approximately 2.3-, 2.7-, and 2.1-fold of the Control values, respectively. These findings indicate an association between higher intestinal barrier-related gene expression and lower cardiac inflammatory gene expression after exercise. Previous studies have proposed that exercise may support intestinal barrier function through enhanced mucus production, regulation of tight junction proteins, and improved intestinal perfusion25,26,27,28. However, the present data were limited to mRNA measurements and therefore did not confirm these functional mechanisms.
Targeted gut microbiota analysis showed that exercise was associated with partial reversal of diabetes-associated changes in the relative abundances of selected taxa, particularly an increase in A. muciniphila and a decrease in E. coli. These reciprocal changes are consistent with previously described associations between these taxa and barrier maintenance and endotoxin-related processes29,30,31. However, because only selected taxa were quantified, the findings should be interpreted as exercise-associated changes in the relative abundances of specific bacteria rather than as a comprehensive remodeling of the gut microbiota.
Correlation analysis further identified associations between selected microbial taxa and transcriptional markers. Within the exercise intervention group, A. muciniphila abundance was negatively correlated with cardiac Nlrp3 (R = −0.81, P = 0.0046) and Tnfa (R = −0.80, P = 0.0054) mRNA expression. In contrast, E. coli abundance was positively correlated with colonic Occludin mRNA expression (R = 0.66, P = 0.036; Figure 5C). The positive association between E. coli and Occludin mRNA was contrary to the initial hypothesis and indicates that the relationship between selected gut microbial taxa and intestinal barrier-related gene expression was not explained by a simple linear model. These correlations were consistent with associations among exercise, selected microbial taxa, and host transcriptional markers but did not establish causality. Previous evidence showing that depletion of A. muciniphila can increase intestinal permeability and metabolic endotoxemia32, together with evidence implicating NLRP3 in diabetic cardiac pathology33, provides a biological context for these associations. Nevertheless, the present study did not directly demonstrate that increased A. muciniphila enhanced mucus barrier function, reduced LPS translocation, or attenuated TLR4/NLRP3-mediated cardiac inflammation.
This study had several limitations. First, targeted 16S rRNA qPCR was used to quantify six representative bacterial taxa rather than 16S amplicon sequencing or metagenomic sequencing. Consequently, a comprehensive assessment of gut microbial community structure and functional capacity was not achieved, and broader community shifts or functional pathways could not be evaluated. The findings were therefore described as changes in the relative abundances of selected taxa rather than gut microbiota remodeling. Second, circulating LPS levels, plasma SCFA concentrations, and intestinal permeability were not measured directly, thereby limiting mechanistic interpretation. Third, the study relied primarily on mRNA expression data. Protein-level and functional validation of barrier integrity, inflammasome activation, fibrosis, and apoptosis were not performed. Accordingly, the conclusions were restricted to transcriptional changes and did not establish functional or protein-level effects. Fourth, only one exercise intensity and duration regimen was examined, limiting conclusions regarding an optimal exercise prescription for diabetes-associated cardiac transcriptional changes. Fifth, only male mice were studied, and the findings may not be generalizable to females. Sixth, the absence of a healthy exercise control group limited the ability to distinguish diabetes-specific responses from the physiological effects of exercise. Seventh, echocardiography and cardiac histopathology were not performed; therefore, the model was described as a diabetic mouse model rather than a confirmed model of diabetic cardiomyopathy, and all cardiac findings were limited to transcriptional changes. Finally, some observed correlations may have reflected group separation rather than within-group biological relationships, although partial correlation analysis controlling for group was used to reduce this concern.
In summary, 8 weeks of treadmill exercise were associated with metabolic improvement and cardiac and colonic transcriptional changes in diabetic mice. These changes occurred alongside changes in the relative abundances of selected gut microbial taxa, particularly increases in A. muciniphila and decreases in E. coli. The observed associations support further investigation of relationships among exercise, selected gut microbial taxa, intestinal barrier-related gene expression, and cardiac inflammasome-related transcription. Future studies incorporating broader microbiome profiling, SCFA quantification, intestinal permeability assays, and protein-level or histological validation will be required to test proposed mechanisms and establish causality. Additional intervention studies using fecal microbiota transplantation, A. muciniphila supplementation, or NLRP3 inhibition would be required to determine whether the observed associations reflect causal pathways.
Disclosures
The authors declare no competing financial interests or personal relationships that could have appeared to influence the work reported in this paper. No AI tools were used in the preparation of this manuscript or figures.
AUTHOR CONTRIBUTIONS:
H.H. and G.Z. conceived and designed the study. H.H., G.Z., and Y.X. performed the animal experiments and sample collection. H.H. and G.Z. conducted the molecular biology experiments and acquired the data. H.H. and Y.X. performed the statistical analysis. H.H. drafted the manuscript. H.W. critically revised the manuscript for important intellectual content. All authors read and approved the final manuscript
Acknowledgements
This research did not receive any specific grant from funding agencies in the public, commercial, or not-for-profit sectors.
Materials
| Name | Company | Catalog Number | Comments |
|---|---|---|---|
| Accu-Chek Glucometer and test strips | Roche | Accu-Chek Active | Used for fasting blood glucose measurement |
| Automatic biochemical analyzer | Hitachi | 7180 | Used for serum biochemical measurements |
| C57BL/6J mice (male, 8 weeks) | Beijing Vital River Laboratory Animal Technology Co., Ltd. | SCXK (Beijing) 2021-0006 | Experimental animals used to establish the diabetic mouse model |
| Citrate buffer (0.1 mol/L, pH 4.5) | Sigma-Aldrich | C8532 | Used for preparation of streptozotocin solution |
| Enzyme-linked immunosorbent assay (ELISA) kit for mouse insulin | Wuhan HuaMei Biotech | CSB-E05070m | Used for measurement of serum insulin |
| High-fat diet (60% kcal from fat) | Research Diets | D12492 | Used for induction and maintenance of the diabetic model |
| Isoflurane | RWD Life Science | R510-22-10 | Used for inhalation anesthesia |
| Microcentrifuge | Eppendorf | 5424 R | Used for sample centrifugation |
| NanoDrop 2000 spectrophotometer | Thermo Fisher Scientific | ND-2000 | Used to assess RNA concentration and purity |
| Paraformaldehyde (4%, in PBS) | Servicebio | G1101 | Used for fixation of tissue samples |
| Phosphate-buffered saline (PBS) | Servicebio | G0002 | Used for washing and flushing tissue samples |
| Power SYBR Green PCR Master Mix | Applied Biosystems (Thermo Fisher) | 4367659 | Used for real-time quantitative PCR |
| PrimeScript RT Reagent Kit (for qPCR) | TaKaRa (Takara Bio) | RR037A | Used for reverse transcription of RNA to cDNA |
| QIAamp Fast DNA Stool Mini Kit | Qiagen | 51604 | Used for extraction of microbial DNA from fecal samples |
| R Software | R Foundation | 4.2.0 | Used for statistical analysis |
| Real-time PCR system (StepOnePlus) | Applied Biosystems (Thermo Fisher) | StepOnePlus | Used for real-time quantitative PCR amplification and detection |
| Streptozotocin (STZ) | Sigma-Aldrich | S0130 | Used with a high-fat diet to induce the diabetic mouse model |
| Total Cholesterol (TC) Assay Kit | Nanjing Jiancheng Bioengineering Institute | A111-1 | Used for measurement of serum total cholesterol |
| Treadmill (motorized, with inclination control) | Zhongshi Dichuang (Beijing) | ZS-PT-1 | Used for the treadmill exercise intervention |
| Triglyceride (TG) Assay Kit | Nanjing Jiancheng Bioengineering Institute | A110-1 | Used for measurement of serum triglycerides |
| TRIzol Reagent | Invitrogen (Thermo Fisher) | 15596018 | Used for total RNA extraction from tissue samples |
References
- Lu Y, et al. Vascular complications of diabetes: A narrative review. Medicine. 2023;102(40):e35285.
- Nakamura K, et al. Pathophysiology and treatment of diabetic cardiomyopathy and heart failure in patients with diabetes mellitus. International Journal of Molecular Sciences. 2022;23(7):3587.
- Abdullah AR, et al. A comprehensive review on diabetic cardiomyopathy (DCM): histological spectrum, diagnosis, pathogenesis, and management with conventional treatments and natural compounds. Naunyn-Schmiedeberg's Archives of Pharmacology. 2025;398(8):9929-9969.
- Hassooni FRH, et al. Advances in diabetic cardiomyopathy: current and potential management strategies and emerging biomarkers. Annals of Medicine and Surgery. 2025;87(1):224-233.
- Zhong L, et al. Exercise and dietary interventions in the management of diabetic cardiomyopathy: mechanisms and implications. Cardiovascular Diabetology. 2025;24(1):159.
- Ma X, et al. Beneficial effects of different types of exercise on diabetic cardiomyopathy. Biomolecules. 2025;15(9):1223.
- Liu Y, et al. Decoding the gut microbiota-immune dialogue: from bidirectional axis to therapeutic applications. Journal of Nanobiotechnology. 2026;24(1):469.
- Du L, et al. Lipopolysaccharides derived from gram-negative bacterial pool of human gut microbiota promote inflammation and obesity development. International Reviews of Immunology. 2022;41(1):45-56.
- Alhamar G, et al. Toll like receptor 4: A potential link between obesity and metabolic diseases. Obesity Reviews. 2026;16:e70107.
- Wu R, et al. Desulfovibrio vulgaris exacerbates sepsis by inducing inflammation and oxidative stress in multiple organs. Frontiers in Microbiology. 2025;16:1574998.
- Mohammadi K, Zhang D, Saris EJ. Strain-specific effects of Desulfovibrio on neurodegeneration and oxidative stress in a Caenorhabditis elegans PD model. npj Parkinson's Disease. 2025;11(1):236.
- Abbate A, et al. Interleukin-1 and the inflammasome as therapeutic targets in cardiovascular disease. Circulation Research. 2020;126(9):1260-1280.
- Chauhan R, et al. Decoding the gut microbiota-mitochondrial-inflammasome axis in cardiovascular disease. Molecular and Cellular Biochemistry. 2026;481(3):1081-1101.
- Yu C, et al. Exercise remodels Akkermansia-associated eicosanoid metabolism to alleviate intestinal senescence: Multi-omics insights. Microorganisms. 2025;13(6):1379.
- Zhang Y, et al. Enhancing intestinal barrier efficiency: A novel metabolic diseases therapy. Frontiers in Nutrition. 2023;10:1120168.
- Evangelista I, et al. Molecular dysfunction and phenotypic derangement in diabetic cardiomyopathy. International Journal of Molecular Sciences. 2019;20(13):3264.
- Parim B, et al. Diabetic cardiomyopathy: molecular mechanisms, detrimental effects of conventional treatment, and beneficial effects of natural therapy. Heart Failure Reviews. 2019;24(2):279-299.
- Liu J, et al. The combination of exercise and metformin inhibits TGF-β1/Smad pathway to attenuate myocardial fibrosis in db/db mice by reducing NF-κB-mediated inflammatory response. Biomedicine & Pharmacotherapy. 2023;157:114080.
- Zhang X, et al. Exercise improves heart function after myocardial infarction: the merits of AMPK. Cardiovascular Drugs and Therapy. 2025;39(5):1153-1161.
- Berezin A. Metabolic memory phenomenon in diabetes mellitus: achieving and perspectives. Diabetes & Metabolic Syndrome: Clinical Research & Reviews. 2016;10(2):S176-S183.
- Date S, Bhatt LK. Exploring thioredoxin-interacting protein (TXNIP) as a therapeutic target for cardiovascular diseases. Archiv der Pharmazie. 2025;358(8):e70082.
- Zhang L, et al. NLRP3 inflammasome/pyroptosis: a key driving force in diabetic cardiomyopathy. International Journal of Molecular Sciences. 2022;23(18):10632.
- Tilg H, et al. The intestinal microbiota fuelling metabolic inflammation. Nature Reviews Immunology. 2020;20(1):40-54.
- Huang P, et al. TREM2 deficiency aggravates NLRP3 inflammasome activation and pyroptosis in MPTP-induced Parkinson's disease mice and LPS-induced BV2 cells. Molecular Neurobiology. 2024;61(5):2590-2605.
- Li T, et al. Six weeks of moderate-intensity treadmill exercise improves intestinal barrier and intestinal inflammation in Parkinson's disease mice. Molecular Neurobiology. 2025;62(8):10779-10791.
- He XQ, et al. Prevention of ulcerative colitis in mice by sweet tea (Lithocarpus litseifolius) via the regulation of gut microbiota and butyric-acid-mediated anti-inflammatory signaling. Nutrients. 2022;14(11):2208.
- Wang J, et al. Microbial short chain fatty acids: Effective histone deacetylase inhibitors in immune regulation. International Journal of Molecular Medicine. 2025;57(1):16.
- Deng F, et al. Intestinal ischemia/reperfusion injury: mechanisms, diagnosis, and therapeutic advances. International Journal of Biological Sciences. 2026;22(8):4059.
- Mo C, et al. The influence of Akkermansia muciniphila on intestinal barrier function. Gut Pathogens. 2024;16(1):41.
- Di Vincenzo F, et al. Gut microbiota, intestinal permeability, and systemic inflammation: a narrative review. Internal and Emergency Medicine. 2024;19(2):275-293.
- Birg A, Lin HC. The role of bacteria-derived hydrogen sulfide in multiple axes of disease. International Journal of Molecular Sciences. 2025;26(7):3340.
- Macchione IG, et al. Akkermansia muciniphila: key player in metabolic and gastrointestinal disorders. European Review for Medical and Pharmacological Sciences. 2019;23(18):8075-8083.
- Song S, et al. Sirtuin 3 deficiency exacerbates diabetic cardiomyopathy via necroptosis enhancement and NLRP3 activation. Acta Pharmacologica Sinica. 2021;42(2):230-241.