This study evaluates additional functional exercise training alongside conventional rehabilitation after arthroscopic meniscus repair. The strongest evidence supported improved postoperative range of motion, while findings for knee function, pain-related measures, and proprioception require cautious interpretation because of retrospective trial registration and multiple secondary outcomes.
Research Article
Additional Functional Exercise Training Improves Knee Recovery After Meniscus Repair: A Randomized Controlled Trial
In This Article
Summary
Abstract
This study evaluated whether adding functional exercise training (FET) to conventional rehabilitation improves postoperative knee recovery after meniscus repair. In this prospective randomized controlled trial, 96 patients who underwent meniscus repair between April 2023 and September 2024 were randomly assigned to conventional rehabilitation (CON; n = 48) or conventional rehabilitation plus FET (n = 48) using a computer-generated randomization sequence. All participants completed the 6-month follow-up and were included in the intention-to-treat analysis. Outcomes assessed at baseline, 1 month, and 6 months included the Lysholm rating scale (LRS), International Knee Documentation Committee (IKDC) score, visual analog scale (VAS) pain score, range of motion (ROM), prostaglandin E2 (PGE2), 5-hydroxytryptamine (5-HT), passive 60° position sense, and 60° motion sense; postoperative complications within 1 month were also recorded. At 6 months, ROM was greater with FET than with CON (134.36° ± 3.04° vs. 127.62° ± 3.66°; mean difference, 6.74°; 95% confidence interval [CI], 5.37–8.10; adjusted P < 0.001). After Holm–Bonferroni adjustment for multiple secondary comparisons, IKDC scores were higher with FET at 1 and 6 months, LRS scores were higher at 1 month, and VAS scores were lower at both follow-up assessments. PGE2 and 5-HT levels and passive 60° position-sense error and 60° motion-sense values were lower with FET at 1 month. Differences in ROM at 1 month and passive 60° position sense at 6 months did not remain statistically significant after multiplicity adjustment. No significant between-group differences were observed at 6 months for LRS, PGE2, 5-HT, or 60° motion sense, and postoperative complication rates did not differ significantly between groups. Adding FET to conventional rehabilitation may improve postoperative recovery after meniscus repair, with the strongest evidence supporting improved ROM. Findings for secondary outcomes require cautious interpretation and further validation, particularly given the retrospective trial registration and multiplicity of secondary outcomes.
Introduction
Meniscal injuries are prevalent orthopedic conditions in clinical practice1, primarily affecting athletes, manual laborers, and older adults. As a critical structure of the knee joint, the meniscus plays essential roles in maintaining joint stability, distributing load, absorbing shock, and lubricating the joint2,3. However, meniscal injuries caused by acute trauma or degenerative changes, if not treated promptly or managed appropriately, can lead to cartilage degeneration, early-onset osteoarthritis4, and functional deficits5. Therefore, for patients with symptomatic meniscal injuries that are unresponsive to conservative management, surgical interventions, including arthroscopic partial meniscectomy6 or meniscus repair7,8, may be indicated. Nevertheless, optimizing postoperative knee recovery remains a significant challenge in orthopedics9.
Postoperative knee recovery depends on the severity of the injury10, surgical technique, patient adherence to rehabilitation, and the effectiveness of rehabilitation training. Functional exercise training (FET), also known as neuromuscular training11, is increasingly used in postsurgical rehabilitation. This systematic training, comprising balance, strength, agility, coordination, and endurance exercises, provides multidimensional functional training and helps restore knee function12. Existing studies have shown that early and systematic rehabilitation training can improve surgical outcomes, reduce complications, and enhance patients' quality of life13,14. However, considerable variation in the timing, intensity, and specific methods of training has resulted in a lack of standardized guidelines for FET.
For patients with meniscal injuries, common postoperative complications, such as joint stiffness, muscle atrophy, and reactive synovitis, can adversely affect functional recovery15. Inadequate or delayed rehabilitation may lead to long-term functional limitations, including persistent pain, restricted knee mobility, and reduced physical activity. FET incorporates weight-bearing and non-weight-bearing exercises and may promote soft tissue healing and enhance neuromuscular control, thereby reducing the risk of reinjury16. Despite these potential benefits, systematic evidence evaluating the additional effect of structured FET when added to conventional rehabilitation after meniscus repair remains limited.
This study aimed to investigate whether adding FET to conventional rehabilitation provides additional benefits for postoperative knee recovery after meniscus repair. The novelty of the present study lies in evaluating the incremental effect of a structured FET program in addition to conventional rehabilitation, rather than comparing FET alone with conventional rehabilitation, with particular emphasis on knee range of motion, functional outcomes, pain, and proprioception. We hypothesized that adding FET to conventional rehabilitation would result in greater improvement in postoperative knee range of motion and related functional outcomes than conventional rehabilitation alone.
Protocol
This prospective randomized controlled trial was conducted in accordance with institutional guidelines for research involving human participants and the principles of the Declaration of Helsinki. The study protocol was approved by the Ethics Committee of Lanzhou Anning District People's Hospital (approval No. 20220927), and the trial was retrospectively registered on ClinicalTrials.gov on March 25, 2025 (NCT06894706). Written informed consent was obtained from each participant before enrollment. The overall study workflow consisted of participant screening, arthroscopic meniscus repair, 1:1 group allocation, postoperative rehabilitation, and outcome assessments at baseline, 1 month, and 6 months. The study flow is summarized in Figure 1.
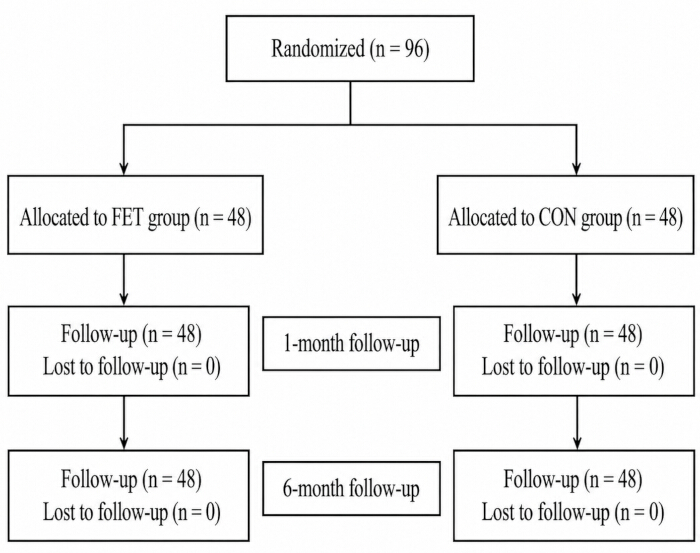
Figure 1. Flow diagram of participant randomization, allocation, and follow-up. A total of 96 participants were randomized in a 1:1 ratio to the functional exercise training (FET) group (n = 48) or conventional rehabilitation (CON) group (n = 48). All participants completed the 1-month and 6-month follow-up assessments, with no loss to follow-up. Please click here to view a larger version of this figure.
Study design, participant eligibility, and baseline characterization
The study was conducted as a prospective randomized controlled trial at Lanzhou Anning District People's Hospital from April 2023 to September 2024. A total of 96 eligible patients were enrolled and randomly assigned in a 1:1 ratio to the control (CON) group (n = 48) or the functional exercise training (FET) group (n = 48). All 96 randomized participants completed the scheduled follow-up assessments, with no withdrawals or losses to follow-up, and all were included in the final analysis. Meniscal injury was confirmed by magnetic resonance imaging, and all participants underwent arthroscopic meniscus repair. Patients with concomitant fracture or joint dislocation, severe osteoarthritis or rheumatoid arthritis, metabolic disease, coagulation disorder, or severe organic disease were excluded. The same eligibility and follow-up criteria were applied to both groups. Before intervention, trained research staff recorded baseline variables for between-group comparability, including age, gender, body mass index, disease duration, injured knee side, smoking history, meniscal tear location (medial or lateral), tear type (degenerative or traumatic), tear pattern, presence or absence of chondral lesions, and baseline values for all clinical and laboratory outcomes. The same case-reporting approach was used for both groups, and baseline data collection was completed before postoperative rehabilitation began.
Randomization, allocation concealment, and outcome assessment blinding
Eligible participants were randomly assigned to the FET or CON group in a 1:1 ratio using a computer-generated random sequence generated by an independent statistician who was not involved in participant recruitment, intervention delivery, or outcome assessment. Allocation concealment was achieved using sequentially numbered, opaque, sealed envelopes. The envelopes were prepared by an independent researcher and opened only after participant enrollment and completion of baseline assessment. Due to the nature of the exercise intervention, blinding of participants and rehabilitation therapists was not feasible. Although the retrospectively registered ClinicalTrials.gov record listed the study as single-masked with participants masked, participant blinding was not implemented in the actual conduct of the trial because the assigned exercise program was identifiable. Rehabilitation therapists were also not blinded. Outcome assessors and data analysts were blinded to treatment assignment. This discrepancy between the retrospective registry entry and the actual masking procedures is reported here for transparency.
Conventional postoperative rehabilitation (control intervention)
Arthroscopic meniscus repair was performed in all participants. Both groups received the same conventional postoperative rehabilitation program according to the institutional rehabilitation protocol. During the first 6 postoperative weeks, the repaired meniscus was protected by limiting knee flexion to less than 90° and maintaining partial weight bearing at approximately 20%–30% of body weight with crutches. The conventional rehabilitation program included active knee flexion and extension exercises within the permitted range of motion, ankle pump exercises, isometric quadriceps contractions, straight-leg raising exercises, and progressive gait training. Rehabilitation was initiated on the first postoperative day under the supervision of a trained physical therapist. Exercises were performed daily, with each session lasting approximately 30 min. Exercise intensity and progression were adjusted according to postoperative pain, swelling, knee mobility, and muscle activation status. During postoperative weeks 0–6, supervised rehabilitation sessions were conducted by trained physical therapists 2–3 times per week. Patients gradually progressed from pain-free range-of-motion exercises and quadriceps activation training to partial weight-bearing activities and gait training while maintaining the prescribed protection limits. Exercise progression was adjusted according to postoperative pain, swelling, knee range of motion, and quadriceps activation. After 6 weeks, progressive strengthening and functional activities were introduced according to individual recovery status.
Additional functional exercise training intervention
For the FET group, the same conventional rehabilitation program used in the CON group was provided, with an additional structured functional exercise training program focused on neuromuscular control. Before the first FET session, standardized rehabilitation education was provided using on-site demonstrations, printed instructions, and instructional videos. FET was initiated 6 h after surgery and was performed three times per week for 6 weeks, with each supervised session lasting approximately 30–40 min. During the first 6 postoperative weeks, knee flexion was maintained below 90°, and effective loading of the operated lower limb was maintained at approximately 20%–30% of body weight. For exercises performed on the anti-gravity treadmill, the level of body-weight support was adjusted accordingly to maintain this prescribed partial weight-bearing range.
During Phase 1 (postoperative week 0–1), participants performed straight-leg raises, recumbent lateral leg abduction, and prone leg raises, with 2–3 sets of 10–15 repetitions for each exercise and approximately 60 s of rest between sets. Exercise intensity was maintained at a pain-free or mildly uncomfortable level without increasing postoperative swelling. Electrotherapy was applied to the quadriceps and hamstring muscle groups for approximately 15–20 min per session. Progression to the next phase was permitted when participants could complete the prescribed exercises without increased pain or swelling and demonstrated adequate quadriceps activation.
During Phase 2 (postoperative weeks 2–4), balance-board training, static wall squats, and anti-gravity treadmill gait training were introduced. Balance training was performed for 2–3 sets of 30–60 s, while wall squats were performed for 2–3 sets of 10–15 repetitions, with approximately 60–90 s of rest between sets. Knee flexion during wall squats was maintained below 90°. Anti-gravity treadmill training was performed for approximately 10–15 min per session. Sufficient body-weight support was provided so that the effective weight borne by the operated lower limb remained approximately 20%–30% of body weight. Training duration and gait intensity were gradually progressed according to pain, swelling, gait stability, and exercise tolerance.
During Phase 3 (postoperative weeks 4–6), anti-gravity treadmill training was progressed to approximately 15–20 min per session while sufficient body-weight support was maintained to keep effective weight bearing within approximately 20%–30% of body weight. Speed-oriented gait training and assisted jogging were gradually introduced as tolerated under these unloading conditions. Low-impact, assisted small-jump tasks, step-flexibility exercises, and cycling were introduced only when they could be performed without increasing pain or swelling and while maintaining the prescribed knee-flexion and partial weight-bearing restrictions. These exercises were generally performed in 2–3 sets of 10–15 repetitions or for 10–15 min, depending on the exercise type, with 60–90 s of rest between sets. Progression was based on the absence of increased pain or swelling, maintenance of knee flexion within the prescribed range, stable gait and balance, and the ability to complete the previous training level with correct movement control.
All FET sessions were supervised by trained rehabilitation therapists. Approximately 85% of supervised sessions were conducted between 8:00 and 11:00 AM, with afternoon sessions used only when needed for individual scheduling. Adherence to the rehabilitation program was monitored using therapist-maintained attendance and training records. Poor compliance was defined as completion of less than 80% of the scheduled supervised rehabilitation sessions. No participant met the criteria for post-randomization exclusion, and all randomized participants were included in the intention-to-treat analysis.
Outcome assessment schedule
Outcome assessments were performed at three time points: baseline before the postoperative intervention, 1 month after surgery, and 6 months after surgery. The 1-month assessment characterized early recovery, whereas the 6-month assessment characterized longer-term functional recovery. According to the retrospectively registered ClinicalTrials.gov record, demographic data comparison was listed as the primary outcome, whereas the Lysholm Knee Scoring Scale (LRS), International Knee Documentation Committee (IKDC) subjective score, knee range of motion (ROM), visual analog scale (VAS) pain score, serum prostaglandin E2 (PGE2) and serotonin (5-HT) levels, proprioceptive measurements, and postoperative complications were listed as secondary outcomes. Because the trial was registered retrospectively on March 25, 2025, these outcome classifications should not be interpreted as prospectively registered endpoints. Postoperative complications were recorded during the first postoperative month. Blinded outcome assessors performed all clinical outcome measurements using the same procedures at each scheduled time point.
Lysholm Knee Scoring Scale assessment
Knee function was assessed using the Lysholm Knee Scoring Scale (LRS)17. The scale was administered at baseline, 1 month, and 6 months. The instrument was scored from 0 to 100, with higher values indicating better knee function. The total score was used as the analysis variable for longitudinal comparisons between the FET and CON groups.
International Knee Documentation Committee score and knee range of motion
Self-reported knee symptoms and function were assessed using the International Knee Documentation Committee (IKDC) Subjective Knee Evaluation Form18. The form was administered at baseline, 1 month, and 6 months. The total IKDC score was calculated on a 0–100 scale, with higher scores indicating better knee function and fewer symptoms. Passive knee ROM was measured with a digital goniometer using a standardized supine position19. The goniometer axis was aligned with the lateral femoral epicondyle, the fixed arm was aligned toward the greater trochanter, and the moving arm was aligned toward the lateral malleolus. Passive knee flexion and extension were measured at baseline, 1 month, and 6 months using the same positioning and anatomical landmarks at each assessment. The resulting ROM value was recorded in degrees for analysis.
Visual analog scale and serum pain biomarkers
Pain was assessed using a 0–10 visual analog scale (VAS)20. A score of 0 indicated no pain, scores of 1–3 indicated mild pain, scores of 4–6 indicated moderate pain, and scores of 7–10 indicated severe pain. The VAS score was recorded at baseline, 1 month, and 6 months using the same instructions for both groups. PGE2 and 5-HT were selected as exploratory pain-related biomarkers because they reflect complementary biochemical pathways associated with nociceptive and pain-related responses. These markers were intended to complement, rather than replace, the clinical assessment of pain using the VAS and were not considered comprehensive indicators of systemic inflammation. At each assessment time point, 4 mL of fasting venous blood was collected from the antecubital vein. The specimens were centrifuged at approximately 1,006 × g for 15 min. Serum was separated, and PGE2 and 5-HT were quantified using human-specific enzyme-linked immunosorbent assay (ELISA) kits listed in the Table of Materials. The assays were performed according to the corresponding kit instructions, and the measured serum concentrations were used for the between-group and longitudinal analyses.
Passive 60° position sense and 60° motion sense
Passive 60° position sense was assessed with the participant seated and with visual and auditory cues minimized using an eye mask and headphones. A knee-flexion angle of 60° was used as the target position. The knee was passively positioned toward the target, and participants were instructed to indicate when they perceived that the target angle had been reached. The measured angle and angular error relative to the 60° target were recorded. The test was repeated three times at baseline, 1 month, and 6 months. Motion sense at 60° was assessed using a continuous passive motion device with an integrated motion sensor. The knee was moved passively at a constant speed of 1°/s through an arc from 0° to 60° of flexion and extension. Participants were instructed to stop the motion when movement or a change in joint position was first perceived. The procedure was repeated three times, and the angle at which movement was perceived was recorded for each trial. The same settings, seating arrangement, sensory-restriction conditions, and number of trials were applied at each assessment. The recorded position-sense error and motion-perception angle were used as the respective outcomes, consistent with the reported comparisons at 1 and 6 months.
Sample-size estimation and statistical analysis
The sample-size calculation was based on the anticipated between-group difference in knee ROM at the 6-month assessment. Because directly applicable variance estimates from randomized studies of postoperative rehabilitation after isolated meniscus repair were limited, the variance assumption was informed by published postoperative knee ROM data from a related surgical population21. A between-group difference of 10° was considered clinically relevant, with an assumed common standard deviation of 15°, a two-sided α of 0.05, 80% power, and a 1:1 allocation ratio. The resulting minimum sample size was approximately 36 participants per group. We enrolled 48 participants per group, exceeding the calculated minimum sample size. Before inferential analysis, the distribution of continuous variables was assessed using the Shapiro–Wilk test, and homogeneity of variance was assessed using Levene's test. Normally distributed continuous data were expressed as mean ± standard deviation. For between-group comparisons at a single time point, an independent-samples t-test was used when the assumptions for parametric testing were satisfied. Between-group effect estimates for continuous outcomes were expressed as mean differences (FET minus CON) with two-sided 95% confidence intervals (CIs). The reported 95% CIs were not adjusted for multiplicity; statistical significance for secondary efficacy outcomes was determined on the basis of Holm–Bonferroni-adjusted P values. For outcomes measured repeatedly at baseline, 1 month, and 6 months, a two-way repeated-measures analysis of variance was used to evaluate the effects of group, time, and the group-by-time interaction. According to the retrospectively registered ClinicalTrials.gov record, the clinical efficacy outcomes, including LRS, IKDC, ROM, VAS, PGE2, 5-HT, proprioceptive measures, and postoperative complications, were classified as secondary outcomes. To account for multiplicity across the secondary efficacy outcomes, P values for between-group comparisons were adjusted using the Holm–Bonferroni procedure. For longitudinal analyses, two-way repeated-measures ANOVA was used to evaluate group, time, and group-by-time interaction effects. When a significant omnibus effect was identified, Bonferroni-adjusted post hoc comparisons were performed for pairwise comparisons across time points. Both unadjusted and multiplicity-adjusted P values were reported where appropriate, with statistical significance for secondary efficacy outcomes determined on the basis of the adjusted P values. Categorical variables were expressed as number and percentage, and groups were compared using the chi-square test or Fisher's exact test, as appropriate. A two-sided significance threshold of P < 0.05 was applied. All analyses were performed using the statistical software specified in the Table of Materials, with group labels masked to the analyst until the planned analyses were completed. All analyses were conducted according to the intention-to-treat principle. Because all randomized participants completed the scheduled follow-up and no protocol deviations leading to exclusion occurred, the intention-to-treat population was identical to the final analyzed population. The deidentified participant-level dataset used for the analyses is provided as Supplementary File 1.
Results
Demographic data comparison
A total of 96 patients were randomized, with 48 participants allocated to the CON group and 48 participants allocated to the FET group. No participants withdrew or were lost to follow-up during the study period, and all 96 participants completed the scheduled assessments and were included in the final analysis (Figure 1). There were no significant differences between the groups in baseline characteristics, including age, gender, BMI, disease duration, injured knee side, and smoking history (all P > 0.05). The distributions of meniscal tear location, tear type, tear pattern, and chondral lesions were also similar between groups. Baseline LRS, IKDC, ROM, VAS, PGE2, and 5-HT values showed no significant between-group differences, indicating comparability before the intervention (Table 1).
| Variable | Category | CON group (n = 48) | FET group (n = 48) | t/χ² | P |
| Gender | Male | 27 (56.25%) | 29 (60.42%) | 0.171 | 0.679 |
| Female | 21 (43.75%) | 19 (39.58%) | |||
| Age (years) | — | 45.12 ± 11.68 | 44.02 ± 10.35 | 0.491 | 0.624 |
| BMI (kg/m²) | — | 24.85 ± 2.16 | 24.76 ± 2.09 | 0.203 | 0.839 |
| Disease duration (months) | — | 3.33 ± 1.30 | 3.78 ± 1.46 | −1.609 | 0.111 |
| Injured knee | Left | 23 (47.92%) | 18 (37.50%) | 1.064 | 0.302 |
| Right | 25 (52.08%) | 30 (62.50%) | |||
| History of smoking | No | 22 (45.83%) | 24 (50.00%) | 0.167 | 0.683 |
| Yes | 26 (54.17%) | 24 (50.00%) | |||
| Meniscal tear location | Medial | 32 (66.67%) | 30 (62.50%) | 0.182 | 0.67 |
| Lateral | 16 (33.33%) | 18 (37.50%) | |||
| Tear type | Degenerative | 31 (64.58%) | 33 (68.75%) | 0.188 | 0.665 |
| Traumatic | 17 (35.42%) | 15 (31.25%) | |||
| Tear pattern | Longitudinal | 19 (39.58%) | 20 (41.67%) | 0.188 | 0.979 |
| Radial | 12 (25.00%) | 11 (22.92%) | |||
| Bucket-handle | 8 (16.67%) | 7 (14.58%) | |||
| Complex | 9 (18.75%) | 10 (20.83%) | |||
| Chondral lesion (I–II) | — | 6 (12.50%) | 7 (14.58%) | 0.089 | 0.765 |
| LRS | — | 61.33 ± 3.28 | 61.22 ± 3.41 | 0.159 | 0.874 |
| IKDC | — | 55.97 ± 3.97 | 55.47 ± 3.85 | 0.631 | 0.53 |
| ROM (°) | — | 97.58 ± 8.19 | 96.45 ± 9.71 | 0.618 | 0.538 |
| VAS | — | 5.31 ± 0.95 | 5.03 ± 0.97 | 1.426 | 0.157 |
| PGE2 | — | 240.76 ± 24.66 | 236.48 ± 21.67 | 0.904 | 0.368 |
| 5-HT | — | 3.98 ± 0.46 | 3.87 ± 0.53 | 1.094 | 0.277 |
Table 1: Baseline demographic and clinical characteristics of the conventional rehabilitation and functional exercise training groups. Continuous variables are presented as mean ± standard deviation (SD), and categorical variables are presented as n (%). Between-group comparisons of continuous variables were performed using independent-samples t-tests, and categorical variables were compared using the chi-square test, as appropriate. CON, conventional rehabilitation group; FET, functional exercise training group; BMI, body mass index; LRS, Lysholm Knee Scoring Scale; IKDC, International Knee Documentation Committee; ROM, range of motion; VAS, visual analog scale; PGE2, prostaglandin E2; 5-HT, serotonin.
Comparison of LRS scores
Baseline LRS scores were comparable between the two groups. At 1 month, the LRS score was higher in the FET group than in the CON group (85.04 ± 3.88 vs. 80.72 ± 3.81; mean difference, 4.31; 95% CI, 2.75–5.87), and this difference remained statistically significant after Holm–Bonferroni adjustment for multiple secondary comparisons (adjusted P < 0.001). At 6 months, LRS scores were similar between the FET and CON groups (94.15 ± 1.82 vs. 94.05 ± 1.55; mean difference, 0.08; 95% CI, −0.60–0.77), with no significant between-group difference after multiplicity adjustment. LRS scores increased significantly over time in both groups. Repeated-measures analysis showed significant time, group, and group-by-time interaction effects (time effect: F = 2836.201, P < 0.001; group effect: F = 14.880, P < 0.001; interaction effect: F = 15.887, P < 0.001) (Table 2; Figure 2).
| Group/Comparison | Baseline | 1 month | 6 months |
| CON group (n = 48) | 61.33 ± 3.28 | 80.72 ± 3.81a | 94.05 ± 1.55ab |
| FET group (n = 48) | 61.22 ± 3.41 | 85.04 ± 3.88Aa | 94.15 ± 1.82ab |
| Mean difference (95% CI) | −0.10 (−1.46, 1.25) | 4.31 (2.75, 5.87) | 0.08 (−0.60, 0.77) |
| Between-group effect | F = 14.880, P < 0.001 | — | — |
| Within-group effect | F = 2836.201, P < 0.001 | — | — |
| Group × time interaction | F = 15.887, P < 0.001 | — | — |
Table 2: Lysholm Knee Scoring Scale scores at baseline, 1 month, and 6 months. Data are presented as mean ± standard deviation (SD). Between-group mean differences were calculated as FET minus CON and are presented with two-sided 95% confidence intervals (CIs). The 95% CIs were not adjusted for multiplicity; statistical significance for secondary efficacy outcomes was determined on the basis of Holm–Bonferroni-adjusted P values. Uppercase A indicates a statistically significant between-group difference after Holm–Bonferroni adjustment (adjusted P < 0.05). Lowercase a indicates a statistically significant difference versus baseline, and lowercase b indicates a statistically significant difference versus 1 month after Bonferroni adjustment for within-outcome post hoc comparisons (adjusted P < 0.05). The between-group, within-group, and group × time interaction effects are from the repeated-measures analysis of variance. CON, conventional rehabilitation group; FET, functional exercise training group; LRS, Lysholm Knee Scoring Scale.
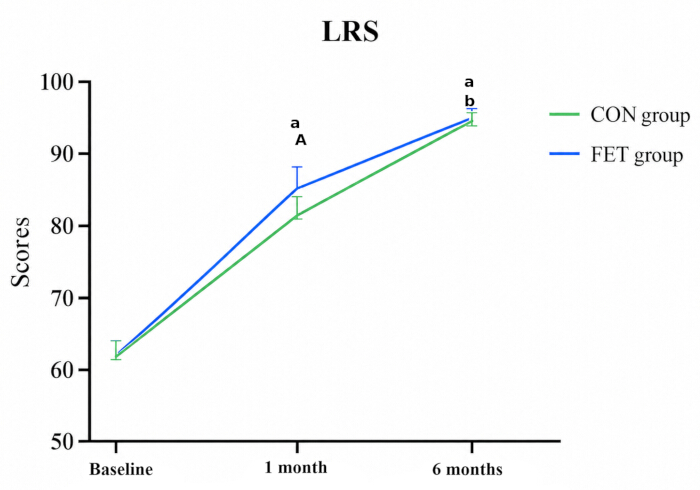
Figure 2. Changes in Lysholm Knee Scoring Scale scores over the intervention period in the two groups. Data are presented as mean ± standard deviation (SD), and error bars indicate SD. Uppercase A indicates a statistically significant between-group difference after Holm–Bonferroni adjustment (adjusted P < 0.05). Lowercase a indicates a statistically significant difference versus baseline, and lowercase b indicates a statistically significant difference versus 1 month after Bonferroni adjustment for within-outcome post hoc comparisons (adjusted P < 0.05). CON, conventional rehabilitation group; FET, functional exercise training group; LRS, Lysholm Knee Scoring Scale. Please click here to view a larger version of this figure.
Comparison of IKDC scores and ROM
Baseline IKDC scores and ROM were comparable between the two groups. At 1 month, the IKDC score was higher in the FET group than in the CON group (81.12 ± 3.41 vs. 75.01 ± 3.74; mean difference, 6.13; 95% CI, 4.67–7.58), and the difference remained significant after Holm–Bonferroni adjustment (adjusted P < 0.001). The between-group difference in IKDC score also remained significant at 6 months (91.60 ± 2.79 vs. 85.17 ± 2.98; mean difference, 6.44; 95% CI, 5.27–7.61; adjusted P < 0.001). For ROM, the FET group showed a higher value than the CON group at 1 month (116.32° ± 5.09° vs. 113.86° ± 6.01°; mean difference, 2.46°; 95% CI, 0.20–4.72); however, this difference did not remain statistically significant after Holm–Bonferroni adjustment (adjusted P = 0.165). At 6 months, ROM was greater in the FET group than in the CON group (134.36° ± 3.04° vs. 127.62° ± 3.66°; mean difference, 6.74°; 95% CI, 5.37–8.10; adjusted P < 0.001). Both IKDC scores and ROM improved over time in both groups. Repeated-measures analyses showed significant time, group, and group-by-time interaction effects for both outcomes (all P < 0.05) (Table 3; Figure 3A,B).
| Group/Comparison | IKDC: Baseline | IKDC: 1 month | IKDC: 6 months | ROM (°): Baseline | ROM (°): 1 month | ROM (°): 6 months |
| CON group (n = 48) | 55.97 ± 3.97 | 75.01 ± 3.74a | 85.17 ± 2.98ab | 97.58 ± 8.19 | 113.86 ± 6.01a | 127.62 ± 3.66ab |
| FET group (n = 48) | 55.47 ± 3.85 | 81.12 ± 3.41Aa | 91.60 ± 2.79Aab | 96.45 ± 9.71 | 116.32 ± 5.09a | 134.36 ± 3.04Aab |
| Mean difference (95% CI) | −0.50 (−2.08, 1.08) | 6.13 (4.67, 7.58) | 6.44 (5.27, 7.61) | −1.13 (−4.77, 2.51) | 2.46 (0.20, 4.72) | 6.74 (5.37, 8.10) |
| Between-group effect | F = 90.626, P < 0.001 | — | — | F = 11.152, P = 0.001 | — | — |
| Within-group effect | F = 2267.262, P < 0.001 | — | — | F = 726.287, P < 0.001 | — | — |
| Group × time interaction | F = 31.148, P < 0.001 | — | — | F = 9.762, P < 0.001 | — | — |
Table 3: International Knee Documentation Committee scores and knee range of motion at baseline, 1 month, and 6 months. Data are presented as mean ± standard deviation (SD). Between-group mean differences were calculated as FET minus CON and are presented with two-sided 95% confidence intervals (CIs). The 95% CIs were not adjusted for multiplicity; statistical significance for secondary efficacy outcomes was determined on the basis of Holm–Bonferroni-adjusted P values. Uppercase A indicates a statistically significant between-group difference after Holm–Bonferroni adjustment (adjusted P < 0.05). Lowercase a indicates a statistically significant difference versus baseline, and lowercase b indicates a statistically significant difference versus 1 month after Bonferroni adjustment for within-outcome post hoc comparisons (adjusted P < 0.05). The between-group, within-group, and group × time interaction effects are from the repeated-measures analysis of variance. CON, conventional rehabilitation group; FET, functional exercise training group; IKDC, International Knee Documentation Committee; ROM, range of motion.
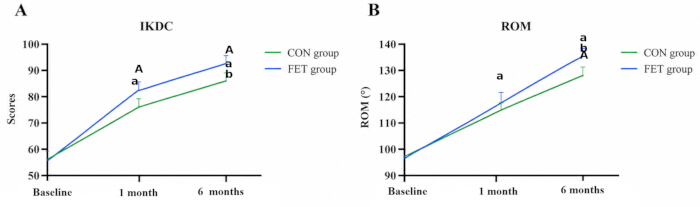
Figure 3. Changes in International Knee Documentation Committee scores and knee range of motion over the intervention period in the two groups. (A) Changes in International Knee Documentation Committee (IKDC) scores. (B) Changes in knee range of motion (ROM). Data are presented as mean ± standard deviation (SD), and error bars indicate SD. Uppercase A indicates a statistically significant between-group difference after Holm–Bonferroni adjustment (adjusted P < 0.05). Lowercase a indicates a statistically significant difference versus baseline, and lowercase b indicates a statistically significant difference versus 1 month after Bonferroni adjustment for within-outcome post hoc comparisons (adjusted P < 0.05). CON, conventional rehabilitation group; FET, functional exercise training group; IKDC, International Knee Documentation Committee; ROM, range of motion. Please click here to view a larger version of this figure.
Comparison of VAS scores and pain factor levels
Baseline VAS scores, PGE2 levels, and 5-HT levels were comparable between the two groups. At 1 month, the FET group had a lower VAS score than the CON group (2.22 ± 0.67 vs. 2.99 ± 0.79; mean difference, −0.77; 95% CI, −1.07 to −0.47), and this difference remained significant after Holm–Bonferroni adjustment (adjusted P < 0.001). The between-group difference in VAS score also remained statistically significant at 6 months (0.81 ± 0.41 vs. 1.12 ± 0.48; mean difference, −0.31; 95% CI, −0.49 to −0.13; adjusted P = 0.007) (Table 4; Figure 4A). At 1 month, PGE2 levels were lower in the FET group than in the CON group (162.64 ± 13.45 vs. 197.96 ± 16.48 pg/mL; mean difference, −35.32 pg/mL; 95% CI, −41.42 to −29.23), and 5-HT levels were also lower in the FET group (1.71 ± 0.22 vs. 2.00 ± 0.22 µmol/L; mean difference, −0.29 µmol/L; 95% CI, −0.38 to −0.20). Both differences remained significant after multiplicity adjustment (both adjusted P < 0.001). At 6 months, the between-group difference was 0.29 pg/mL for PGE2 (95% CI, −2.80–3.38) and 0.09 µmol/L for 5-HT (95% CI, −0.03–0.21), with neither difference remaining statistically significant after multiplicity adjustment. Both groups showed substantial reductions in PGE2 and 5-HT levels over time (Figure 4B,C).
| Group/Comparison | VAS: Baseline | VAS: 1 month | VAS: 6 months | PGE2 (pg/mL): Baseline | PGE2 (pg/mL): 1 month | PGE2 (pg/mL): 6 months | 5-HT (μmol/L): Baseline | 5-HT (μmol/L): 1 month | 5-HT (μmol/L): 6 months |
| CON group (n = 48) | 5.31 ± 0.95 | 2.99 ± 0.79a | 1.12 ± 0.48ab | 240.76 ± 24.66 | 197.96 ± 16.48a | 86.01 ± 8.04ab | 3.98 ± 0.46 | 2.00 ± 0.22a | 1.16 ± 0.26ab |
| FET group (n = 48) | 5.03 ± 0.97 | 2.22 ± 0.67Aa | 0.81 ± 0.41Aab | 236.48 ± 21.67 | 162.64 ± 13.45Aa | 86.30 ± 7.18ab | 3.87 ± 0.53 | 1.71 ± 0.22Aa | 1.25 ± 0.34ab |
| Mean difference (95% CI) | −0.28 (−0.67, 0.11) | −0.77 (−1.07, −0.47) | −0.31 (−0.49, −0.13) | −4.28 (−13.69, 5.13) | −35.32 (−41.42, −29.23) | 0.29 (−2.80, 3.38) | −0.11 (−0.31, 0.09) | −0.29 (−0.38, −0.20) | 0.09 (−0.03, 0.21) |
| Between-group effect | F = 16.053, P < 0.001 | — | — | F = 42.861, P < 0.001 | — | — | F = 5.646, P = 0.020 | — | — |
| Within-group effect | F = 828.336, P < 0.001 | — | — | F = 2124.955, P < 0.001 | — | — | F = 385.770, P < 0.001 | — | — |
| Group × time interaction | F = 5.512, P = 0.006 | — | — | F = 33.716, P < 0.001 | — | — | F = 5.690, P = 0.004 | — | — |
Table 4: Visual analog scale scores and serum PGE2 and 5-HT levels at baseline, 1 month, and 6 months. Data are presented as mean ± standard deviation (SD). Between-group mean differences were calculated as FET minus CON and are presented with two-sided 95% confidence intervals (CIs). The 95% CIs were not adjusted for multiplicity; statistical significance for secondary efficacy outcomes was determined on the basis of Holm–Bonferroni-adjusted P values. Uppercase A indicates a statistically significant between-group difference after Holm–Bonferroni adjustment (adjusted P < 0.05). Lowercase a indicates a statistically significant difference versus baseline, and lowercase b indicates a statistically significant difference versus 1 month after Bonferroni adjustment for within-outcome post hoc comparisons (adjusted P < 0.05). The between-group, within-group, and group × time interaction effects are from the repeated-measures analysis of variance. CON, conventional rehabilitation group; FET, functional exercise training group; VAS, visual analog scale; PGE2, prostaglandin E2; 5-HT, serotonin.
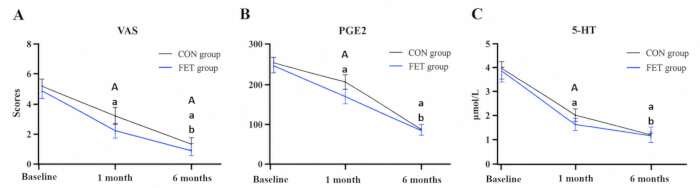
Figure 4. Changes in visual analog scale scores and serum prostaglandin E2 and serotonin levels over the intervention period in the two groups. (A) Changes in visual analog scale (VAS) scores. (B) Changes in serum prostaglandin E2 (PGE2) levels. (C) Changes in serum serotonin (5-HT) levels. Data are presented as mean ± standard deviation (SD), and error bars indicate SD. Uppercase A indicates a statistically significant between-group difference after Holm–Bonferroni adjustment (adjusted P < 0.05). Lowercase a indicates a statistically significant difference versus baseline, and lowercase b indicates a statistically significant difference versus 1 month after Bonferroni adjustment for within-outcome post hoc comparisons (adjusted P < 0.05). CON, conventional rehabilitation group; FET, functional exercise training group; VAS, visual analog scale; PGE2, prostaglandin E2; 5-HT, serotonin. Please click here to view a larger version of this figure.
Comparison of passive 60° position sense and 60° motion sense
At 1 month, the FET group showed a lower passive 60° position-sense error than the CON group (3.56° ± 0.55° vs. 4.04° ± 0.70°; mean difference, −0.48°; 95% CI, −0.74 to −0.23), and this difference remained statistically significant after Holm–Bonferroni adjustment (adjusted P = 0.003). At 6 months, the corresponding values were 2.30° ± 0.58° in the FET group and 2.56 ± 0.47° in the CON group (mean difference, −0.26°; 95% CI, −0.47 to −0.05). Although the unadjusted 95% CI excluded zero, the between-group difference did not remain statistically significant after multiplicity adjustment (adjusted P = 0.107) (Table 5; Figure 5A). For 60° motion sense, the FET group showed a lower value than the CON group at 1 month (0.37° ± 0.05° vs. 0.44° ± 0.05°; mean difference, −0.07°; 95% CI, −0.09 to −0.05), and this difference remained significant after Holm–Bonferroni adjustment (adjusted P < 0.001). At 6 months, no significant between-group difference was observed (0.31° ± 0.10° vs. 0.32° ± 0.11°; mean difference, −0.01°; 95% CI, −0.05–0.03). Both proprioceptive measures improved over time in both groups (Figure 5B).
| Group/Comparison | Passive 60° position-sense error: Baseline | Passive 60° position-sense error: 1 month | Passive 60° position-sense error: 6 months | 60° motion sense: Baseline | 60° motion sense: 1 month | 60° motion sense: 6 months |
| CON group (n = 48) | 5.78 ± 0.86 | 4.04 ± 0.70a | 2.56 ± 0.47ab | 0.61 ± 0.82 | 0.44 ± 0.05a | 0.32 ± 0.11ab |
| FET group (n = 48) | 5.85 ± 1.01 | 3.56 ± 0.55Aa | 2.30 ± 0.58ab | 0.60 ± 0.85 | 0.37 ± 0.05Aa | 0.31 ± 0.10ab |
| Mean difference (95% CI) | 0.07 (−0.31, 0.45) | −0.48 (−0.74, −0.23) | −0.26 (−0.47, −0.05) | −0.01 (−0.35, 0.33) | −0.07 (−0.09, −0.05) | −0.01 (−0.05, 0.03) |
| Between-group effect | F = 5.398, P = 0.022 | — | — | F = 9.935, P = 0.002 | — | — |
| Within-group effect | F = 633.738, P < 0.001 | — | — | F = 678.652, P < 0.001 | — | — |
| Group × time interaction | F = 4.205, P = 0.021 | — | — | F = 8.076, P = 0.001 | — | — |
Table 5. Passive 60° position-sense error and 60° motion-sense values at baseline, 1 month, and 6 months. Data are presented as mean ± standard deviation (SD). Between-group mean differences were calculated as FET minus CON and are presented with two-sided 95% confidence intervals (CIs). The 95% CIs were not adjusted for multiplicity; statistical significance for secondary efficacy outcomes was determined on the basis of Holm–Bonferroni-adjusted P values. Uppercase A indicates a statistically significant between-group difference after Holm–Bonferroni adjustment (adjusted P < 0.05). Lowercase a indicates a statistically significant difference versus baseline, and lowercase b indicates a statistically significant difference versus 1 month after Bonferroni adjustment for within-outcome post hoc comparisons (adjusted P < 0.05). The between-group, within-group, and group × time interaction effects are from the repeated-measures analysis of variance. CON, conventional rehabilitation group; FET, functional exercise training group.
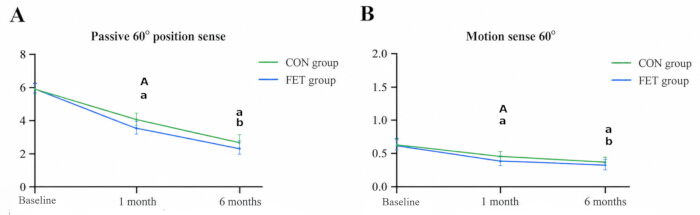
Figure 5. Changes in passive 60° position-sense error and 60° motion-sense values over the intervention period in the two groups. (A) Changes in passive 60° position-sense error. (B) Changes in 60° motion-sense values. Data are presented as mean ± standard deviation (SD), and error bars indicate SD. Uppercase A indicates a statistically significant between-group difference after Holm–Bonferroni adjustment (adjusted P < 0.05). Lowercase a indicates a statistically significant difference versus baseline, and lowercase b indicates a statistically significant difference versus 1 month after Bonferroni adjustment for within-outcome post hoc comparisons (adjusted P < 0.05). CON, conventional rehabilitation group; FET, functional exercise training group. Please click here to view a larger version of this figure.
Comparison of postoperative complications
During the first postoperative month, the CON group had one postoperative infection (2.08%), two cases of ankylosis (4.17%), no meniscus cysts, and one case of reactive synovitis (2.08%), resulting in a total complication rate of 8.33% (4/48). The FET group had one meniscus cyst (2.08%) and no postoperative infections, ankylosis, or reactive synovitis, resulting in a total complication rate of 2.08% (1/48). The between-group difference in the total complication rate was not statistically significant (P = 0.362) (Table 6).
| Group | Postoperative infection | Ankylosis | Meniscus cyst | Reactive synovitis | Total complications |
| CON group (n = 48) | 1 (2.08%) | 2 (4.17%) | 0 (0.00%) | 1 (2.08%) | 4 (8.33%) |
| FET group (n = 48) | 0 (0.00%) | 0 (0.00%) | 1 (2.08%) | 0 (0.00%) | 1 (2.08%) |
| P | — | — | — | — | 0.362 |
Table 6: Postoperative complications within 1 month in the conventional rehabilitation and functional exercise training groups. Data are presented as n (%). Postoperative complications included postoperative infection, ankylosis, meniscus cyst, and reactive synovitis. The total complication rate was 4/48 (8.33%) in the CON group and 1/48 (2.08%) in the FET group. The between-group comparison of the total complication rate was performed using Fisher's exact test or the chi-square test, as appropriate. CON, conventional rehabilitation group; FET, functional exercise training group.
The results indicate that adding FET to conventional postoperative rehabilitation was associated with greater improvement in several measures of knee recovery. The clearest longer-term between-group finding was greater ROM at 6 months, while IKDC scores were also higher in the FET group at both follow-up assessments. Differences in LRS, PGE2, 5-HT, and proprioceptive measures were primarily evident during early recovery and were not consistently maintained at 6 months after multiplicity adjustment. VAS scores remained lower in the FET group at both follow-up assessments. Postoperative complication rates did not differ significantly between groups. Overall, these findings support an additional postoperative recovery benefit of FET while indicating that the magnitude and persistence of the effect differed across outcomes.
Data Availability:
The de-identified participant-level data underlying the findings of this study, together with the accompanying data dictionary, are provided in Supplementary File 1. The completed CONSORT 2025 checklist is provided in Supplementary File 2.
Supplementary Files
Supplementary File 1. Participant-level dataset and data dictionary for the randomized controlled trial. The file contains de-identified participant-level data for the CON and FET groups, including treatment allocation, demographic and clinical characteristics, meniscal injury characteristics, LRS, IKDC, ROM, VAS, serum PGE2 and 5-HT levels, passive 60° position-sense error, 60° motion-sense values, and postoperative complications. Longitudinal outcomes are provided at baseline, 1 month, and 6 months, as applicable. The accompanying codebook defines each variable, measurement unit or coded value, and assessment time point. Please click here to download this file.
Supplementary File 2. Completed CONSORT 2025 checklist. The completed CONSORT 2025 checklist provides the manuscript page location corresponding to each applicable reporting item for this randomized controlled trial, including trial registration, protocol and statistical analysis plan, data sharing, trial design, randomization, blinding, statistical methods, participant flow, outcomes, harms, interpretation, and limitations. Please click here to download this file.
Discussion
The present study primarily aimed to evaluate whether adding FET to conventional rehabilitation could provide additional benefits for postoperative functional recovery after meniscus repair. During the 6-month follow-up of 96 patients, differences between the FET and CON groups were observed in ROM and several measures of knee function, pain, and proprioception. The FET group showed significantly higher LRS and IKDC scores than the CON group at 1 month, and these differences remained significant after adjustment for multiple secondary comparisons. At 6 months, LRS scores were nearly identical between the two groups, whereas the between-group difference in IKDC score remained statistically significant. ROM was also significantly greater in the FET group at 6 months after multiplicity adjustment. Although ROM was numerically higher in the FET group at 1 month, this difference did not remain significant after multiplicity adjustment. These findings suggest that additional FET may facilitate early functional recovery, while its more persistent effects were observed primarily in ROM and IKDC-assessed knee function. Nevertheless, these findings should be interpreted cautiously because multiple clinical efficacy outcomes were evaluated and the trial registration was retrospective. The LRS score is an important tool for assessing knee joint function, reflecting various aspects of function such as the severity of knee pain, activity ability, and ROM17. In this study, the LRS scores in the FET group exhibited notable improvement following the intervention, particularly at 1 month postoperatively, when the recovery was more pronounced. These findings are consistent with previous research by Barendrecht et al.22 and Huber23, which also highlighted the role of functional rehabilitation in expediting postoperative knee recovery. Compared with the CON group, the improvements observed in the FET group may be related to the strengthening and flexibility components of the additional exercise training, which were intended to strengthen musculature and improve joint stability and functional recovery. However, because the FET group received additional exercise exposure and therapeutic contact, these findings cannot establish that the observed benefits resulted exclusively from the FET modality.
The IKDC and ROM findings further suggest a potential benefit of adding FET to conventional rehabilitation. At 6 months postoperatively, IKDC scores and ROM were significantly greater in the FET group than in the CON group. The observed differences suggest that the FET-based rehabilitation program may contribute to postoperative functional recovery and may be related to the additional flexibility, strength, and neuromuscular training incorporated into the intervention. This finding is consistent with studies by Chen24 and Hammami25, who noted that FET can promote recovery of knee joint mobility and help alleviate knee stiffness and pain. These findings suggest that incorporating FET into conventional rehabilitation may further enhance knee joint flexibility and functionality. However, the FET group also received greater supervised therapeutic contact, structured rehabilitation education, demonstrations, and instructional materials. Therefore, the observed effects cannot be attributed exclusively to the exercise modality itself, and the specific contribution of FET-related components relative to increased overall exercise exposure and therapeutic contact requires further investigation.
Pain management is an important component of rehabilitation after meniscus repair. In the present study, VAS scores were significantly lower in the FET group than in the CON group at both 1 and 6 months, and both differences remained statistically significant after adjustment for multiple secondary comparisons. In contrast, the between-group differences in the pain-related biomarkers PGE2 and 5-HT were evident at 1 month but were no longer significant at 6 months. These findings suggest that the potential effect of additional FET on biochemical pain-related markers may be more pronounced during early recovery, whereas the difference in patient-reported pain persisted at the 6-month assessment. Nevertheless, VAS, PGE2, and 5-HT were secondary outcomes, and these findings should be interpreted cautiously. PGE2 and 5-HT were included as exploratory pain-related biochemical measures rather than as a comprehensive assessment of postoperative inflammation. Therefore, changes in these markers should not be interpreted as evidence of a generalized anti-inflammatory effect. Prior studies have indicated that neuromuscular training facilitates soft-tissue recovery and may contribute to pain alleviation16,26,27. Postoperative pain relief is multifactorial and may also be influenced by individual pain perception, rehabilitation exposure, and surgical characteristics.
Passive 60° position-sense error and 60° motion-sense values decreased from baseline by 1 month in both groups, with greater early improvement observed in the FET group. The relatively early reduction in position-sense error is clinically noteworthy because proprioceptive performance during postoperative recovery may be influenced by pain, swelling, and other transient postoperative factors. One possible explanation is that, by the 1-month assessment, participants had already completed several weeks of structured rehabilitation and were beyond the immediate postoperative phase, allowing partial recovery of sensory and neuromuscular function. However, because postoperative swelling and related factors were not specifically quantified in relation to proprioceptive testing, and repeated assessment may also introduce a degree of test familiarity, this early improvement should be interpreted cautiously. The between-group difference at 1 month suggests that additional FET may facilitate earlier proprioceptive recovery, although the absence of a significant between-group difference at 6 months after multiplicity adjustment does not support a persistent proprioceptive advantage. Proprioceptive recovery is important for joint awareness and neuromuscular control and may contribute to postoperative knee stability. Ghaderi et al.28 found that neuromuscular training improves knee proprioception in athletes with a history of anterior cruciate ligament reconstruction. These results are consistent with prior research29, which has highlighted the importance of neuromuscular training in the rehabilitation of knee injuries, particularly in restoring joint stability and sensory perception. Future studies should explore the underlying mechanisms by which FET improves proprioceptive function and investigate the long-term effects of such training on knee joint performance.
Several limitations of this study should be noted. First, the research was conducted at a single medical institution with a total of 96 patients, which may limit the generalizability of the findings to broader populations and different healthcare settings. Multicenter trials with larger and more diverse cohorts are warranted to confirm and extend these results. Second, the follow-up period of 6 months, while adequate for capturing short- and mid-term recovery, may not be sufficient to assess the long-term sustainability of FET benefits on knee joint function and patient quality of life. Longer-term studies are needed to provide a more comprehensive understanding of the durability of these effects. Third, the study compared FET only with standard rehabilitation protocols and did not assess the impact of combining FET with other evidence-based rehabilitation interventions, such as physical therapy modalities, pharmacological approaches, or adjunctive neuromuscular techniques, that might further enhance postoperative recovery. Future research should consider including additional intervention arms or combination therapies to optimize rehabilitation strategies for patients with meniscal injuries. Furthermore, because FET was provided as an additional component rather than replacing conventional rehabilitation, participants in the FET group received not only greater exercise exposure but also additional supervised therapist contact, structured rehabilitation education, demonstrations, and instructional materials. Because participants and therapists could not be blinded and no attention-matched control condition was used, nonspecific effects related to therapeutic attention, treatment expectations, or Hawthorne effects may have contributed to the observed between-group differences. Therefore, the present design cannot completely distinguish the specific effects of the FET modality from those of increased rehabilitation intensity and therapeutic contact. Future trials should consider attention-matched control conditions with comparable therapist contact and exercise exposure to better isolate the specific effect of FET.
Overall, this study suggests that adding FET to conventional rehabilitation may improve several aspects of postoperative recovery following arthroscopic meniscus repair, including ROM and selected measures of knee function, pain, and proprioception. The findings indicate that some differences were more evident during early recovery, whereas the more persistent between-group effects were observed for ROM, IKDC-assessed knee function, and patient-reported pain. The absence of persistent between-group differences for LRS, PGE2, 5-HT, and proprioceptive measures at 6 months also indicates that the effects were not uniform across outcomes or follow-up periods. Because the clinical efficacy measures were registered as secondary outcomes and the trial was retrospectively registered, these findings should be interpreted cautiously and require confirmation in larger, prospectively registered randomized trials. Future studies should further investigate the effects of different training regimens during various stages of postoperative recovery and should use designs capable of distinguishing the specific effects of FET from those associated with additional exercise exposure and therapeutic contact.
Disclosures
Author Contributions:
Jianxin Zhang: Conceptualization, Methodology, Investigation, Data curation, Formal analysis, Visualization, Writing – original draft. Zixin Yang: Investigation, Data curation, Validation, Formal analysis, Visualization, Writing – review & editing. Biao Yang: Conceptualization, Methodology, Supervision, Project administration, Validation, Writing – review & editing. All authors reviewed and approved the final version of the manuscript and agreed to be accountable for all aspects of the work.
Conflict of Interest:
The authors declare no conflict of interest. No artificial intelligence tools were used in the preparation of the manuscript or figures.
Materials
| Name | Company | Catalog Number | Comments |
|---|---|---|---|
| Anti-gravity treadmill | AlterG Inc., Fremont, CA, USA | M320 | Used for progressive partial-weight-bearing gait and functional training during postoperative weeks 2–6. |
| Balance board | Biodex Medical Systems, Shirley, NY, USA | 950-440 | Used for balance and neuromuscular training during Phase 2. |
| Blood collection tubes | Becton, Dickinson and Company (BD), Franklin Lakes, NJ, USA | BD Vacutainer SST, Product No. 367985 | Used for collection of 4 mL fasting venous blood and serum preparation. |
| DCPM-E Continuous Passive Motion (CPM) machine | Jiangsu Rooe Medical Technology Co., Ltd. | DCPM-E | Microcomputer-controlled CPM device with an internal motion sensor; used for motion-sense assessment at 1°/s; displays parameters on an LCD screen. |
| Electrotherapy device | Chattanooga Group, Hixson, TN, USA | Intelect 2777 Mobile | Used for quadriceps and hamstring electrotherapy during early postoperative rehabilitation. |
| ELISA microplate reader | BioTek Instruments, Winooski, VT, USA | Epoch Microplate Spectrophotometer | Used to measure optical density for quantification of serum PGE2 and 5-HT concentrations. |
| FineTest Human 5-Hydroxytryptamine (5-HT) ELISA Kit | FineTest | EH4005 | Enzyme-linked immunosorbent assay kit for quantitative determination of serum serotonin (5-HT) levels. |
| FineTest Human PGE2 ELISA Kit | FineTest | EH4233 | Enzyme-linked immunosorbent assay kit for quantitative determination of serum prostaglandin E2 (PGE2) levels. |
| GemRed GR311-L digital goniometer | Guangxi GemRed Sensor Technology Co., Ltd. | GR311-L | 12-inch digital goniometer with ±1° accuracy and 0.1° resolution; used for measuring passive knee flexion and extension range of motion. |
| IBM SPSS Statistics for Windows (Version 26.0) | IBM Corp. | N/A (software) | Statistical analysis software used for data analyses, including independent t-tests, repeated-measures ANOVA, and post hoc comparisons with Bonferroni correction. |
| Laboratory centrifuge | Eppendorf AG, Hamburg, Germany | 5702 R | Used to centrifuge venous blood samples at approximately 1,006 × g for 15 min before serum separation. |
| Stationary exercise bicycle / rehabilitation cycle ergometer | Monark Exercise AB, Vansbro, Sweden | 828E | Used for cycling exercise during Phase 3 functional training. |
References
- Ozeki N, Seil R, Krych AJ, Koga H. Surgical treatment of complex meniscus tear and disease: state of the art. J ISAKOS. 2021;6(1):35-45.
- Ghosh P, Taylor TK. The knee joint meniscus. A fibrocartilage of some distinction. Clin Orthop Relat Res. 1987;(224):52-63.
- Makris EA, Hadidi P, Athanasiou KA. The knee meniscus: structure-function, pathophysiology, current repair techniques, and prospects for regeneration. Biomaterials. 2011;32(30):7411-31.
- Atik I, Gul E, Atik S. Evaluation of the relationship between knee osteoarthritis and meniscus pathologies. Malawi Med J. 2024;36(1):48-52.
- Wang P, et al. Morphometric characteristics of the knee are associated with the injury of the meniscus. J Orthop Surg Res. 2022;17(1):498.
- Dasic Z, et al. Treatment of medial meniscus injury with partial meniscectomy. Acta Clin Croat. 2015;54(3):319-25.
- Beaufils P, Pujol N. Meniscal repair: Technique. Orthop Traumatol Surg Res. 2018;104(1 Suppl):S137-45.
- Kurzweil PR, Cannon WD, DeHaven KE. Meniscus repair and replacement. Sports Med Arthrosc Rev. 2018;26(4):160-64.
- O'Donnell K, Freedman KB, Tjoumakaris FP. Rehabilitation protocols after isolated meniscal repair: A systematic review. Am J Sports Med. 2017;45(7):1687-97.
- Wells ME, Scanaliato JP, Dunn JC, Garcia EJ. Meniscal injuries: Mechanism and classification. Sports Med Arthrosc Rev. 2021;29(3):154-57.
- Kaya D, et al. Effects on lower extremity neuromuscular control exercises on knee proprioception, muscle strength, and functional level in patients with ACL reconstruction. Biomed Res Int. 2019;2019:1694695.
- Feng Y, et al. Power-free knee rehabilitation robot for home-based isokinetic training. Nat Commun. 2025;16(1):2347.
- Holm PM, Schroder HM, Wernbom M, Skou ST. Low-dose strength training in addition to neuromuscular exercise and education in patients with knee osteoarthritis in secondary care—a randomized controlled trial. Osteoarthritis Cartilage. 2020;28(6):744-54.
- Villadsen A, Overgaard S, Holsgaard-Larsen A, Christensen R, Roos EM. Immediate efficacy of neuromuscular exercise in patients with severe osteoarthritis of the hip or knee: A secondary analysis from a randomized controlled trial. J Rheumatol. 2014;41(7):1385-94.
- Kinsella SD, Carey JL. Complications in brief: Arthroscopic partial meniscectomy. Clin Orthop Relat Res. 2013;471(5):1427-32.
- Holm PM, et al. Strength training in addition to neuromuscular exercise and education in individuals with knee osteoarthritis—the effects on pain and sensitization. Eur J Pain. 2021;25(9):1898-1911.
- Lysholm J, Gillquist J. Evaluation of knee ligament surgery results with special emphasis on use of a scoring scale. Am J Sports Med. 1982;10(3):150-54.
- Jia ZY, Zhang C, Zou Y, Huang X, Xu WD. Translation and validation of the Simplified Chinese version of International Knee Documentation Committee Subjective Knee Form. Arch Orthop Trauma Surg. 2018;138(10):1433-41.
- Morup-Petersen A, et al. Knee osteoarthritis patients can provide useful estimates of passive knee range of motion: Development and validation of the Copenhagen Knee ROM Scale. J Arthroplasty. 2018;33(9):2875-83.e3.
- Price DD, McGrath PA, Rafii A, Buckingham B. The validation of visual analogue scales as ratio scale measures for chronic and experimental pain. Pain. 1983;17(1):45-56.
- van der List JP, DiFelice GS. Range of motion and complications following primary repair versus reconstruction of the anterior cruciate ligament. Knee. 2017;24(4):798-807.
- Barendrecht M, Lezeman HCA, Duysens J, Smits-Engelsman BCM. Neuromuscular training improves knee kinematics, in particular in valgus aligned adolescent team handball players of both sexes. J Strength Cond Res. 2011;25(3):575-84.
- Huber EO, de Bie RA, Roos EM, Bischoff-Ferrari HA. Effect of pre-operative neuromuscular training on functional outcome after total knee replacement: A randomized-controlled trial. BMC Musculoskelet Disord. 2013;14:157.
- Chen S, et al. The applied study to improve the treatment of knee sports injuries in ultimate frisbee players based on personalized exercise prescription: A randomized controlled trial. Front Public Health. 2024;12:1441790.
- Hammami N, et al. Isokinetic strengthening and neuromuscular electrical stimulation protocol impact on physical performances, functional status and quality of life in knee osteoarthritis overweight/obese women. Knee. 2022;39:106-15.
- Karimijashni M, Sarvestani FK, Yoosefinejad AK. The effect of contralateral knee neuromuscular exercises on static and dynamic balance, knee function, and pain in athletes who underwent anterior cruciate ligament reconstruction: A single-blind randomized controlled trial. J Sport Rehabil. 2023;32(5):524-39.
- Zhang Y, et al. Effects of Internet of Things-based power cycling and neuromuscular training on pain and walking ability in elderly patients with KOA: Protocol for a randomized controlled trial. Trials. 2022;23(1):1009.
- Ghaderi M, Letafatkar A, Almonroeder TG, Keyhani S. Neuromuscular training improves knee proprioception in athletes with a history of anterior cruciate ligament reconstruction: A randomized controlled trial. Clin Biomech (Bristol, Avon). 2020;80:105157.
- Arumugam A, Bjorklund M, Mikko S, Hager CK. Effects of neuromuscular training on knee proprioception in individuals with anterior cruciate ligament injury: A systematic review and GRADE evidence synthesis. BMJ Open. 2021;11(5):e049226.