Higher admission albumin-corrected anion gap was associated with subsequent tricuspid regurgitation velocity elevation after a COPD exacerbation and modestly improved internal model discrimination. These findings support further evaluation of this readily available marker for risk assessment after hospitalization.
Research Article
Admission Albumin-Corrected Anion Gap and Subsequent Tricuspid Regurgitation Velocity Elevation After COPD Exacerbation
In This Article
Summary
Abstract
Admission albumin-corrected anion gap (ACAG) may reflect metabolic stress during an acute exacerbation of chronic obstructive pulmonary disease (AECOPD), but its relationship with subsequent pulmonary vascular abnormalities is unclear. This study included 294 adults hospitalized with AECOPD between January 2022 and November 2024 in a single-center retrospective cohort. Participants had baseline tricuspid regurgitation velocity (TRV) <3.4 m/s and at least one follow-up echocardiogram. The primary endpoint was first detected TRV ≥3.4 m/s within 12 calendar months after discharge. During available follow-up, 105 participants (35.7%) reached the endpoint and 12 died before detection. Each 5 mmol/L higher ACAG was associated with an adjusted odds ratio of 2.17 (95% CI, 1.51–3.11) and a cause-specific hazard ratio of 1.66 (95% CI, 1.34–2.05). A sensitivity analysis using TRV >3.4 m/s identified 99 events and gave an adjusted odds ratio of 1.90 (95% CI, 1.32–2.75). Adding ACAG to the clinical reference model increased the cross-validated area under the curve from 0.803 to 0.829; the extended-model calibration slope was 0.823. Among participants without a detected event, the last readable echocardiogram occurred a median of 323 days after discharge. Admission ACAG was associated with subsequent TRV elevation and provided modest additional discrimination in this cohort. Its availability in routine admission testing makes it a candidate for further evaluation in post-exacerbation risk assessment, with prospective external validation needed before clinical application.
Introduction
Acute exacerbations of chronic obstructive pulmonary disease (AECOPD) accelerate functional decline and increase the risk of hospitalization and death. Cardiovascular stress often accompanies these episodes, and assessment includes pneumonia, heart failure, arrhythmia, pulmonary embolism, and other conditions that may mimic or contribute to the exacerbation1, 2, 3, 4, 5, 6. Hypoxemia, hypercapnia, infection, renal dysfunction, reduced intake, and treatment-related fluid shifts can occur together. Admission markers capturing several of these disturbances may add information beyond conventional measures of respiratory severity.
Pulmonary hypertension (PH) associated with lung disease or hypoxia is classified as group 3 PH. In COPD, pulmonary vascular disease contributes to impaired exercise capacity, right ventricular dysfunction, and poorer survival7, 8, 9, 10, 11, 12. Its severity is not fully explained by airflow limitation: hypoxic vasoconstriction, vascular remodeling, loss of the pulmonary capillary bed, hyperinflation, and coexisting left-heart disease may all contribute8, 9. Cardiac abnormalities are common even at a first hospitalization for COPD exacerbation, and PH during AECOPD is associated with greater hospital resource use and readmission10, 11. These observations motivate the search for accessible markers of cardiopulmonary risk after discharge.
Transthoracic echocardiography assesses right-heart structure and the probability of PH. Peak TRV is a central measurement in this assessment; the ESC/ERS framework identifies TRV >3.4 m/s as indicating high echocardiographic probability7. Right-heart catheterization is required for hemodynamic confirmation. Follow-up TRV measurements therefore provide an observable marker of pulmonary vascular stress, although TRV elevation alone is not diagnostic of PH.
The anion gap (AG) summarizes routinely measured electrolytes and indirectly reflects unmeasured circulating ions. Because albumin is a major unmeasured anion, a low albumin concentration can mask an elevated gap. Albumin correction adds approximately 0.25 mmol/L for each 1 g/L decrease below a reference albumin concentration of 40 g/L13. Albumin-corrected anion gap (ACAG) can thus be calculated from routine admission chemistry and may capture both acid-base disturbance and aspects of systemic illness.
Higher ACAG has been associated with short-term mortality in critically ill patients with COPD14, 15. Natriuretic peptides, spirometry, and diffusing capacity also provide information about PH and prognosis16, 17. Less is known about whether admission ACAG is associated with subsequent TRV elevation after an exacerbation, or whether it adds information beyond established clinical and physiological measurements.
The association between admission ACAG and the first detected TRV ≥3.4 m/s was examined after discharge in adults hospitalized with AECOPD. The analysis also compared the discrimination and calibration of models with and without ACAG and analyzed time to detection while accounting for death before detection18, 19, 20, 21.
Protocol
The study was conducted in accordance with the Declaration of Helsinki and was approved by the institutional ethics committee (approval number 2026-KL010). Written informed consent was obtained from all participants.
Study design and cohort assembly
This single-center retrospective cohort included consecutive patients admitted for AECOPD to the Department of Respiratory and Critical Care Medicine between January 5, 2022, and November 4, 2024. The first qualifying admission was the index admission. Exposure and covariates were measured during or before that admission, and subsequent echocardiograms were reviewed for follow-up outcomes. All eligible patients within the study period were included.
Eligible patients were aged ≥18 years, met COPD and AECOPD criteria, had complete admission sodium, chloride, bicarbonate, albumin, and model covariate data, had baseline transthoracic echocardiography (TTE) with TRV <3.4 m/s, and underwent at least one follow-up TTE within 12 months after discharge. Exclusions included other major primary pulmonary disease, hematologic disease or malignancy, severe extrapulmonary organ dysfunction, major psychiatric disorders hindering participation, and refusal or inability to provide consent. Figure 1 summarizes screening and sequential exclusions. Reporting followed STROBE and TRIPOD+AI19, 20.
Clinical and laboratory measurements
Baseline demographic and clinical parameters, including age, sex, body mass index (BMI), smoking and alcohol consumption history, COPD duration, hypertension, diabetes, exacerbation frequency during the preceding 12 months, and post-bronchodilator forced expiratory volume in 1 second (FEV₁) percentage predicted, were extracted directly from electronic medical records.
Admission blood samples obtained within 24 hours provided hematology, albumin, electrolyte, fibrinogen, procalcitonin, and B-type natriuretic peptide (BNP) measurements. PaO₂/FiO₂ was calculated using the oxygen concentration recorded at arterial blood gas sampling. Post-bronchodilator FEV₁ was obtained from the pulmonary function assessment recorded during clinical stability before admission.
Heart failure was identified from clinical and echocardiographic records. Major left-heart disease, referred to as severe structural abnormalities, was recorded as absent in all included patients. Renal and liver dysfunction were identified from laboratory results and clinical records, with unknown status kept separate from documented absence. Sensitivity analyses excluded patients with recorded heart failure or pneumonia, or required documented absence of heart failure, pneumonia, renal dysfunction, and liver dysfunction. Some diagnosis dates were unresolved, so these restrictions were exploratory. A separate model adjusted for admission creatinine, ALT, and AST in the 287 patients with complete measurements.
Anion gap calculations
The conventional anion gap (AG), excluding potassium, was calculated as:
AG = Sodium − Chloride − Bicarbonate (mmol/L)
The albumin-corrected anion gap (ACAG) was calculated as:
ACAG = AG + 0.25 × (40 − Albumin [g/L])
ACAG was analyzed continuously, with effects expressed per 5 mmol/L increase. The stored ACAG values were used in the primary analysis; recalculation from the displayed laboratory values was examined in a sensitivity analysis.
Echocardiography and endpoint ascertainment
Baseline TTE was performed during the index admission. Peak TRV was measured by continuous-wave Doppler, with baseline values ranging from 1.90 to 2.94 m/s. Follow-up records were organized around nominal 3-, 6-, and 12-month visits, but actual examination dates were used for analysis. Available reports from clinically indicated and external examinations were included. The original visit records did not consistently distinguish planned from clinically triggered examinations. All 24 additional examinations were clinically triggered: 9 by reduced activity tolerance, 8 by worsening dyspnea, and 7 by readmission. Four were performed externally, and six had unreadable TRV measurements. An unreadable examination or an unavailable external report was not classified as a negative result.
The primary endpoint was the first follow-up TTE with TRV ≥3.4 m/s. A sensitivity analysis used the stricter >3.4 m/s threshold in the ESC/ERS framework7. Follow-up for the analysis began at discharge and was limited to 12 calendar months. The first qualifying examination defined the detection date. Patients alive without a detected event were censored at their last readable TTE. Death before detection was treated as a competing event at the recorded death date; a sensitivity analysis instead censored these patients at their last readable TTE.
Statistical analysis
Continuous variables are expressed as the mean (standard deviation), or median (interquartile range), and categorical variables are presented as counts (percentages). Descriptive between-group comparisons were performed using Welch’s t-test, the Mann–Whitney U test, or Fisher’s exact test, as appropriate.
The clinical reference model included age, sex, BMI, smoking history, COPD duration, post-bronchodilator FEV₁% predicted, prior-year exacerbation count, log₂ (BNP/100 pg/mL), PaO₂/FiO₂, and baseline TRV. The extended model added continuous ACAG. The original predictor set was retained without stepwise selection, and all estimates were for main effects, excluding interaction terms. Additional models assessed albumin and conventional AG separately and evaluated ACAG after adjustment for albumin. AG, albumin, and ACAG were not entered together because ACAG is derived from the other two measurements.
Logistic regression estimated associations with documented TRV elevation during the available follow-up period. Patients who died before detection were included in the no-detection category. A secondary cause-specific Cox model estimated time to first detection, censoring deaths at their dates and other patients at their last readable TTE; tied times were handled using the Efron method. Because examinations were intermittent, the model describes time to detection rather than biological onset. A sensitivity analysis assigned detection to the midpoint between the last negative observation, bounded by discharge, and the first positive TTE. Effect increments were 10 years for age, 5 kg/m2 for BMI, 5 years for COPD duration, 10 percentage points for FEV₁, 50 mmHg for PaO₂/FiO₂, 0.1 m/s for baseline TRV, and 5 mmol/L for ACAG.
Aalen–Johansen curves estimated the cumulative detection, with death as a competing event18. The ACAG cutoff of 14.38 mmol/L was selected in this cohort by maximizing the Youden index (sensitivity + specificity − 1) in ROC analysis and was retained for exploratory group comparisons. Apparent AUC confidence intervals were estimated from 2,000 paired bootstrap resamples of participants, with fixed fitted predictions. Internal performance was assessed with 20 repetitions of stratified 10-fold cross-validation using identical splits across models. Each model was refitted within each training fold; the 20 held-out predictions per participant were averaged to calculate AUC, Brier score, and calibration intercept and slope. Tests were two-sided, and supplementary analyses were exploratory without adjustment for multiple comparisons19, 20, 21.
Sensitivity analyses examined the strict TRV threshold, alternative observation times, original visit records without the 24 additional examinations, recalculated ACAG, and the comorbidity restrictions described above. Nonlinearity was assessed separately for each continuous predictor using three-knot restricted cubic splines at the 10th, 50th, and 90th percentiles. Rank-time Schoenfeld-residual tests assessed proportional hazards. Firth logistic regression with profile penalized-likelihood intervals examined the stability of ACAG and COPD-duration estimates22. These supplementary analyses were added during revision.
Results
Cohort and follow-up
Screening identified 480 admission records, of which 48 were repeat or non-index admissions. Among 432 unique patients, sequential exclusions were age <18 years (8), failure to meet COPD criteria (14), failure to meet AECOPD criteria (10), no baseline TTE (12), baseline TRV ≥3.4 m/s (18), missing required laboratory or covariate data (26), no follow-up TTE (28), and other exclusion conditions (22). The final cohort included 294 patients; the mean age was 67.0 years, and 217 (73.8%) were men (Figure 1). TRV elevation was detected in 105 patients (35.7%), 12 died before detection, and 177 remained alive without a detected event. Nineteen patients died overall, including seven after detection. Of the 784 follow-up examinations performed, 778 had readable TRV measurements. Examinations in the nominal 3-, 6-, and 12-month slots occurred a median of 82, 172, and 324 days after discharge. Median time to detection, death, or censoring was 320 days (IQR, 176–328). Among patients without detection, the last readable TTE occurred at a median of 323 days (IQR, 315–331), a median of 42 days before the end of the calendar-month window. Examination counts and timing by outcome group are shown in Supplementary Table 1.
Baseline characteristics and ACAG distribution
Patients with subsequent TRV elevation were older and had lower FEV₁ and PaO₂/FiO₂, higher baseline TRV, neutrophil count, fibrinogen, and BNP, and lower albumin than those without a detected event (Table 1). Mean ACAG was 13.73 (SD, 4.45) mmol/L in patients with detection and 11.02 (SD, 4.35) mmol/L in those without detection (P < 0.001; Figure 2).
Multivariable associations
Each 5 mmol/L higher ACAG was associated with an adjusted OR of 2.17 (95% CI, 1.51–3.11) for subsequent TRV elevation (P < 0.001). Older age, lower FEV₁, and higher baseline TRV were also associated with detection (Table 2). The adjusted cause-specific HR for ACAG was 1.66 (95% CI, 1.34–2.05; P < 0.001), consistent with the direction of the logistic association (Figure 3). Logistic model coefficients, intercepts, and the probability calculation are provided in Supplementary Table 2.
TRV was exactly 3.4 m/s in 10 examinations from nine patients. Three of these patients subsequently had TRV > 3.4 m/s; six did not. The strict-threshold analysis therefore included 99 events, with 14 deaths before detection. ACAG remained associated with this endpoint (OR, 1.90; 95% CI, 1.32–2.75; HR, 1.58; 95% CI, 1.27–1.96; Supplementary Table 3). The median interval from the last negative observation, bounded by discharge, to first detection was 138 days (IQR, 88–154). Assigning the midpoint of this interval as the event time gave an ACAG HR of 1.60 (95% CI, 1.31–1.96).
After excluding patients with recorded heart failure or pneumonia, 272 patients with 96 events remained, and the ACAG OR was 2.04 (95% CI, 1.41–2.96). Requiring documented absence of all four comorbidity labels retained 230 patients with 81 events and gave an OR of 2.14 (95% CI, 1.41–3.23). Additional adjustment for admission creatinine, ALT, and AST in 287 patients with 101 events yielded an OR of 2.26 (95% CI, 1.55–3.29; Supplementary Table 3).
Firth logistic estimates were OR 2.07 (95% CI, 1.48–2.98) for ACAG and OR 1.89 (95% CI, 0.93–3.87) for COPD duration (Supplementary Table 4). Nonlinearity tests for ACAG gave P = 0.351 in the logistic model and P = 0.495 in the Cox model. The Schoenfeld test for ACAG yielded P = 0.224, and all 11 individual proportional hazards tests had P > 0.05 (Supplementary Table 5). COPD duration showed evidence of nonlinearity (logistic P = 0.047; Cox P = 0.043). Allowing a spline for duration gave ACAG OR 2.10 (95% CI, 1.46–3.03) and HR 1.63 (95% CI, 1.32–2.02).
Discrimination and calibration
ACAG alone had an apparent AUC of 0.668 and a cross-validated AUC of 0.664. Adding ACAG to the clinical reference model increased apparent AUC from 0.836 to 0.861 and cross-validated AUC from 0.803 to 0.829. The apparent AUC difference was 0.025 (bootstrap 95% CI, 0.002–0.048). Cross-validated Brier scores were 0.167 for the reference model and 0.158 for the extended model. The extended-model calibration intercept was −0.074, and the slope was 0.823 (Table 3; Figure 4).
In models that added each marker separately to the clinical reference model, the adjusted OR was 0.45 (95% CI, 0.26–0.78) per 5 g/L increase in albumin and 2.11 (95% CI, 1.46–3.05) per 5 mmol/L increase in conventional AG. After additional adjustment for albumin, the ACAG OR was 1.99 (95% CI, 1.37–2.90; Supplementary Table 6). Adding ACAG to the reference-plus-albumin model increased cross-validated AUC from 0.812 to 0.832. The apparent AUC difference was 0.018 (95% CI, −0.002 to 0.036).
Exploratory threshold and cumulative incidence
The exploratory ACAG cutoff of 14.38 mmol/L had sensitivity of 44.8% and specificity of 81.0%. Among 83 patients at or above the cutoff, 47 had TRV elevation and one died before detection; among 211 below the cutoff, 58 had TRV elevation and 11 died before detection. The corresponding crude detection proportions were 56.6% and 27.5%. Figure 5 shows cumulative detection using actual observation times. No patients remained under observation at day 365, so a full 12-month cumulative incidence estimate was not reported.
The de-identified data supporting the findings are available from the corresponding author on reasonable request, subject to institutional and ethical requirements.
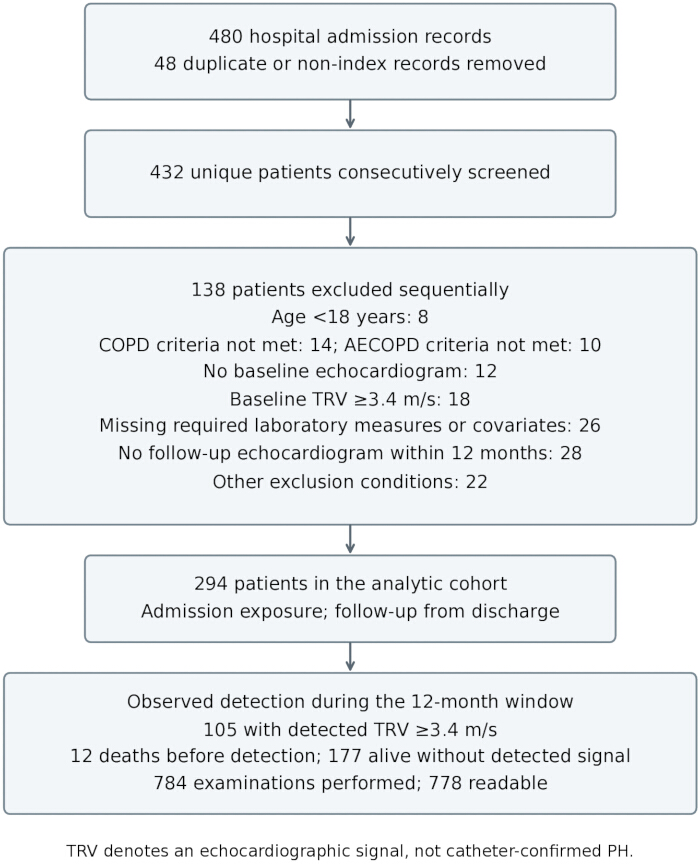
Figure 1: Cohort assembly and observed outcomes. The flowchart shows admission records, unique screened patients, sequential exclusions, and outcomes among the 294 included patients. Abbreviations: TRV = tricuspid regurgitation velocity; AECOPD = acute exacerbation of chronic obstructive pulmonary disease. Please click here to view a larger version of this figure.
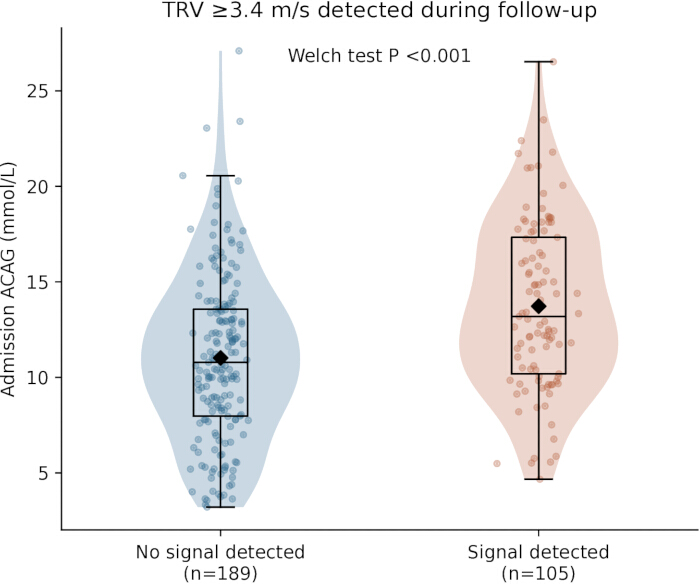
Figure 2: Admission ACAG by subsequent TRV elevation. Violin plots, box plots, individual observations, and mean diamonds show the distributions. Mean (SD) ACAG was 11.02 (4.35) mmol/L without detection and 13.73 (4.45) mmol/L with detection (Welch’s t-test P < 0.001). Abbreviations: ACAG = albumin-corrected anion gap; TRV = tricuspid regurgitation velocity. Please click here to view a larger version of this figure.
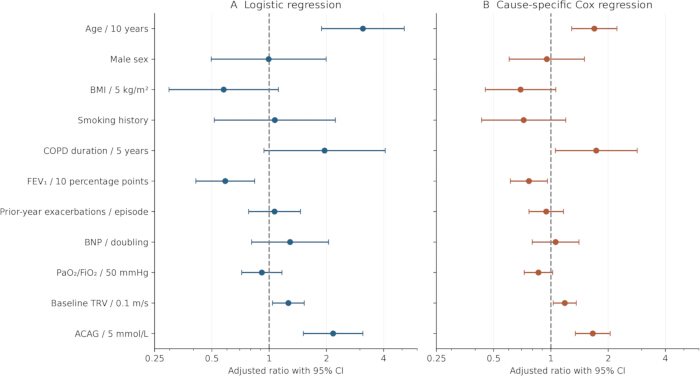
Figure 3: Adjusted associations with subsequent TRV elevation. (A) Logistic ORs for detection during available follow-up. (B) Cause-specific Cox HRs for time to first detection. Both models include the same 11 predictors. Bars indicate 95% confidence intervals; dashed lines indicate the null value of 1.0. Predictor increments appear in the labels. Abbreviations: OR = odds ratio; HR = hazard ratio; TRV = tricuspid regurgitation velocity. Please click here to view a larger version of this figure.
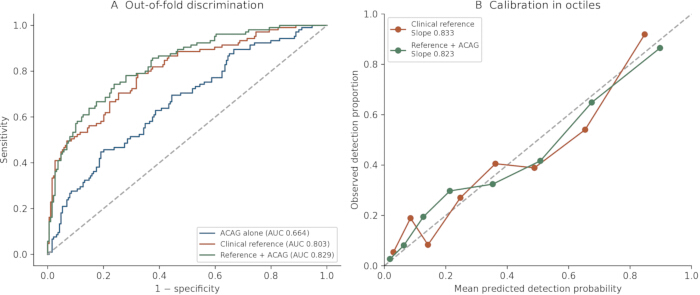
Figure 4: Internal model performance. (A) ROC curves based on each participant’s averaged held-out predictions from 20 repetitions of stratified 10-fold cross-validation. (B) Observed detection proportions by octiles of predicted probability for the reference and extended models. The extended-model calibration slope was 0.823. Abbreviations: AUC = area under the curve; ACAG = albumin-corrected anion gap. Please click here to view a larger version of this figure.
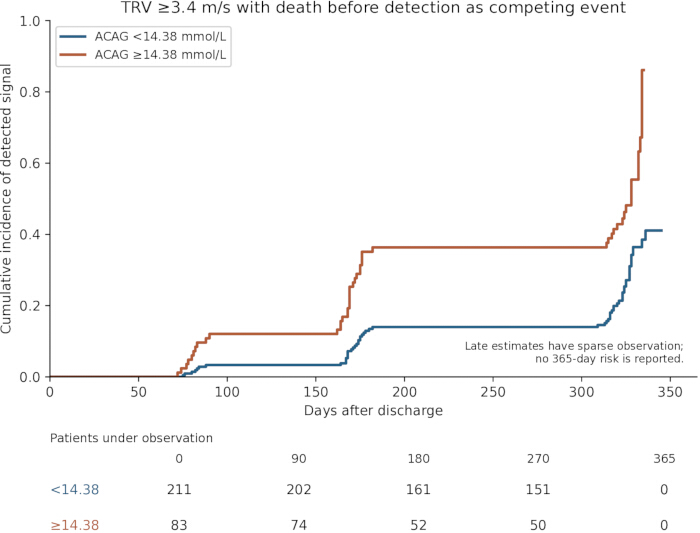
Figure 5: Cumulative detection of TRV ≥3.4 m/s by admission ACAG. Aalen–Johansen curves account for death before detection and use actual examination and censoring dates. Groups are defined by the exploratory ACAG cutoff of 14.38 mmol/L. Numbers under the curves are shown below. Late estimates are based on a small number of patients; no day-365 risk estimate is reported. Abbreviations: ACAG = albumin-corrected anion gap; TRV = tricuspid regurgitation velocity. Please click here to view a larger version of this figure.
| Characteristic | Overall (n = 294) | Signal detected (n = 105) | No signal detected (n = 189) | P value | SMD |
| Age, years | 67.02 (7.85) | 71.47 (7.62) | 64.55 (6.84) | <0.001 | 0.96 |
| Male sex, n (%) | 217 (73.8) | 79 (75.2) | 138 (73.0) | 0.782 | 0.05 |
| BMI, kg/m² | 22.53 (2.39) | 22.06 (2.20) | 22.80 (2.45) | 0.009 | -0.32 |
| Smoking history, n (%) | 224 (76.2) | 84 (80.0) | 140 (74.1) | 0.317 | 0.14 |
| COPD duration, years | 8.74 (2.36) | 9.51 (2.43) | 8.32 (2.21) | <0.001 | 0.51 |
| Hypertension, n (%) | 107 (36.4) | 43 (41.0) | 64 (33.9) | 0.255 | 0.15 |
| Diabetes, n (%) | 40 (13.6) | 17 (16.2) | 23 (12.2) | 0.376 | 0.12 |
| Exacerbations in previous 12 months | 1.00 (1.00–2.00) | 2.00 (1.00–3.00) | 1.00 (0.00–2.00) | <0.001 | 0.65 |
| Post-bronchodilator FEV₁, % predicted | 52.67 (10.41) | 47.53 (9.76) | 55.52 (9.65) | <0.001 | -0.82 |
| White blood cells, ×10⁹/L | 6.61 (1.40) | 6.99 (1.43) | 6.39 (1.34) | <0.001 | 0.43 |
| Neutrophils, ×10⁹/L | 4.24 (1.13) | 4.71 (1.19) | 3.98 (1.00) | <0.001 | 0.67 |
| Lymphocytes, ×10⁹/L | 1.52 (0.46) | 1.48 (0.41) | 1.54 (0.49) | 0.205 | -0.15 |
| RDW, % | 13.24 (1.64) | 13.74 (1.57) | 12.96 (1.62) | <0.001 | 0.49 |
| Fibrinogen, g/L | 3.26 (1.14) | 3.60 (1.14) | 3.06 (1.09) | <0.001 | 0.48 |
| Procalcitonin, ng/mL | 0.05 (0.04–0.07) | 0.06 (0.04–0.07) | 0.05 (0.03–0.06) | 0.003 | 0.39 |
| Albumin, g/L | 39.29 (2.90) | 38.25 (2.78) | 39.88 (2.81) | <0.001 | -0.58 |
| Conventional anion gap, mmol/L | 11.81 (4.37) | 13.29 (4.27) | 10.99 (4.21) | <0.001 | 0.54 |
| BNP, pg/mL | 118.35 (82.61–156.44) | 135.03 (104.53–179.04) | 105.74 (75.90–142.37) | <0.001 | 0.48 |
| PaO₂/FiO₂, mmHg | 231.58 (78.22) | 195.74 (64.10) | 251.49 (78.40) | <0.001 | -0.78 |
| PaCO₂, mmHg | 44.84 (5.48) | 46.12 (5.57) | 44.12 (5.31) | 0.003 | 0.37 |
| Baseline TRV, m/s | 2.41 (0.19) | 2.51 (0.17) | 2.36 (0.18) | <0.001 | 0.84 |
| Baseline TAPSE, mm | 21.18 (1.78) | 20.71 (1.68) | 21.44 (1.79) | <0.001 | -0.42 |
| Baseline RVFAC, % | 42.45 (3.26) | 41.69 (3.37) | 42.87 (3.12) | 0.004 | -0.36 |
| ACAG, mmol/L | 11.98 (4.56) | 13.73 (4.45) | 11.02 (4.35) | <0.001 | 0.62 |
Table 1: Baseline characteristics by subsequent TRV elevation. Values are mean (SD), median (IQR), or n (%). P values use Welch’s t-test, Mann–Whitney U test, or Fisher’s exact test, as appropriate. SMD is calculated as detection minus no detection. The no-detection group includes patients who died before detection. Abbreviations: ACAG = albumin-corrected anion gap; AG = anion gap; BMI = body mass index; BNP = B-type natriuretic peptide; COPD = chronic obstructive pulmonary disease; FEV₁ = forced expiratory volume in 1 s; PaCO₂ = arterial carbon dioxide partial pressure; PaO₂/FiO₂ = oxygenation ratio; RDW = red cell distribution width; RVFAC = right ventricular fractional area change; TAPSE = tricuspid annular plane systolic excursion; TRV = tricuspid regurgitation velocity; SMD = standardized mean difference.
| Predictor | Adjusted OR (95% CI) | Logistic P | Cause-specific HR (95% CI) | Cox P |
| Age / 10 years | 3.11 (1.89–5.13) | <0.001 | 1.69 (1.29–2.22) | <0.001 |
| Male sex | 0.99 (0.50–1.99) | 0.987 | 0.95 (0.60–1.50) | 0.831 |
| BMI / 5 kg/m² | 0.58 (0.30–1.12) | 0.103 | 0.69 (0.45–1.06) | 0.092 |
| Smoking history | 1.07 (0.51–2.23) | 0.854 | 0.72 (0.43–1.20) | 0.205 |
| COPD duration / 5 years | 1.96 (0.94–4.07) | 0.073 | 1.73 (1.06–2.84) | 0.030 |
| FEV₁ / 10 percentage points | 0.59 (0.41–0.84) | 0.003 | 0.77 (0.61–0.96) | 0.020 |
| Prior-year exacerbations / episode | 1.07 (0.78–1.46) | 0.683 | 0.95 (0.77–1.16) | 0.596 |
| BNP / doubling | 1.29 (0.81–2.05) | 0.286 | 1.06 (0.80–1.40) | 0.692 |
| PaO₂/FiO₂ / 50 mmHg | 0.92 (0.72–1.17) | 0.478 | 0.86 (0.72–1.02) | 0.087 |
| Baseline TRV / 0.1 m/s | 1.26 (1.04–1.53) | 0.017 | 1.18 (1.03–1.36) | 0.018 |
| ACAG / 5 mmol/L | 2.17 (1.51–3.11) | <0.001 | 1.66 (1.34–2.05) | <0.001 |
Table 2: Adjusted associations with subsequent TRV elevation. Logistic ORs describe detection during available follow-up; cause-specific Cox HRs describe time to first detection. Both models include the same predictors and scales, without interaction terms. BNP is log₂-transformed relative to 100 pg/mL. Abbreviations: OR = odds ratio; HR = hazard ratio; CI = confidence interval.
| Model | Apparent AUC (95% CI) | Cross-validated AUC | Brier score | Calibration intercept | Calibration slope |
| ACAG alone | 0.668 (0.606–0.729) | 0.664 | 0.213 | -0.033 | 0.942 |
| Clinical reference | 0.836 (0.786–0.882) | 0.803 | 0.167 | -0.073 | 0.833 |
| Reference + ACAG | 0.861 (0.812–0.903) | 0.829 | 0.158 | -0.074 | 0.823 |
| Reference + albumin | 0.845 (0.796–0.891) | 0.812 | 0.162 | -0.077 | 0.826 |
| Reference + AG | 0.858 (0.809–0.899) | 0.825 | 0.159 | -0.074 | 0.822 |
| Reference + albumin + ACAG | 0.863 (0.817–0.904) | 0.832 | 0.156 | -0.079 | 0.815 |
Table 3: Apparent and cross-validated model performance. All models use the same 20 repetitions of stratified 10-fold cross-validation. Metrics are calculated from the average of each participant’s held-out predictions; calibration intercept and slope are estimated jointly. Apparent AUC intervals use 2,000 paired-participant bootstrap resamples of the fixed fitted predictions. Lower Brier scores indicate lower prediction error. Abbreviations: AUC = area under the curve; ACAG = albumin-corrected anion gap; AG = anion gap; CI = confidence interval.
Supplementary Table 1: Examination counts and timing. Please click here to download this File.
Supplementary Table 2: logistic coefficients, intercepts, and probability calculation. Please click here to download this File.
Supplementary Table 3: Sensitivity analyses. Please click here to download this File.
Supplementary Table 4: Firth logistic estimates. Please click here to download this File.
Supplementary Table 5: Functional-form and proportional-hazards diagnostics. Please click here to download this File.
Supplementary Table 6: Albumin and conventional AG associations. Please click here to download this File.
Discussion
Higher admission ACAG was associated with subsequent elevation of TRV after AECOPD, and this association persisted after adjustment for clinical and physiological covariates. Results were similar with the stricter TRV threshold and across several sensitivity analyses. Adding ACAG modestly improved internal discrimination. Because ACAG can be calculated from routine admission chemistry, it merits further study as an accessible component of risk assessment after an exacerbation.
Several processes may contribute to this association. Hypoxia, infection, altered perfusion, and renal dysfunction can increase the unmeasured-ion component of the gap, while albumin may fall with inflammation, capillary leakage, reduced synthesis, renal loss, or dilution3, 4, 13. Over longer periods, low albumin may reflect malnutrition, frailty, chronic inflammation, or congestion. Albumin correction may therefore capture information about both acute metabolic disturbance and underlying physiological reserve.
The role of albumin extends beyond its contribution to the ACAG formula. An editorial on nutritional indices in acute coronary syndrome emphasizes the overlap created by their shared albumin component23. Studies in patients with cardiac resynchronization therapy and permanent pacemakers also link albumin to longer-term cardiovascular outcomes24, 25, 26. The separate albumin and AG analyses are consistent with contributions from both components. Although ACAG retained an association after adjustment for albumin, the confidence interval for the additional AUC included zero. Since ACAG is calculated from AG and albumin, these models cannot distinguish their causal contributions. Repeated measurements after clinical stabilization would help clarify the relative importance of acute change and persistent susceptibility.
Previous COPD studies focused on ACAG and short-term mortality14, 15; the present findings extend this work to an echocardiographic outcome after discharge. ACAG could be evaluated alongside lung function, gas exchange, BNP, and baseline echocardiography in future risk-assessment studies8, 9, 12, 16, 17. Whether adding it to these measurements can improve the allocation or timing of follow-up is a question for prospective studies with standardized surveillance and independent validation.
The sample size limits the precision and stability of the multivariable models. The extended model included 11 slope parameters for 105 events, or approximately 9.5 events per parameter; the model additionally adjusting for albumin included 12. The calibration slope of 0.823 indicates that internally predicted risks remained too extreme despite cross-validation19, 21. Firth estimates supported the ACAG association, but COPD duration had a wide interval and evidence of nonlinearity22. The cutoff of 14.38 mmol/L was selected and evaluated in the same cohort, and it identified fewer than half of the observed events. Its apparent performance should therefore be interpreted as exploratory. Neither the model nor the cutoff has been externally validated.
The endpoint was an echocardiographic marker rather than catheter-confirmed PH. A baseline TRV below 3.4 m/s does not exclude all PH, and a later elevation in TRV cannot establish its hemodynamic severity or cause. The >3.4 m/s sensitivity analysis addresses the guideline boundary7, but right-heart catheterization and fuller etiological assessment would be needed to attribute events specifically to COPD-associated PH.
Selection and follow-up also limit interpretation. Requiring complete covariates and a follow-up TTE excluded 26 and 28 screened patients, respectively. Their individual records were unavailable for comparison, so the direction and magnitude of selection bias remain uncertain. Planned and clinically triggered TTEs were incompletely distinguished; more symptomatic patients may have been examined earlier or more often. The 62 readable examinations after detection also complicate comparisons of examination frequency. Intermittent testing leaves the onset of TRV elevation uncertain, and midpoint timing does not remove this uncertainty. Observation ended before the full 12-month window in every patient, so the no-detection group may include later unobserved events. Some comorbidity onset dates were unresolved, limiting the corresponding exclusion analyses. Residual confounding, the single-center retrospective design, and the absence of serial stabilized ACAG measurements further restrict causal and clinical interpretation.
Admission ACAG was associated with subsequent TRV elevation after AECOPD and modestly improved internal discrimination beyond established clinical measurements. Its routine availability supports further evaluation as a marker for post-exacerbation risk assessment. Prospective studies should determine whether this association translates into useful risk stratification and better follow-up decisions.
Disclosures
The authors declare that they have no conflicts of interest.
Acknowledgements
Not applicable.
Materials
| Name | Company | Catalog Number | Comments |
|---|---|---|---|
| Blood-gas analyzer | Radiometer | ABL90 FLEX PLUS | Admission blood gases and recorded oxygen conditions |
| BNP assay platform | Roche Diagnostics | cobas e801 | Admission B-type natriuretic peptide |
| Clinical chemistry analyzer | Roche Diagnostics | cobas c702 | Recorded chemistry platform |
| Clinical chemistry analyzer | Abbott Diagnostics | Alinity c | Recorded chemistry platform |
| Echocardiography system | GE HealthCare | Vivid E95 | Baseline and follow-up TTE |
| Echocardiography system | Philips Healthcare | EPIQ 7C | Baseline and follow-up TTE |
| Hematology analyzer | Sysmex Corporation | XN-1000 | Complete blood count and RDW |
| lifelines | Open-source project | 0.30.3 | Revision analyses; exact versions retained for reproduction |
| matplotlib | Open-source project | 3.11.2 | Revision analyses; exact versions retained for reproduction |
| numpy | Open-source project | 2.5.3 | Revision analyses; exact versions retained for reproduction |
| pandas | Open-source project | 2.3.3 | Revision analyses; exact versions retained for reproduction |
| Python | Python Software Foundation | 3.12.14 | Revision analyses; exact versions retained for reproduction |
| scikit-learn | Open-source project | 1.9.1 | Revision analyses; exact versions retained for reproduction |
| scipy | Open-source project | 1.18.1 | Revision analyses; exact versions retained for reproduction |
| statsmodels | Open-source project | 0.15.0 | Revision analyses; exact versions retained for reproduction |
References
- Cazzola M et al. GOLD 2026: Transforming COPD Management with Early Intervention, Multi-dimensional Assessment, and Personalized Care. Drugs. 2026;86(5):581-597.
- Agusti A et al. Global Initiative for Chronic Obstructive Lung Disease 2023 Report: GOLD Executive Summary. Am J Respir Crit Care Med. 2023;207(7):819-837.
- MacLeod M et al. Chronic obstructive pulmonary disease exacerbation fundamentals: diagnosis, treatment, prevention and disease impact. Respirology. 2021;26(6):532-551.
- Celli BR et al. Differential diagnosis of suspected chronic obstructive pulmonary disease exacerbations in the acute care setting: best practice. Am J Respir Crit Care Med. 2023;207(9):1134-1144.
- Celli BR, Wedzicha JA. Update on clinical aspects of chronic obstructive pulmonary disease. N Engl J Med. 2019;381(13):1257-1266.
- Venkatesan P. GOLD COPD report: 2026 update. Lancet Respir Med. Published online November 26, 2025.
- Humbert M et al. 2022 ESC/ERS Guidelines for the diagnosis and treatment of pulmonary hypertension. Eur Heart J. 2022;43(38):3618-3731.
- Olsson KM et al. Pulmonary hypertension associated with lung disease: new insights into pathomechanisms, diagnosis, and management. Lancet Respir Med. 2023;11(9):820-835.
- Nathan SD et al. Pulmonary hypertension in chronic lung disease and hypoxia. Eur Respir J. 2019;53(1):1801914.
- Freixa X et al. Echocardiographic abnormalities in patients with COPD at their first hospital admission. Eur Respir J. 2013;41(4):784-791.
- Munshi RF et al. Impact of pulmonary hypertension in patients with acute exacerbation of chronic obstructive pulmonary disease and its effect on healthcare utilization. Pulm Circ. 2021;11:20458940211046838.
- Kovacs G et al. Severe pulmonary hypertension in COPD: impact on survival and diagnostic approach. Chest. 2022;162(1):202-212.
- Figge J, Jabor A, Kazda A, Fencl V. Anion gap and hypoalbuminemia. Crit Care Med. 1998;26(11):1807-1810.
- Giri M, Puri A, Huang L, Guo S. Association between albumin corrected anion gap and in-hospital mortality in critically ill patients with chronic obstructive pulmonary disease. Ther Adv Respir Dis. 2025;19:17534666251315352.
- Long Z et al. The association between albumin-corrected anion gap and in-hospital mortality in critically ill COPD patients: a multicenter retrospective study from eICU collaborative research database. J Crit Care. 2026;91:155260.
- Tian F et al. NT-pro BNP in AECOPD-PH: old biomarker, new insights based on a large retrospective case-controlled study. Respir Res. 2021;22:321.
- Li Y et al. FVC/DLCO identifies pulmonary hypertension and predicts 5-year all-cause mortality in patients with COPD. Eur J Med Res. 2023;28:174.
- van Geloven N et al. Validation of prediction models in the presence of competing risks: a guide through modern methods. BMJ. 2022;377:e069249.
- Collins GS et al. TRIPOD+AI statement: updated guidance for reporting clinical prediction models that use regression or machine learning methods. BMJ. 2024;385:e078378.
- von Elm E et al. The Strengthening the Reporting of Observational Studies in Epidemiology (STROBE) statement: guidelines for reporting observational studies. Lancet. 2007;370(9596):1453-1457.
- Efthimiou O et al. Developing clinical prediction models: a step-by-step guide. BMJ. 2024;386:e078276.
- Tzeng IS. To handle the inflation of odds ratios in a retrospective study with a profile penalized log-likelihood approach. J Clin Lab Anal. 2021;35(7):e23849.
- Hayıroğlu MI, Altay S. Overlap Between Nutritional Indices in Patients with Acute Coronary Syndrome: A Focus on Albumin. Balkan Med J. 2024;41(5):324-325.
- Pay L et al. Prognostic value of serum albumin in heart failure patients with cardiac resynchronization therapy. Biomark Med. 2024;18(8):363-371.
- Hayıroğlu MI et al. Cardiac variables associated with atrial fibrillation occurrence and mortality in octogenarians implanted with dual chamber permanent pacemakers. Aging Clin Exp Res. 2022;34(10):2533-2539.
- Hayıroğlu MI et al. Prognostic value of serum albumin for long-term mortality in patients with dual-chamber permanent pacemakers. Biomark Med. 2022;16(5):341-348.