This systematic review evaluates malignant upgrade and related outcomes after vacuum-assisted breast biopsy and excision using an auditable dataset of 26 reports. Quantitative synthesis was restricted to fully retrieved reports, non-equivalent outcomes were analyzed separately, and certainty of evidence was assessed for each principal outcome.
Research Article
Vacuum-Assisted Breast Biopsy and Excision for Breast Lesions: A Systematic Review and Meta-analysis of Malignant Upgrade in B3 Lesions
In This Article
Summary
Abstract
Vacuum-assisted breast biopsy (VAB/VABB) and vacuum-assisted excision (VAE) serve distinct diagnostic and therapeutic roles, requiring pathway-specific evaluation of their outcomes. This systematic review reconstructed a report-level and outcome-level dataset from 26 publications, of which 18 were reviewed in full text and 8 remained incompletely retrieved. Reports without complete full text were retained for narrative context but excluded from quantitative synthesis. Five full-text studies contributed 98 malignant upgrades among 844 B3 lesions after diagnostic VAB/VABB. The pooled proportion was 11.23% (95% confidence interval [CI], 7.22%-17.04%; 95% prediction interval [PI], 4.56%-25.06%; I2 = 60.8%). Three full-text studies of second-line VAE reported study-specific upgrade proportions from 5.1% to 21.4%; these estimates were not pooled because selection pathways and case mix differed substantially. Post-VAE radiologic removal, absence of residual lesion, and recurrence-free outcomes ranged from 86.0% to 99.2% across five full-text cohorts but were not combined because they represented different endpoints and follow-up intervals. Only one fully retrieved study provided reconstructable diagnostic 2 × 2 data, precluding a diagnostic meta-analysis or hierarchical model. Certainty was very low for the principal observational outcomes and low for the single randomized comparison. The evidence supports pathway-specific interpretation and multidisciplinary decision-making, not universal superiority over core needle biopsy or equivalence to surgical excision.
Introduction
Vacuum-assisted breast biopsy (VABB), vacuum-assisted biopsy (VAB), and vacuum-assisted excision (VAE) are related but non-interchangeable procedures. VAB/VABB is primarily a tissue-sampling technique, whereas VAE is intended to remove an imaging target percutaneously. Core needle biopsy (CNB) is a diagnostic comparator, and surgical excision may serve as a treatment or pathological reference standard. Current guidance therefore emphasizes lesion category, radiologic-pathologic concordance, intended procedure, and the availability of verification and follow-up1,2,3,4,5,6,7,8,9,10. The available evidence includes direct comparative diagnostic studies, single-arm diagnostic-accuracy cohorts, B3-lesion upgrade cohorts, implementation studies, single-arm VAE cohorts, and one randomized needle-size trial. These designs address different clinical questions. Combining them within a single effect estimate would introduce indirectness and obscure differences in pathological subtype, imaging presentation, guidance modality, needle gauge, reference standard, follow-up, and unit of analysis.
The review was therefore organized around one primary quantitative question: the malignant-upgrade proportion after diagnostic VAB/VABB in B3 lesions among fully retrieved studies. Secondary modules summarized second-line VAE, post-VAE lesion status, diagnostic performance, safety, and direct comparisons without forcing clinically dissimilar outcomes into a common pool. Published reviews and guidelines were used for context rather than as substitutes for traceable study-level data5,6,7,8,9,10,11,12,13. The objectives were to reconstruct an auditable study-report and outcome dataset, identify overlapping cohorts, distinguish patient-, lesion-, and procedure-level denominators, quantify malignant upgrade after diagnostic VAB/VABB in B3 lesions, and describe secondary evidence in a form consistent with its design, heterogeneity, and certainty.
Protocol
This systematic review used only aggregate data from previously published reports. It involved no recruitment, intervention, or access to identifiable individual-level information. Ethics committee approval and individual informed consent were therefore not required; no approval or exemption number applies.
Review Questions and Registration
The review followed PRISMA 2020 and PRISMA-DTA reporting principles14,15. Diagnostic and therapeutic questions were defined separately. For diagnostic questions, VAB/VABB was compared with CNB only within clinically comparable populations and with an identifiable reference standard. Therapeutic VAE evidence was evaluated separately by lesion category and study design. The protocol was registered in PROSPERO (CRD420267942964) on April 22, 2026, before the literature searches began on May 1, 2026. The review objectives, eligibility criteria, and principal outcomes were specified in advance. The final synthesis followed the protocol requirement for complete source verification before quantitative inclusion. During revision, exploratory analyses based on incompletely retrieved reports were confined to sensitivity comparisons, and clinically non-equivalent secondary outcomes were presented separately. These refinements did not change the review questions, eligibility criteria, or outcome definitions.
Eligibility Criteria
Original studies of women with breast lesions undergoing VAB/VABB, VAE, CNB, or surgical excision were eligible when the clinical indication, unit of analysis, comparator or reference standard, and outcome denominator could be identified. Diagnostic and therapeutic uses were evaluated separately. Extraction captured lesion pathology, imaging presentation, BI-RADS category, guidance modality, needle gauge, lesion size, verification method, and follow-up duration when reported. Reviews, editorials, technical notes without clinical outcomes, duplicate cohort reports, and reports without extractable event data were excluded from quantitative synthesis. Secondary reports from the same trial were mapped to one cohort and were not counted as independent efficacy evidence. Incompletely retrieved reports were retained for narrative context but were excluded from all revised quantitative syntheses.
Information Sources and Search
The reported search covered PubMed/MEDLINE, Embase, Web of Science Core Collection, the Cochrane Library, and Scopus from inception through May 15, 2026. The search yielded 3,847 database records (PubMed/MEDLINE: 1,150; Embase: 1,420; Web of Science Core Collection: 850; Scopus: 320; the Cochrane Library: 107) and 34 records from other sources (ClinicalTrials.gov: 12; citation searching: 22). A total of 1,190 duplicates were removed (1,050 via automated deduplication and 140 via manual verification), leaving 2,691 unique records for title and abstract screening. A standardized search strategy combining MeSH terms and free-text words was adapted for each database. The B3-focused PubMed search string was as follows: (((("Biopsy, Needle"[Mesh]) OR ("Vacuum-Assisted"[Title/Abstract])) AND ("Breast"[Mesh] OR "Breast Neoplasms"[Mesh] OR "breast lesion"[Title/Abstract])) OR ("vacuum-assisted breast biopsy"[Title/Abstract] OR "VABB"[Title/Abstract] OR "VAB"[Title/Abstract] OR "vacuum-assisted excision"[Title/Abstract] OR "VAE"[Title/Abstract])) AND ("B3 lesion"[Title/Abstract] OR "uncertain malignant potential"[Title/Abstract] OR "atypical ductal hyperplasia"[Title/Abstract]). Broader supplementary searches retained the breast and vacuum-assisted procedure concepts without requiring the B3/ADH block, allowing identification of diagnostic and therapeutic studies beyond B3 lesions. Results from the focused and supplementary searches were merged within each database before export. Supplementary File 1 provides the complete database-specific strategies, interfaces, fields, date limits, and source-level record counts. No language or study-design restrictions were applied. Xuejing Wang and Dr. Hua Li (from the same institution) screened records independently, with each reviewer unable to view the other reviewer’s eligibility decisions in Rayyan until both had completed the relevant screening stage. Data extraction was completed in separate copies of a standardized form before comparison and reconciliation. Authors, institutions, journals, and study results were not masked. Thus, blinding referred to the other reviewer’s decisions rather than to the identity or findings of the source reports. Inter-rater reliability during the full-text screening phase was excellent, with a Cohen’s kappa coefficient of 0.82.
Data Extraction and Provenance
A linked structure was used with one row per report in the evidence map and one row per report-outcome group in the extraction table. Extracted fields included country, design, population, number of patients, lesions or procedures, intervention, comparator or reference standard, follow-up, outcome definition, unit of analysis, events, denominator, evidence-access level, source locator, derivation rule, pooling status, cohort overlap, and quality-control notes. Every quantitative value was classified as directly reported, uniquely reconstructed, or unavailable. Event counts and denominators copied verbatim from a source were labelled directly reported. Values derived from an explicit false-negative count, a complete 2 × 2 table, or a rounded percentage were labelled reconstructed and were retained only when one integer solution was compatible with the stated denominator and rounding precision. Conflicting denominators were preserved in the quality-control record and excluded when they could not be reconciled.
Outcome Definitions
ADH underestimation was defined as upgrade from biopsy-diagnosed atypical ductal hyperplasia to ductal carcinoma in situ or invasive carcinoma at an appropriate reference standard. DCIS underestimation was defined as upgrade to invasive carcinoma. Diagnostic accuracy required reconstructable true-positive, false-negative, true-negative, and false-positive counts, with the reference standard and unit of analysis stated for each study. Macroscopic procedural removal, radiologic disappearance, histological absence of residual disease at surgery, negative surgical margins, and absence of recurrence were treated as non-equivalent outcomes. These endpoints were displayed at the study level and were not combined. Safety outcomes were synthesized narratively because definitions ranged from dressing-level oozing and pain to infection, re-intervention, hospitalization, or surgery.
Risk of Bias and Certainty of Evidence
The risk-of-bias assessment was conducted independently by the two reviewers (Wang and Li) using QUADAS-2 for diagnostic-accuracy studies, RoB 2 for the randomized trial, ROBINS-I for non-randomized comparative studies, and structured JBI critical-appraisal criteria for single-arm cohorts or case series. Each reviewer completed a separate assessment form before comparing judgments. Disagreements were resolved through discussion and re-examination of the relevant source material. Independent assessment and consensus reconciliation were completed on September 28, 2026. Sandhya et al. (S18)16 was assessed using JBI cohort criteria; the final high-risk judgment reflected selection and reporting concerns, including inconsistent recruited and treated denominators. Risk-of-bias judgments considered selection or randomization, the index test or intervention, the reference standard or outcome, flow or follow-up, and reporting, with an overall assessment assigned according to the design-specific appraisal tool. Certainty of evidence was assessed by outcome using GRADE principles adapted to diagnostic and observational evidence. The assessment considered risk of bias, inconsistency, indirectness, imprecision, and publication bias. Certainty was rated very low for malignant upgrade after diagnostic VAB/VABB, malignant upgrade detected at second-line VAE, post-VAE lesion-free or removal outcomes, and VAB diagnostic performance, and low for the randomized 7 G versus 10 G VAE comparison.
Statistical Analysis
The primary proportion synthesis included only fully retrieved studies of malignant upgrade after diagnostic VAB/VABB in B3 lesions. Study proportions were transformed to the logit scale. Between-study variance was estimated by the Paule-Mandel method, modified Hartung-Knapp 95% CIs used a variance scale constrained to at least 1, individual-study CIs were exact Clopper-Pearson intervals, and a 95% prediction interval was calculated. A 0.5 continuity correction was reserved for exploratory boundary-cell calculations and was not required for the revised primary full-text meta-analysis. Leave-one-out analysis assessed influence. Secondary modules were not pooled when the fully retrieved evidence was too sparse or when outcome definitions and selection pathways were not clinically comparable. Direct VAB-versus-CNB and 7G-versus-10G comparisons were reported as outcome-specific risk ratios with Wald 95% CIs. Diagnostic sensitivity and specificity were reported for the single fully retrieved study with reconstructable 2 × 2 data; the two incompletely retrieved diagnostic reports were not pooled. A bivariate or hierarchical summary receiver-operating-characteristic model was not estimable because only one fully retrieved cohort remained and the available studies did not provide an adequate distribution of false-positive counts. The revision analyses and figures were generated using the statistical programming environment and numerical-computing packages specified in the Table of Materials.
Results
Study Selection and Evidence Map
The source manuscript reported 3,847 database records and 34 records from other sources, 2,691 records after deduplication, 2,543 title-and-abstract exclusions, 148 reports assessed for full-text eligibility, 122 full-text exclusions, and 26 included reports. The arithmetic is internally consistent, and the reported exclusion categories sum to 122. The 26 reports were mapped to stable identifiers S01–S26. Eighteen reports were reviewed in complete PDF or HTML form, whereas eight reports remained incompletely retrieved and were excluded from quantitative synthesis. S20 and S21 were mapped to the same Swedish randomized trial; S20 contributed efficacy data, whereas S21 was retained only for patient-experience and cost context. Table 1 summarizes the characteristics and evidence-access status of the 26 included reports. Figure 1 shows the evidence-access and quantitative-inclusion pathway.
Table 1: Characteristics and evidence-access status of the 26 included reports. The table summarizes study country, design, population and sample, intervention and comparator or reference standard, primary outcome or analysis contribution, and evidence-access status. Evidence access reflects the revision audit: 18 reports were reviewed in full text and 8 remained incompletely retrieved. Incompletely retrieved reports were retained for narrative context but excluded from quantitative synthesis. S20 and S21 describe the same Swedish randomized trial; S21 was not counted as independent efficacy evidence. Sample units follow the source report and may represent patients, lesions, or procedures. B3, breast lesion of uncertain malignant potential; BI-RADS, Breast Imaging Reporting and Data System; CNB, core needle biopsy; DBT, digital breast tomosynthesis; EMR, electronic medical record; JATS, Journal Article Tag Suite; MRI, magnetic resonance imaging; PDF, Portable Document Format; RCT, randomized controlled trial; SE, surgical excision; US, ultrasound; UGVAE, ultrasound-guided vacuum-assisted excision; VAB, vacuum-assisted biopsy; VABB, vacuum-assisted breast biopsy; VAE, vacuum-assisted excision. Please click here to download this file.
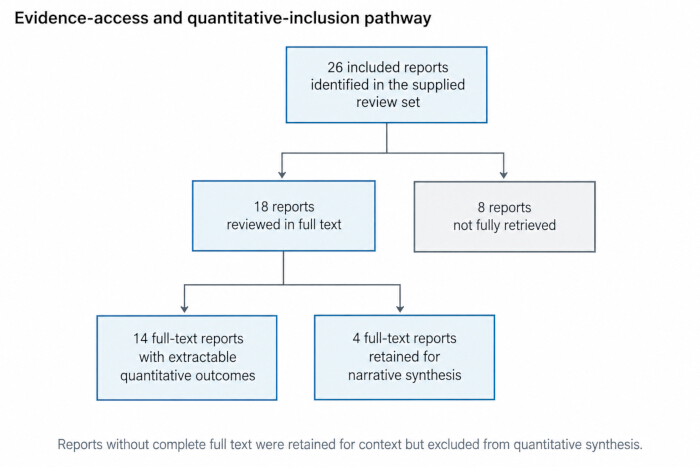
Figure 1: Evidence-access and quantitative-inclusion pathway. Of the 26 included reports, 18 were reviewed in complete full text and 8 remained incompletely retrieved. Among the 18 fully retrieved reports, 14 contained extractable quantitative outcomes and 4 contributed narrative evidence. Reports without complete full text were retained for narrative context but excluded from quantitative synthesis. Please click here to view a larger version of this figure.
Full-Text Availability and Quantitative Eligibility:
The revised quantitative analyses used only the 18 fully retrieved reports. The incompletely retrieved reports were S03, S06, S07, S09, S10, S21, S22, and S24. Of these, S03 and S06 had contributed to the exploratory diagnostic pool, S09 to the B3-after-VAB pool, S10 to the second-line VAE pool, and S22 to the lesion-free pool. Their exclusion was examined explicitly. For the primary B3-after-VAB analysis, the pooled estimate changed from 12.1% with six accessible reports to 11.2% with five fully retrieved reports, without changing the clinical interpretation.
Risk of Bias and Certainty
The dual-reviewer audit identified substantial selection, verification, flow, and reporting concerns across the evidence base. These judgments were used to calibrate interpretation and GRADE ratings. Table 2 reflects the final consensus ratings of the dual-reviewer assessment. The certainty assessment rated the principal observational outcomes as very low because of serious risk of bias, inconsistency or non-comparability, indirectness, and imprecision. The 7G-versus-10G randomized comparison was rated low because it was supported by a single trial with later attrition and imprecise estimates.
Table 2: Study-level risk-of-bias assessment using design-specific appraisal tools. QUADAS-2 was used for diagnostic-accuracy studies, RoB 2 for the randomized trial, ROBINS-I for non-randomized comparative studies, and structured JBI critical-appraisal criteria for single-arm cohort and case-series reports. Judgments summarize selection or randomization, index test or intervention, reference standard or outcome, flow or follow-up, reporting, and overall risk of bias. Independent assessments by Wang and Li and consensus reconciliation were completed on September 28, 2026; the table presents the final consensus judgments. The asterisks for S06 and S24 indicate that the assessments were based on abstracts and available report information because complete full texts could not be retrieved; the asterisks denote an evidence-access limitation, not a separate risk category. These reports were excluded from quantitative synthesis. BI-RADS, Breast Imaging Reporting and Data System; CNB, core needle biopsy; EMR, electronic medical record; JBI, Joanna Briggs Institute; MDT, multidisciplinary team; MRI, magnetic resonance imaging; QUADAS-2, Quality Assessment of Diagnostic Accuracy Studies 2; RoB 2, Risk of Bias 2; ROBINS-I, Risk Of Bias In Non-randomized Studies of Interventions; SE, surgical excision; VAB, vacuum-assisted biopsy; VAE, vacuum-assisted excision. Please click here to download this file.
Diagnostic Evidence
Only Moustafa et al. provided fully retrieved and reconstructable diagnostic 2 × 2 data. VAB sensitivity was 39/43, or 90.7% (exact 95% CI, 77.9%–97.4%), and specificity was 93/93, or 100.0% (95% CI, 96.1%–100.0%). The two incompletely retrieved diagnostic reports were retained only for narrative context. No pooled sensitivity, pooled specificity, summary ROC curve, or hierarchical diagnostic model was calculated. For the Moustafa et al. comparison, 20 CNB false negatives among 132 lesions were used in the primary calculation because this count was consistent with the reported sensitivity and diagnostic accuracy (31 true positives, 81 true negatives, and no false positives). With 4/136 VAB events, the RR was 0.19 (95% CI, 0.07–0.55). The narrative count of 21 CNB nonmatching cases was evaluated separately in a sensitivity analysis (RR, 0.18; 95% CI, 0.07–0.52), with no change in interpretation. Both analyses used all biopsied lesions as the denominator. Five fully retrieved B3 cohorts contributed 98 malignant upgrades among 844 lesions after diagnostic VAB/VABB. The pooled proportion was 11.23% (95% CI, 7.22%–17.04%; 95% prediction interval, 4.56%–25.06%), with substantial heterogeneity (I2 = 60.8%; τ2 = 0.063; Q = 10.20, df = 4, P = 0.037). Leave-one-out estimates ranged from 9.0% to 13.0%, indicating that no single study reversed the central finding, although the prediction interval shows meaningful between-setting variation. Figure 2 presents the study-specific and pooled malignant-upgrade proportions, and Table 3 summarizes the primary synthesis, secondary analyses, sensitivity analyses, and direct comparisons.
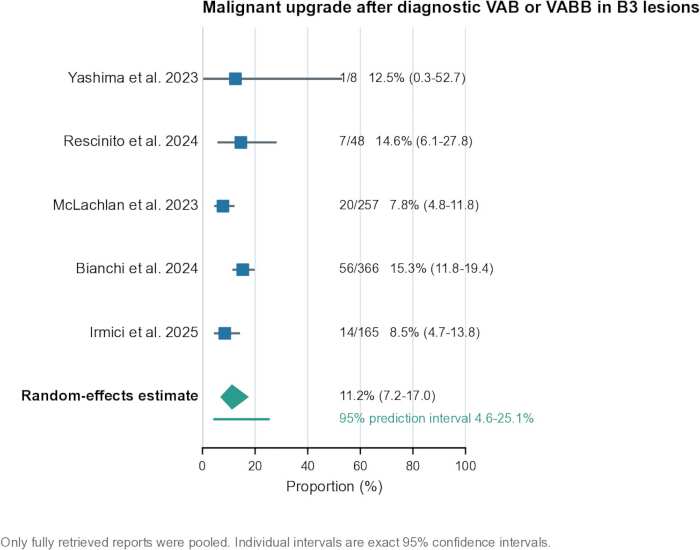
Figure 2: Malignant upgrade after diagnostic vacuum-assisted biopsy or vacuum-assisted breast biopsy in B3 lesions. Five fully retrieved studies contributed 98 malignant upgrades among 844 lesions. The random-effects pooled proportion was 11.2% (95% confidence interval [CI], 7.2%-17.0%), with a 95% prediction interval of 4.6%-25.1% and I2 = 60.8%. Squares indicate study-specific proportions, horizontal lines indicate exact 95% CIs, and the diamond indicates the pooled estimate. Only fully retrieved reports were included in the pooled analysis. Please click here to view a larger version of this figure.
Table 3: Primary meta-analysis, study-specific secondary analyses, sensitivity analyses, and direct comparisons. The primary random-effects synthesis included five fully retrieved studies reporting malignant upgrade after diagnostic VAB/VABB in B3 lesions. Second-line VAE outcomes and post-VAE outcomes with non-equivalent definitions were reported as study-specific estimates without pooled effects. Diagnostic performance was reported for the single fully retrieved study with reconstructable diagnostic data. Access-level and event-count sensitivity analyses evaluated the effects of evidence availability and alternative event counts, respectively. Direct observational and randomized comparisons are presented as outcome-specific risk ratios and were not pooled across clinically distinct outcomes. The 6- and 24-month randomized-trial estimates should be interpreted in light of attrition. B3, breast lesion of uncertain malignant potential; CI, confidence interval; CNB, core needle biopsy; DCIS, ductal carcinoma in situ; G, gauge; k, number of studies; Q, Cochran Q statistic; τ2, between-study variance; I2, proportion of variability attributable to between-study heterogeneity; VAB, vacuum-assisted biopsy; VABB, vacuum-assisted breast biopsy; VAE, vacuum-assisted excision. Please click here to download this file.
Therapeutic and Safety Evidence
Three fully retrieved studies of malignant upgrade detected at second-line VAE contributed 44 events among 607 lesions. Study-specific estimates ranged from 5.1% to 21.4%. Because selection pathways, pathology mix, and verification differed and an exploratory heterogeneity calculation was extreme (I2 = 90.3%), no pooled summary was retained. These estimates describe selected second-line pathways and should not be compared directly with the primary diagnostic VAB/VABB estimate. Figure 3 presents the study-specific second-line VAE estimates. Five fully retrieved VAE cohorts reported post-procedure proportions from 86.0% to 99.2%. The endpoints included 6-month lesion-free status, absence of fibroadenoma recurrence, absence of residual lesion, local recurrence-free status, and radiologic removal. Figure 4 presents these results individually. No pooled lesion-free or complete-excision estimate was calculated because the outcomes and follow-up intervals were not equivalent. The diagnostic performance results described above are presented in Figure 5. Only the Moustafa et al. cohort provided fully retrieved and reconstructable diagnostic 2 × 2 data, and no diagnostic meta-analysis was performed. The Swedish study was the only randomized evidence. It compared 7G with 10G VAE. Immediate complete excision was 85/97 versus 89/97 (RR, 0.96; 95% CI, 0.87–1.05), 6-month lesion-free status was 75/83 versus 66/81 (RR, 1.11; 95% CI, 0.98–1.26), and 24-month lesion-free status was 56/60 versus 56/67 (RR, 1.12; 95% CI, 0.98–1.27). None of the CIs excluded no difference. Attrition increased from 15% at 6 months to approximately 35% at 24 months, which limits the later comparison. Figure 6A presents the outcome-specific observational VAB-versus-CNB comparisons, including high-risk upgrade, re-biopsy, specimen failure, DCIS-to-invasive upgrade, and re-operation. Figure 6B presents the randomized 7G-versus-10G VAE comparison for immediate complete excision and lesion-free status at 6 and 24 months. Later estimates should be interpreted in light of attrition. Safety was synthesized narratively because definitions ranged from dressing-level oozing, pain, and ecchymosis to infection, re-intervention, hospitalization, or surgery. Several reports observed no major complications, whereas others counted common minor events. Combining these endpoints would produce a clinically uninterpretable rate; exact study-level safety counts remain available in the extraction workbook.
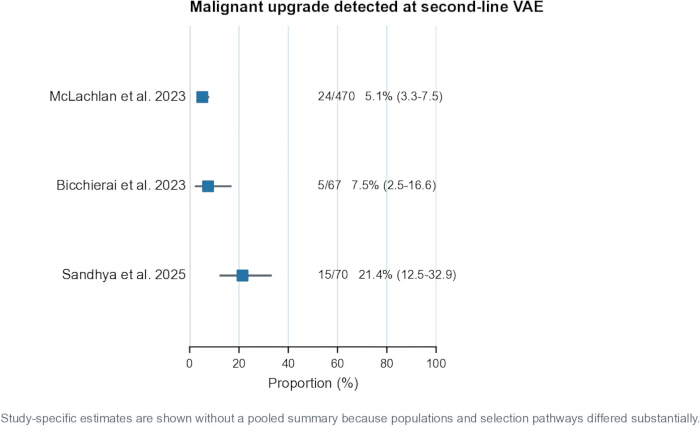
Figure 3: Malignant upgrade detected at second-line vacuum-assisted excision. Three fully retrieved studies contributed 44 malignant upgrades among 607 lesions, with study-specific proportions ranging from 5.1% to 21.4%. Squares indicate study-specific proportions and horizontal lines indicate 95% confidence intervals. No pooled estimate is shown because populations, selection pathways, and verification methods differed substantially. Please click here to view a larger version of this figure.
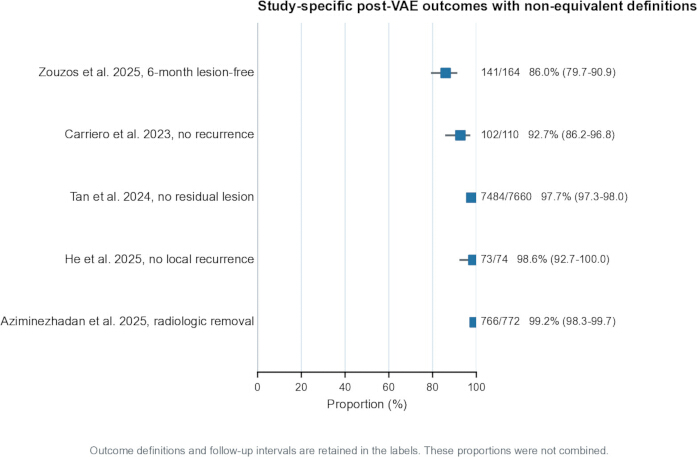
Figure 4: Study-specific post-vacuum-assisted excision outcomes with non-equivalent definitions. Five fully retrieved cohorts reported 6-month lesion-free status, absence of recurrence, absence of residual lesion, local recurrence-free status, or radiologic removal. Squares indicate study-specific proportions and horizontal lines indicate 95% confidence intervals. Outcomes and follow-up intervals were not equivalent; therefore, the proportions were displayed separately and were not pooled. Please click here to view a larger version of this figure.
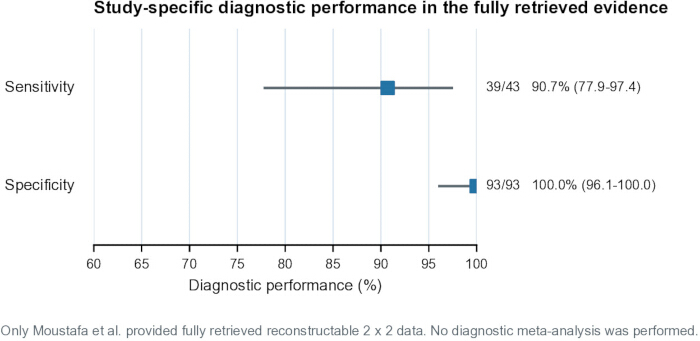
Figure 5: Study-specific diagnostic performance in the fully retrieved evidence. Moustafa et al. provided the only fully retrieved study with reconstructable 2 × 2 diagnostic data. Sensitivity was 90.7% (39/43; 95% confidence interval [CI], 77.9%-97.4%), and specificity was 100.0% (93/93; 95% CI, 96.1%-100.0%). Squares indicate point estimates and horizontal lines indicate 95% CIs. No diagnostic meta-analysis was performed. Please click here to view a larger version of this figure.
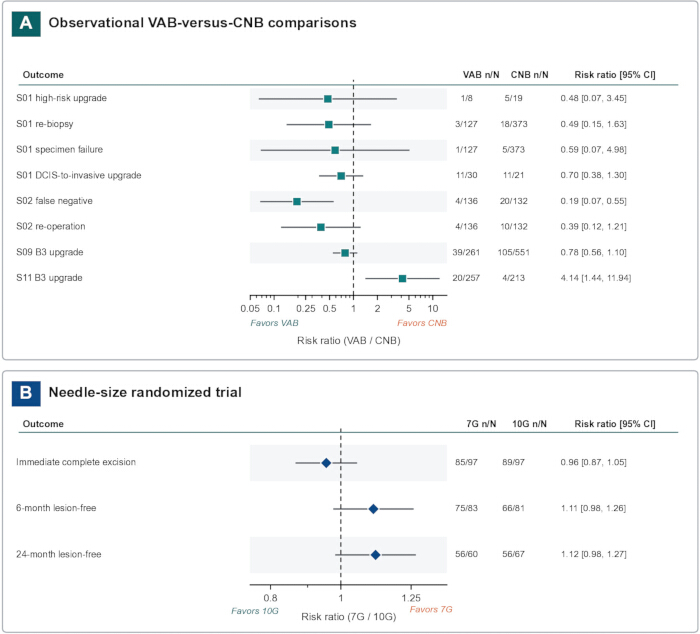
Figure 6: Outcome-specific direct comparisons. (A) Observational comparisons of vacuum-assisted biopsy (VAB) versus core needle biopsy (CNB) are presented as outcome-specific risk ratios with 95% confidence intervals (CIs), without an across-outcome pooled effect. (B) Immediate complete excision, 6-month lesion-free status, and 24-month lesion-free status are presented as risk ratios with 95% CIs for 7-gauge (7G) versus 10-gauge (10G) vacuum-assisted excision in the single Swedish randomized trial. Later time-point estimates should be interpreted in light of attrition. DCIS, ductal carcinoma in situ. Please click here to view a larger version of this figure.
Sensitivity and Influence Analyses
No subgroup meta-regression was performed because the primary full-text module contained five studies and moderator definitions were sparse. The prediction interval and study-level results were emphasized instead of treating the pooled mean as a universal clinical value. Secondary modules with extreme heterogeneity or non-equivalent outcome definitions were not pooled. Leave-one-out analysis of the primary full-text B3-after-VAB synthesis produced pooled estimates from 9.0% to 13.0%. Omitting McLachlan et al. produced the highest estimate, whereas omitting Bianchi et al. produced the lowest. No omission changed the conclusion that malignant upgrade remains clinically relevant and variable across settings. Funnel plots and Egger or Begg tests were not performed because no coherent quantitative module contained at least 10 studies. With five studies and appreciable clinical heterogeneity, asymmetry tests would be underpowered and would not distinguish reporting effects from genuine case-mix differences. Table 4 summarizes the certainty-of-evidence assessment for the principal outcomes.
Table 4: Certainty-of-evidence assessment for the principal outcomes. Certainty of evidence was assessed by outcome using GRADE principles adapted to diagnostic and observational evidence, considering risk of bias, inconsistency, indirectness, imprecision, publication bias, number of studies, and unit of analysis. Certainty was rated very low for the principal observational outcomes and low for the single randomized comparison. Outcomes with clinically non-equivalent definitions were not pooled, and inconsistency was not assessable when only one fully retrieved study contributed evidence. Publication bias was not formally assessable when evidence was limited to a single study and was considered undetected but too sparsely informed for assessment when only a small number of studies were available. Later follow-up in the randomized comparison should be interpreted in light of attrition. G, gauge; GRADE, Grading of Recommendations Assessment, Development and Evaluation; VAB, vacuum-assisted biopsy; VABB, vacuum-assisted breast biopsy; VAE, vacuum-assisted excision. Please click here to download this file.
Overall, the results support pathway-specific interpretation of the evidence. The fully retrieved evidence provided a quantitative estimate for malignant upgrade after diagnostic VAB/VABB in B3 lesions, whereas second-line VAE, post-VAE outcomes, diagnostic performance, safety, and randomized needle-size comparisons required study-specific or narrative interpretation because of sparse evidence, non-equivalent outcomes, or differences in clinical pathways. The substantial heterogeneity and very low certainty of the principal observational outcomes limit interpretation of the pooled estimate as a universal clinical value.
Data Availability
The study-level extraction and analysis materials supporting this reconstruction are available at https://doi.org/10.5281/zenodo.21821545 and https://zenodo.org/records/23066760. No patient-level data were generated or used. The revised tables identify directly reported values, reconstructed values, evidence-access status, unit of analysis, and quantitative eligibility.
Supplementary File 1: Complete literature search strategies and record management. Database-specific focused and broader search strategies are provided for PubMed/MEDLINE, Embase, Web of Science Core Collection, the Cochrane Library, and Scopus, including the search interfaces, field specifications, search dates, and source-level record counts. Search procedures for ClinicalTrials.gov and citation searching are also provided, together with the record-management and deduplication process. Searches were conducted from May 1 to May 15, 2026, with database coverage from inception through May 15, 2026. Please click here to download this file.
Discussion
The revised synthesis supports one quantitatively defensible pooled question: malignant upgrade after diagnostic VAB/VABB in B3 lesions among fully retrieved studies. Secondary questions concerning second-line VAE, post-VAE lesion status, diagnostic performance, and direct comparisons were retained as separate modules. This structure avoids treating single-arm proportions as comparative effectiveness and avoids combining outcomes that differ in clinical meaning. Across the included evidence, studies addressed diagnostic sampling, radiologic-pathologic discordance, MRI- and tomosynthesis-guided procedures, B3 management, and percutaneous excision in different clinical settings17,18,19,20,21,22,23,24,25,26,27,28. The primary pooled upgrade proportion was 11.2%, but the 95% prediction interval ranged from 4.6% to 25.1%. This interval is more clinically informative than the pooled mean alone because lesion subtype, radiologic-pathologic concordance, sampling method, and verification pathways differ across settings. The estimate should therefore inform counseling and pathway design rather than serve as a universal threshold.
Malignant upgrade detected at second-line VAE varied from 5.1% to 21.4% across three fully retrieved studies. This range cannot be interpreted as lower than the diagnostic VAB/VABB estimate because the modules represent different points in care and use different selection mechanisms. The broad variation is consistent with clinically important differences in pathology mix and multidisciplinary selection. The wider evidence base also included studies examining VAE or related vacuum-assisted procedures for fibroadenomas, breast cancers, benign lesions, and high-risk or B3 lesions, as well as follow-up after vacuum-assisted management29,30,31,32,33,34. The high proportions reported after VAE represented different endpoints. Immediate radiologic removal, absence of residual lesion, and recurrence-free follow-up do not establish the same form of efficacy. Presenting them separately prevents a high average value from being mistaken for durable oncologic control. The Swedish trial provides the only randomized evidence and did not show a conclusive difference between 7G and 10G at any time point; later results are weakened by attrition35,36. S20 and S21 represented the same Swedish randomized trial; therefore, S21 was not treated as independent efficacy evidence.
The diagnostic evidence is particularly limited. Only one fully retrieved study yielded reconstructable 2 × 2 data, and all available cohorts had restricted spectra and heterogeneous reference standards. Missing or uniformly zero false-positive counts make specificity estimates boundary-dependent and prevent a stable bivariate or hierarchical model. The study-specific sensitivity and specificity should not be generalized to broader screening or diagnostic populations. Other included reports evaluated vacuum-assisted biopsy or excision in different procedural and clinical settings, including surgeon-performed procedures, ultrasound-guided excision of benign lesions, outpatient management, and tomosynthesis-guided management of B3 lesions37,38,39,40,41. These studies broaden the clinical contexts represented in the review but do not overcome the limitations of the diagnostic-accuracy evidence. Certainty was very low for the observational outcomes because risk of bias, inconsistency, indirectness, and imprecision accumulated across small and selected evidence modules. Eight reports remained incompletely retrieved and were excluded from quantitative analysis. Additional limitations include variable units of analysis, incomplete verification, and reconstructed counts across the included studies.
Other approaches could address these limitations by evaluating diagnostic and therapeutic pathways separately using prospectively defined outcomes and more complete verification. The present modular approach provides an alternative to combining clinically dissimilar studies into a single summary estimate and allows diagnostic VAB/VABB, second-line VAE, post-VAE outcomes, diagnostic performance, and direct comparisons to be interpreted according to their respective designs. This distinction is relevant because current consensus recommendations and European guidance describe management of B3 lesions according to lesion subtype and clinical context rather than as a single uniform pathway7,8. The separation of non-equivalent outcomes is particularly important because immediate radiologic removal, absence of residual lesion, and recurrence-free follow-up represent different outcomes and should not be interpreted as interchangeable measures of efficacy.
Clinically, VAB/VABB and VAE should be selected according to lesion category, imaging-pathology concordance, intended diagnostic or therapeutic role, and the availability of surgical or imaging verification. Patients should be informed that malignant upgrade remains possible even after extensive sampling or apparent lesion removal. Decisions concerning surveillance, repeat percutaneous sampling, VAE, or surgical excision should be made in a multidisciplinary setting and should incorporate pathology subtype, imaging features, patient preferences, and the local ability to provide reliable follow-up4,7,8,9,10. These implications should nevertheless be interpreted cautiously because the evidence modules differ in population selection, verification, outcome definition, and follow-up, and the available evidence does not establish that radiologic or procedural removal is equivalent to durable oncologic control.
This exploratory reconstruction suggests that malignant upgrade after diagnostic VAB/VABB remains clinically important and varies across lesion characteristics and selection pathways. Highly heterogeneous second-line VAE and post-VAE outcomes are more appropriately interpreted at the study level than as universal pooled effects. The available evidence does not support claims of universal superiority over CNB or equivalence to surgical excision. Future research may also clarify the role of vacuum-assisted approaches in additional settings. Related studies have examined risk stratification of atypical ductal hyperplasia after VAB, VAE of selected small breast cancers, and modified vacuum-assisted excision techniques, while prospective research has addressed or proposed comparisons with open surgery, active monitoring of selected low-risk DCIS, and VAE for selected small early breast cancers42,43,44,45,46,47. These studies represent related or emerging applications and should not be interpreted as evidence of equivalence between VAE and surgical excision or as contributing to the quantitative B3 synthesis reported here. Future prospectively registered reviews should use complete full-text retrieval, duplicate independent assessment, harmonized outcomes, and transparent search archives. These measures would improve reproducibility and allow future evidence syntheses to determine more reliably which lesion- and pathway-specific outcomes can be combined.
Disclosures
Conflict of Interest:
The author declares no competing interests.
Acknowledgements
The author thanks Dr. Hua Li for independently conducting literature screening, data extraction, and risk-of-bias assessment and for contributing to consensus resolution.
Materials
| Name | Company | Catalog Number | Comments |
|---|---|---|---|
| ClinicalTrials.gov | U.S. National Library of Medicine | Web database; accessed May 15, 2026; https://clinicaltrials.gov | Additional systematic search source; 12 records identified |
| Cochrane Library | Wiley | Web database; accessed May 15, 2026; https://www.cochranelibrary.com | Systematic search source; coverage from inception through May 15, 2026 |
| Embase | Elsevier | Embase.com; accessed May 15, 2026; https://www.embase.com | Systematic search source; coverage from inception through May 15, 2026 |
| EndNote | Clarivate | EndNote 21; https://endnote.com | Automated deduplication of retrieved records |
| JBI critical appraisal checklists | JBI | Cohort and case-series checklists (2017); https://jbi.global/critical-appraisal-tools | Structured appraisal of eligible cohort and case-series reports |
| NumPy | NumPy Developers | Version 2.3.5; RRID:SCR_008633 | Numerical array calculations |
| PROSPERO | National Institute for Health and Care Research | CRD420267942964; registered April 22, 2026 | Prospective protocol registration before the literature searches began on May 1, 2026 |
| PubMed/MEDLINE | National Library of Medicine | PubMed web interface; RRID:SCR_004846 | Systematic search source; coverage from inception through May 15, 2026 |
| Python | Python Software Foundation | Version 3.12.14; RRID:SCR_008394 | Statistical analysis and figure generation |
| QUADAS-2 | University of Bristol | QUADAS-2 (2011); https://www.bristol.ac.uk/population-health-sciences/projects/quadas/history/quadas-2/ | Diagnostic-accuracy risk-of-bias and applicability assessment |
| Rayyan | Rayyan Systems Inc. | Web application; accessed May 15, 2026; RRID:SCR_017584 | Independent screening with reviewer decisions masked; duplicate checking |
| RoB 2 | Cochrane Methods | Parallel-group randomized trials, August 22, 2019; https://www.riskofbias.info | Risk-of-bias assessment for the randomized trial |
| ROBINS-I | Cochrane Methods | Original ROBINS-I (2016); https://www.riskofbias.info | Risk-of-bias assessment for non-randomized comparative studies |
| SciPy | SciPy Developers | Version 1.18.1; RRID:SCR_008058 | Exact intervals, distributions, and numerical optimization |
| Scopus | Elsevier | Web interface; accessed May 15, 2026; https://www.scopus.com | Systematic search source; coverage from inception through May 15, 2026 |
| Web of Science Core Collection | Clarivate | Core Collection web interface; accessed May 15, 2026; https://www.webofscience.com | Systematic search source; coverage from inception through May 15, 2026 |
References
- Zhang Y, Li J, Mo M. The comparison of efficacy and safety evaluation of vacuum-assisted Elite 10-G system and the traditional BARD 14-G core needle in breast diagnosis: an open-label, parallel, randomized controlled trial. Int J Surg. 2023;109(5):1180-7.
- Wang O et al. A multicenter, randomized, controlled study of the breast biopsy and circumferential excision system for breast lesions. Clin Breast Cancer. 2023;23(6):640-8.
- Rosenberger LH, White RL, Tafra L. American Society of Breast Surgeons and Society of Breast Imaging 2025 guidelines for the management of benign breast fibroepithelial lesions. JAMA Surg. 2025;160(12):1378-85.
- Corsi F et al. Management of B3 breast lesions: potential clinical implications from a retrospective study conducted in an accredited Breast Unit following the 2024 EUSOMA guidelines. Eur J Surg Oncol. 2025;51(3):109579.
- Sanderink WBG, Camps-Herrero J, Athanasiou A. Image-guided biopsy of breast lesions-when to use what biopsy technique. Insights Imaging. 2025;16(1):208.
- Yoen H et al. Hemorrhagic complications following ultrasound-guided breast biopsy: a prospective patient-centered study. Korean J Radiol. 2024;25(2):157-65.
- Rubio IT, Wyld L, Marotti L. European guidelines for the diagnosis, treatment and follow-up of breast lesions with uncertain malignant potential (B3 lesions) developed jointly by EUSOMA, EUSOBI, ESP (BWG) and ESSO. Eur J Surg Oncol. 2024;50(1):107292.
- Elfgen C, Leo C, Kubik-Huch RA. Third International Consensus Conference on lesions of uncertain malignant potential in the breast (B3 lesions). Virchows Arch. 2023;483:5-20.
- Shaaban AM, McMahon MA, Sharma N. Recent advances in the diagnosis and management of B3 lesions. Diagn Histopathol. 2025;31(3):145-51.
- Linhares LMA et al. Vacuum-assisted biopsy and excision of breast lesions: review and current indications. Mastology. 2025;35.
- Sharma N, Theis S, Vogelmann T, Pijnappel R. Vacuum-assisted breast biopsy vs core needle biopsy: a systematic review and meta-analysis. Eur Radiol. 2026;36(6):4449-66.
- Yoo HS, Kang WS, Pyo JS, Yoon J. Efficacy and safety of vacuum-assisted excision for benign breast mass lesion: a meta-analysis. Medicina. 2021;57(11):1260.
- Gil MLBV et al. Vacuum-assisted excision: a safe minimally invasive option for benign phyllodes tumor diagnosis and treatment-a systematic review and meta-analysis. Front Oncol. 2024;14:1394116.
- Page MJ et al. The PRISMA 2020 statement: an updated guideline for reporting systematic reviews. BMJ. 2021;372:n71.
- McInnes MDF et al. Preferred reporting items for a systematic review and meta-analysis of diagnostic test accuracy studies: the PRISMA-DTA statement. JAMA. 2018;319(4):388-96.
- Sandhya A, Tahir QUA, Veerapatheran K. Vacuum-assisted excision of B3 lesions: a district general hospital experience. Indian J Radiol Imaging. 2024;35(2):326-31.
- Yashima Y, Fujioka T, Kubota K. Comparison of the clinical and pathological characteristics of ultrasound-guided biopsy for breast masses and non-mass lesions between 16-gauge spring-loaded core needle biopsy and 12-gauge spring-loaded vacuum-assisted biopsy. J Med Ultrason. 2023;50:205-12.
- Moustafa AFI, Emam MM, Mokhtar O. Adding merits of vacuum assisted biopsy in diagnosis and management of indeterminate breast micro-calcifications. Egypt J Radiol Nucl Med. 2024;55:26.
- Vatteroni G, Pinna G, Trimboli RM. Role of ultrasound-guided vacuum-assisted breast biopsy in the management of radiologic-pathologic discordance: a retrospective single-centre study. Radiol Med. 2024;129(10):1454-62.
- Zhu Y et al. Vacuum-assisted biopsy system for breast lesions: a potential therapeutic approach. Front Oncol. 2023;13:1230083.
- Rescinito G et al. Long-term outcome of 9G MRI-guided vacuum-assisted breast biopsy: results of 293 single-center procedures and underestimation rate of high-risk lesions over 12 years. Radiol Med. 2024;129(5):767-75.
- Suman L, D'Ascoli E, Depretto C. Diagnostic performance of MRI-guided vacuum-assisted breast biopsy (VABB): an essential but still underused technique. Breast Cancer Res Treat. 2025;210(2):417-23.
- Kasahara M et al. Clinical benefits of tomosynthesis-guided vacuum assisted breast biopsy: a comparison with stereotactic vacuum assisted biopsy. Breast Cancer. 2024;31(2):329-34.
- van de Voort EM, Struik GM, Birnie E. Implementation of vacuum-assisted excision as a management option for benign and high-risk breast lesions. Br J Radiol. 2023;96(1147):20220776.
- Willers N, Neven P, Floris G. The upgrade risk of B3 lesions to (pre)invasive breast cancer after diagnosis on core needle or vacuum assisted biopsy: a Belgian national cohort study. Clin Breast Cancer. 2023;23(4):e273-80.
- Watson JF et al. Vacuum-assisted excision biopsy for definitive diagnosis of breast lesions of uncertain malignant potential (B3 lesions) on core biopsy-a single centre Western Australian experience. J Med Imaging Radiat Oncol. 2023;67(4):365-76.
- McLachlan C, Jackson M, Valencia A. Evaluating the use of vacuum-assisted excisions in the management of B3 breast lesions. Br J Radiol. 2023;96(1151):20230528.
- Bicchierai G et al. Percutaneous vacuum-assisted excision (VAE) of breast lesions of uncertain malignant potential (B3 lesions): a preliminary single-centre Italian experience. Radiol Med. 2023;128(5):528-36.
- Carriero S, Depretto C, Cozzi A. Efficacy and safety of vacuum-assisted excision (VAE) of fibroadenomas: experience in a tertiary centre. Radiol Med. 2023;128:1199-205.
- Valadares CN et al. Potential role of vacuum-assisted procedures in resecting breast cancers and highlighting selection criteria to support future trials. Front Oncol. 2023;13:1239574.
- Tan X, Xuhong J, Ai X. Effectiveness of ultrasound-guided vacuum-assisted excision for treating benign breast lesions. Cancer Innov. 2024;4(1):e158.
- Elfgen C et al. Long-term follow-up of high-risk breast lesions at vacuum-assisted biopsy without subsequent surgical resection. Breast Care. 2024;19(1):62-72.
- Bianchi S et al. Upgrade rate to malignancy of uncertain malignant potential breast lesions (B3 lesions) diagnosed on vacuum-assisted biopsy (VAB) in screen detected microcalcifications: analysis of 366 cases from a single institution. Eur J Radiol. 2024;170:111258.
- Irmici G et al. Influence of complete lesion removal during vacuum-assisted breast biopsy on the upgrade rate of B3 lesions presenting as microcalcifications. J Clin Med. 2025;14(5):1513.
- Zouzos A et al. Effect of needle size on outcomes of vacuum-assisted excision of breast lesions: a randomized controlled trial. Eur J Radiol. 2025;183:111895.
- Zouzos A et al. Patient experience and healthcare cost aspects of vacuum-assisted excision of breast lesions: a report from the Swedish VAE randomized clinical trial. Eur J Radiol. 2025;186:112062.
- Poels D et al. Surgeon performed vacuum assisted breast biopsy/excision is a viable paradigm for the management of benign and B3 lesions-an Australian multicenter experience. World J Surg. 2025;49(12):3343-9.
- Aziminezhadan P, Pouramini A, Ghassemof H. Ultrasound-guided seven-gauge vacuum-assisted excision for benign breast lesions: a single expert surgeon experience. Ultrasound. 2025;33(4):291-300.
- Wang S, Zhang H, Lin J. Clinical efficacy and psychological benefits of ultrasound-guided vacuum-assisted excision in outpatient management of benign breast lesions. Eur J Surg Oncol. 2025;51(12):110498.
- He Y et al. Clinical outcomes of ultrasound-guided mammotome vacuum-assisted excision for benign breast tumors and its impact on serum tumor markers. BMC Surg. 2025;25(1):565.
- Zujic PV et al. Tomosynthesis-guided vacuum-assisted excision of B3 breast lesions: reducing overtreatment without compromising safety. Eur J Breast Health. 2026;22(2):190.
- Rella R et al. Atypical ductal hyperplasia on vacuum-assisted breast biopsy: a scoring system to predict the risk of upgrade to malignancy. Radiol Med. 2024;129(1):38-47.
- Björnström M et al. Vacuum-assisted excision of small breast cancers under ultrasound guidance. Eur J Radiol. 2023;167:111049.
- Rella R et al. Improved evaluation of patients with small clusters of microcalcifications on mammograms: implementation of vacuum assisted excision with “cavity margins shaving” technique. Eur J Radiol. 2025;188:112138.
- Elder K et al. SMALL: open surgery versus minimally invasive vacuum-assisted excision for small screen-detected breast cancer-protocol for a phase III randomised multicentre trial. BMJ Open. 2025;15(4):e099702.
- Couto HL et al. Vacuum-assisted biopsy in the era of low-risk ductal carcinoma in situ active monitoring: real-world data and implications. Front Oncol. 2025;15:1618476.
- Couto HL et al. Vacuum-assisted excision: one-step approach to the diagnosis and percutaneous treatment of small early breast cancer-the VAE-BREAST 01 study protocol. Front Oncol. 2025;15:1687634.