This protocol enables reliable isolation of viable ventricular cardiomyocytes from the short-lived annual killifish, Nothobranchius furzeri, across age groups, yielding cells suitable for whole-cell patch-clamp studies of age-associated cardiac remodeling.
Method Article
Isolation of Ventricular Cardiomyocytes from the Annual Killifish Nothobranchius furzeri for Whole-Cell Patch Clamp Recordings
In This Article
Summary
Abstract
Isolated working cardiomyocytes remain the standard approach for studying cardiac electrophysiology. Single-cell preparations allow for direct investigation and precise measurement of ionic currents and action potentials without the structural complexity of intact cardiac tissue. Nothobranchius furzeri (African turquoise killifish) has rapidly emerged as a prominent model organism for gerontological research due to its exceptionally short lifespan and similarities in aging mechanisms with mammals, including humans. This species combines practical advantages such as small size, inexpensive husbandry, and a rapid life cycle with translational relevance. N. furzeri exhibits age-dependent declines in locomotor activity, cognition, and organ function, accumulation of molecular hallmarks of aging, and sensitivity to pharmacological treatments that modulate lifespan and healthspan. However, investigating the functional decline of the aging heart requires a reliable method to obtain high-quality, viable cells suitable for demanding single-cell techniques. This study optimized a previously described protocol for the isolation of Danio rerio cardiomyocytes to ensure consistent recovery of healthy working myocytes from both young and senescent N. furzeri. This protocol describes the isolation of ventricular cardiomyocytes from N. furzeri specifically optimized for the whole-cell patch clamp technique. The article demonstrates how to efficiently excise the heart, perform enzymatic dissociation of the myocardium by retrograde perfusion, and store the isolated cardiomyocytes. We discuss the selection of enzymes required to digest the extracellular matrix and intercellular junctions without compromising ion channel structure. Freshly isolated cardiomyocytes are suitable for high-resolution electrophysiological assays, including action potential recordings and measurements of major inward and outward ionic currents across age groups. The article also addresses the features of cardiomyocyte isolation in fish that differ from standard mammalian isolation procedures.
Introduction
Age-dependent functional decline of the heart is driven by structural, molecular, and electrophysiological remodeling, which collectively impairs cardiac reserve and elevates susceptibility to arrhythmogenesis1. To understand the mechanisms driving cardiac aging at the cellular level, the whole-cell patch clamp technique serves as an indispensable experimental tool. It enables direct, quantitative evaluation of individual transmembrane ionic currents and their kinetics, as well as action potentials (AP), providing insight into the specific ionic-current alterations that underlie age-associated myocardial dysfunction. Investigating these mechanisms requires reliable vertebrate models of cardiac senescence. In recent years, the African turquoise killifish (Nothobranchius furzeri) has emerged as a promising model for studying cardiac aging owing to its naturally short lifespan2,3. Preliminary molecular and histological studies have revealed similarities in aging processes between Nothobranchius and mammals. Investigations conducted by other groups have established that N. furzeri possesses essential hallmarks of mammalian cardiac aging, including telomere attrition, reduced mitochondrial DNA content and antioxidant enzyme expression, structural and electrophysiological myocardial alterations, and the accumulation of aging markers such as lipofuscin and elevated β-galactosidase activity4,5,6.
However, despite the growing prominence of N. furzeri in cardiovascular research, detailed electrophysiological characterization at the single-cell level is limited by persistent technical challenges. Obtaining high-quality patch clamp recordings strictly depends on isolating working cardiomyocytes that maintain structural integrity, intact ion channels, and a non-hypercontracted morphology. While enzymatic dissociation protocols for mammalian cardiomyocytes are well established, isolating viable cardiac myocytes from fish hearts remains difficult owing to non-mammalian tissue architecture, relatively low cellular yield, and small heart size7,8. The main limitations of this procedure are the technical difficulty of correctly cannulating the heart and the sensitivity of the preparation to small variations in enzymatic treatment. Any disruption of perfusion flow leads to a marked deterioration in both cell quality and yield. Furthermore, even slight deviations in enzyme concentration or digestion time can substantially affect cell viability and the quality of subsequent electrophysiological recordings. The age of the animal should also be considered. Although hearts from older fish require slightly higher enzyme concentrations and prolonged digestion times due to their increased content of collagen fibers and fibroblasts2, the general principles of isolation remain constant, with enzyme concentrations and exposure times varying within 10% to achieve optimal results.
Consequently, a detailed, highly reproducible enzymatic isolation protocol is a prerequisite for advancing electrophysiological research on cardiac aging in fish models. Despite certain morphological similarities in linear dimensions, cardiomyocyte isolation from N. furzeri requires several substantial modifications compared with the protocol for Danio rerio. The classical procedure for isolating cells from the zebrafish heart involves immersing the intact heart in an enzymatic solution for a relatively prolonged period7,8,9. Although this approach yields viable cells, it can be overly aggressive for the Nothobranchius heart and may lead to excessive enzymatic digestion. This method ensures a stable flow of solutions directly into the cardiac chambers, thereby providing more efficient washout of blood from the heart and enabling more precise and gentle enzymatic treatment. This article outlines a refined methodology for isolating viable, patch clamp-suitable cardiac myocytes from N. furzeri, addressing the key adjustments needed to ensure high-quality electrophysiological recordings.
Protocol
The study was performed on N. furzeri of the GRZ strain. The young sexually mature fish of both sexes at 1.5–2 months of age (N = 19, body mass = 0.71 g ± 0.36 g) were used to record action potentials and ionic currents in isolated ventricular cardiomyocytes. The fish were bred and provided by the A.N. Severtsov Institute of Ecology and Evolution of the Russian Academy of Sciences. The animals were kept in aquaria at 24 °C ± 1 °C under a 12‑h light/dark cycle in 60–100 L water tanks. Animal density was 10–20 animals per tank in accordance with previously published recommendations10.
The principle of cardiomyocyte isolation from N. furzeri is based on the classical fish isolation method described previously and adapted to small fish11,12. All experiments were performed in accordance with the Guide for the Care and Use of Laboratory Animals (US National Institutes of Health) and EU Directive 2010/63/EU. The experimental protocol was approved by the Bioethics Committee of Lomonosov Moscow State University (Application №202-a, approved during the Bioethics Commission meeting №169-d held on 27.02.2025). The reagents and the equipment used are listed in the Table of Materials.
1. Preparation of the solutions
- Prepare the Ca2+-free isolation solution containing (in mmol L-1): 100 NaCl, 10 KCl, 1.2 KH2PO4, 4 MgSO4, 50 taurine, 20 glucose, and 10 HEPES. Adjust the pH to 6.9 with NaOH at room temperature (24 °C). Perform the isolation using a room-temperature saline solution. Solution oxygenation is not required for the isolation.
NOTE: The isolation solution can be stored at 4 °C for 3–4 days in a glass bottle. - Prepare 3 mL of enzymatic solution based on the Ca2+-free solution, containing 0.8 mg mL-1 collagenase type 1A, 0.5 mg mL-1 trypsin, and 0.8 mg mL-1 bovine serum albumin (BSA). Add enzymes immediately prior to the isolation procedure to preserve enzymatic activity.
NOTE: Enzyme concentrations may need adjustment, as enzyme activity varies between batches. - Pre-cool 50–100 mL of tap water in a refrigerator to +4 °C. The chilled water is required for fish analgesia.
2. Preparation of the isolation system
- Secure two 10 mL syringe barrels to a stand at a height of approximately 35 cm.
- Connect silicone tubes (d = 8 mm) to the barrels and join their free ends using a 3-way infusion stopcock.
- Fill one tube with the Ca2+-free isolation solution and the other with the enzymatic solution. Ensure no air bubbles remain in the tubing, as they impede flow and reduce isolation quality. Shut off the flow.
- Fill a 32 G dispensing needle with Ca2+-free solution using a 1 mL insulin syringe to avoid air bubbles at the needle tip.
- Attach the filled needle to the free end of the 3-way stopcock.
- Using mounting putty, fix the needle to a 100 mm Petri dish parallel to the bottom plane.
- Place the Petri dish connected to the perfusion system under the stereo microscope and secure it with the stage clips and mounting putty (Figure 1A).
3. Dissection and heart isolation
- Prepare the surgical instruments: two pairs of microsurgical ophthalmic scissors and forceps, and a dissecting tray with four medical needles.
- Take the pre-cooled tap water from the refrigerator and rapidly submerge the fish. Wait until the gill covers stop moving.
CAUTION: Confirm cessation of opercular movement to ensure adequate analgesia before proceeding. - Remove the fish from the water, place it on the dissecting tray dorsal side up, and sever the spinal cord with ophthalmic scissors.
- Turn the fish onto its back and secure it to the tray with needles. Pin the head, tail, and opercula, keeping the opercula pinned back in a fully opened position to provide more space.
- Make a transverse incision of the peritoneum. Extend the incision longitudinally to the main body axis, gently elevating the skin away from the visceral organs with forceps. Continue to the margin of the lower jaw and secure the skin edges to the left and right (Figure 1B).
- Locate the ventricle and the bulbus arteriosus. Grasp the bulbus arteriosus with forceps as far as possible from the ventricle and gently lift it out of the body. Without releasing the forceps, cut caudal to the ventricle to keep it intact.
- Transfer the isolated heart to the Petri dish under the stereo microscope. Secure the cannula tip in the ventricle by first placing it into the bulbus arteriosus, then carefully passing it through the aortic valve without damaging the surrounding tissue. Successful cannulation could be achieved in > 90% of the hearts.
- Secure the bulbus arteriosus to the cannula with a ligature (Figure 1C).
NOTE: A human hair (d = 50–70 µm) serves well as a ligature, as standard suture thread is too thick for the small heart.
4. Cardiomyocyte isolation
- Open the 3-way stopcock to allow flow from the barrel containing Ca2+-free solution. When performed correctly, the ventricle fills with solution and expands. The flow rate was set to 43 µL min-1.
- Trim remnants of the atrium and sinus venosus with microsurgical scissors without damaging the ventricular walls.
- Perfuse the heart for 10–12 min while monitoring for uniform flow. Gently compress the silicone tube to deliver a transient pulse of solution that expands the ventricular trabeculae and washes out remaining blood. Successful washing is indicated by cardiac arrest and cessation of erythrocyte flow under the stereo microscope.
- Switch the stopcock to direct the enzymatic solution to the ventricle. Perfuse for 4–6 min. Confirm enzymatic treatment visually by breakdown of ventricular-wall integrity and shedding of small myocardial fragments.
CAUTION: Avoid sampling or transfer of the perfusate to an inverted microscope to for examination, as this may lead to loss or mechanical damage of cellular material and interrupt continuous monitoring of perfusion quality. It is better to rely on the signs of successful isolation described above, which are clearly visible under a binocular microscope. - Add a small aliquot (300–400 µL) of Ca2+-free solution to a 35 mm tissue culture dish. Cut the ventricle away from the bulbus arteriosus and transfer it into the dish.
- Mince the ventricle with fine scissors, then gently triturate the tissue by repeatedly pipetting with a 100 µL micropipette fitted with a cut-off tip.
- Transfer the cell suspension into a 1500 µL tube. Check an aliquot under an inverted microscope at low magnification (10×). Visually estimate the density of rod‑shaped, striated cardiomyocytes in the field of view. If the field is crowded, with many overlapping rod‑shaped cells (>50 per 10× field), add Ca2⁺‑free solution to reduce cell density and avoid excessive crowding in the recording chamber. Allow the cells to settle at 4 °C for 40–50 min before recording.
NOTE: Cells may be held at 4 °C during the settling period; use them for recordings within 8 h of isolation.
5. Whole-cell patch clamp recordings
- Prepare the extracellular and intracellular solutions for the different ionic currents and action potential recordings listed in Table 1.
- Pull patch pipettes from thin-walled borosilicate glass capillaries (without filament) on a vertical puller and fill them with intracellular solution. The filled pipette resistance should be 2.0–3.0 MΩ for all recording configurations.
- Fill the perfusion reservoir with the extracellular bath solution and prime the lines to remove all air bubbles before placing cells in the recording chamber.
- Add a small volume (30–40 µL) of the isolated cardiomyocyte suspension to the glass-bottomed recording chamber and allow the cells to settle for 5–10 min.
- Attach the pipette to the amplifier head-stage. Under microscopic guidance, lower the pipette toward the target cardiomyocyte with the micromanipulator until the tip contacts the membrane, seen as a minor dimple and an increase in pipette resistance.
- Apply gentle negative suction to establish a high-resistance GΩ seal, which typically forms within a few seconds.
- Set the holding potential to -80 mV. Rupture the membrane with a series of short suction pulses. After establishing the whole‑cell configuration, minimize capacitance transients and compensate cell capacitance and series (access) resistance using the amplifier’s compensation circuitry.
- Compensate these capacitive currents using the Cell capacitance and Series resistance controls on the amplifier. Adjust the Cell capacitance control to minimize the main capacitive transient, then adjust the Series resistance control to reduce the remaining overshoot until it is largely cancelled, and the baseline current is flat.
- Accept only cells with an estimated access resistance after compensation of ≤10–12 MΩ for recording of action potentials and ionic currents. Proceed to record action potentials or ionic currents, adding the specific blockers listed in Table 2 before recording where required.
- Record with patch clamp acquisition software that allows configuration of custom stimulation protocols for each target current. The voltage-clamp protocols used in this study are shown in Figure 2.
Results
This protocol yields individual, rod-shaped ventricular cardiomyocytes from N. furzeri that are suitable for high-resolution whole-cell patch clamp recording. A successful isolation is judged first by cell morphology and seal quality, and then confirmed functionally by the ability to record stable action potentials and each of the major ionic currents with the expected voltage dependence and amplitude. The representative recordings below were obtained from young N. furzeri and define the reference values that indicate a healthy, well-clamped cell. Deviations from these benchmarks typically indicate a suboptimal isolation and are described alongside each criterion.
Cell morphology and seal formation
Viable N. furzeri ventricular cardiomyocytes appear elongated and rod-shaped with a smooth, morphologically intact sarcolemma (Figure 3). In some cells, a faint transverse striation could be discerned under the light microscope, although it was not consistently resolved in every cell; therefore, the smooth, intact membrane and the elongated, rod-shaped morphology were used as the primary criteria for selecting cells for recording. Such cells readily form a high-resistance seal (>1 GΩ) and tolerate membrane rupture. In contrast, rounded, contracted, granular, or swollen cells are signs of over-digestion or mechanical damage: they seal poorly, rapidly run down, and should be discarded. A healthy cell holds a stable resting membrane potential and shows minimal leak at the -80 mV holding potential.
Patch clamp recording characteristics
Whole‑cell patch‑clamp recordings were performed at 22–24 °C using a patch-clamp amplifier. Signals were sampled at 10 kHz and low‑pass filtered at 1–2 kHz. The output gain (α) was set to ×0.5 to optimize signal resolution on the digitizer. Series resistance was compensated by 70%–80%; lag 10 µs. The recordings were discarded if the estimated access resistance exceeded 10–12 MΩ or changed by more than ~10% during the recording. For action‑potential and ionic‑current recordings, linear leak subtraction was not applied.
Cells were excluded from analysis if they met any of the following criteria: resting membrane potential less negative than −70 mV in current‑clamp mode; inability to form a stable gigaseal (>1 GΩ); access resistance >10–12 MΩ after compensation; rapid run‑down of ionic currents during the recording; morphological damage (rounded, granular, or hypercontracted appearance).
Action potentials (positive control of viability)
Action potentials recorded in current-clamp mode provide the most direct assessment of the electrical viability of an isolated cardiomyocyte. Elicit APs with 1 ms depolarizing current pulses (0.4–1 nA, ~30% above threshold). Set the stimulation frequency to 0.3 Hz. Record APs after ~5 min, once the waveform reaches a stable, steady state. In a well-isolated cardiomyocyte from young N. furzeri, the resting membrane potential (RMP) is stable and close to -85 mV (Figure 4B). The AP overshoots to approximately +30 mV, giving a clear all-or-none upstroke (Figure 4A). Representative AP characteristics include an APD90 of ~530 ms, an APD50 of ~460 ms, and a maximum upstroke velocity (dV/dtmax) of ~50 V s-1. A depolarized RMP (less negative than about -70 mV), reduced or absent overshoot, slowed upstroke velocity, or the inability to sustain repetitive firing with stable amplitude and duration in the majority of cases indicates a damaged or poorly clamped cell, which cannot be used to evaluate AP characteristics.
Fast sodium current (INa)
The fast sodium current underlies the AP upstroke and is a sensitive marker of membrane integrity and clamp quality. Using the Cs+-based solutions in Table 1, INa is recorded as a large, rapidly activating and inactivating inward current (Figure 5A). In healthy young myocytes, INa becomes detectable near -60 mV, reaches a peak density of approximately -13 pA pF−1 at about -30 mV, and reverses near +20 mV (Figure 5B). The inactivation time constant decreases from ~8 ms at -50 mV to ~2 ms at -10 mV, and the half-inactivation voltage lies near -70 mV13 (Figure 5C,D). A substantially reduced peak current amplitude, a shifted or ill-defined reversal potential, or slowed and distorted activation/inactivation kinetics indicate inadequate voltage control (series-resistance error) or compromised membrane integrity rather than the isolation itself.
Calcium currents (ICaL and ICaT)
Recorded with the calcium-current solutions (Table 1), N. furzeri cardiomyocytes display a net inward calcium current with two components. The current begins to activate at approximately -60 mV, indicating a T-type component (ICaT) in addition to the dominant L-type current (ICaL), and reaches a peak density of about -7 pA pF−1 between -10 mV and 0 mV (Figure 6B). Component identity is confirmed pharmacologically: 10 µM nifedipine partially blocks the current, while 100 µM produces near-complete inhibition (Figure 6A). It is important to note that a 100 µM nifedipine concentration was employed only in specific control experiments to verify that the residual current after 10 µM nifedipine is fully sensitive to higher concentrations and thus could be identified as ICaT. For standard routine recordings, 50 µM is enough to fully block the net ICa current. The ICaL component is defined as a current elicited from a holding potential of -50 mV, and ICaT is obtained as the difference between the current recorded from -90 mV and the isolated ICaL (Figure 6C,D). A cleanly resolved, nifedipine-sensitive inward current with described activation and peak current voltages indicates well-preserved calcium channels.
Delayed rectifier potassium currents (IKr and IKs)
The presence of outward potassium currents confirms that the repolarizing machinery remains functionally intact after the isolation. Under the pharmacological conditions (Table 2), depolarization to -40 mV and above elicits an outward current in all healthy cells. Two components are distinguished with selective blockers: the slow delayed rectifier (IKs), sensitive to chromanol 293B (20 µM), and the rapid delayed rectifier (IKr), sensitive to E4031 (1 µM) (Figure 7A,B). In myocytes from young fish, IKs, as well as IKr, reach a density of approximately 1 pA pF−1 at strongly depolarized potentials (Figure 7C,D). The presence of both delayed rectifier components, which play a major role in human ventricular repolarization but contribute less in standard rodent models14, serves as a key validation that the recorded cell is an N. furzeri ventricular myocyte with intact repolarizing currents.
Background inward rectifier current (IK1)
The background inward rectifier current sets the resting membrane potential and is conveniently assessed with a voltage ramp protocol from +60 to -120 mV (Figure 7E). In a healthy cell, IK1 reverses near -80 mV, consistent with the RMP measured in current clamp mode. At potentials positive to the reversal potential, IK1 exhibits a characteristic outward hump, peaking at several pA pF−1 (Figure 7F). A reversal potential far from -80 mV or a large standing leak indicates a poor seal or a damaged membrane.
Taken together, a preparation is considered successful when it yields elongated, rod-shaped cells with smooth, intact membranes that form gigaohm seals and demonstrate the reference action potential waveform and current signatures described above. Obtaining several such cells from a single heart confirms that the enzymatic dissociation has preserved both membrane integrity and the full complement of cardiac ion channels required for downstream electrophysiological study.
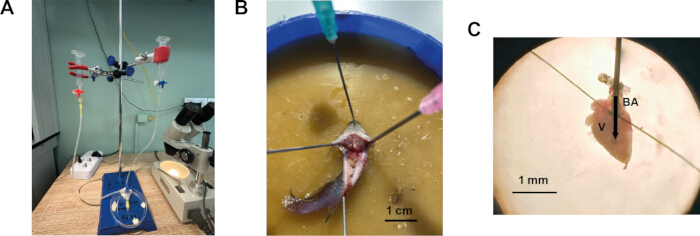
Figure 1: Procedure for isolation of ventricular cardiomyocytes from the heart of N. furzeri. (A) Cardiomyocyte isolation system modified for small fish. (B) Fish secured in a dissection tray, ventral side up, with the peritoneum incised transversely and longitudinally. (C) N. furzeri heart cannulated and secured for perfusion. BA – bulbus arteriosus, V – ventricle. The arrow indicates the direction of the solution flow into the ventricle. Please click here to view a larger version of this figure.
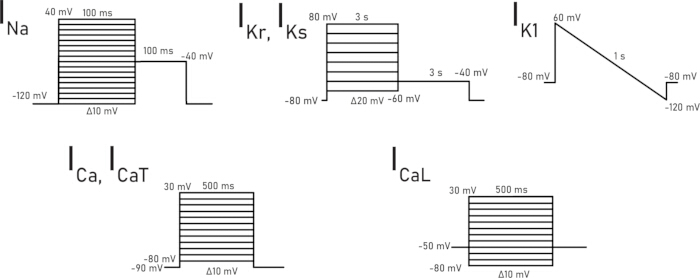
Figure 2: Voltage-clamp protocols used for recording each specific ionic current. Please click here to view a larger version of this figure.
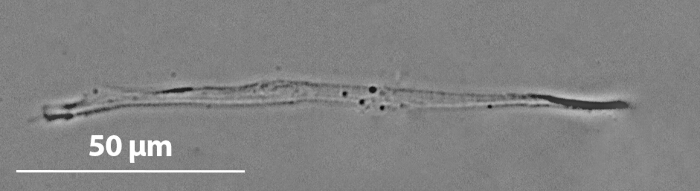
Figure 3: Representative microphotograph of a ventricular cardiomyocyte from young N. furzeri. Please click here to view a larger version of this figure.
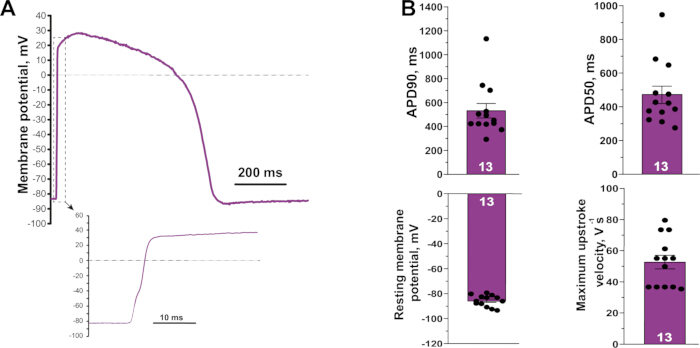
Figure 4: Representative action potential recorded from a ventricular cardiomyocyte of a young N. furzeri. (A) Action potential waveform. The inset shows the rapid upstroke on an expanded time scale. (B) Action potential characteristics measured from isolated young myocytes (resting membrane potential, APD50, APD90, and maximum upstroke velocity). (N = 7, n = 13). Values are represented as mean ± S.E.M. Please click here to view a larger version of this figure.
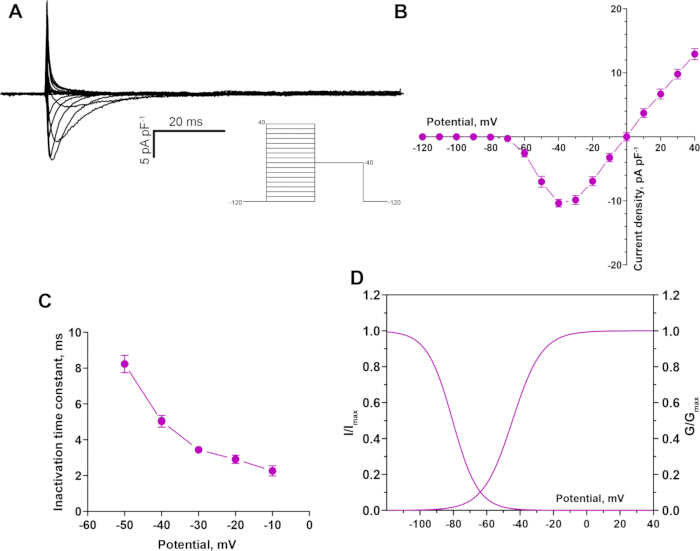
Figure 5: Fast sodium current (INa) recorded from a young N. furzeri ventricular cardiomyocyte. (A) Representative recording of the INa. (B) Current-voltage relationship for INa, activating near -60 mV with a peak near -30 mV. (C) Voltage dependence of the inactivation time constant. (D) Steady-state activation and inactivation curves. (N = 5, n = 11). Values are represented as mean ± S.E.M. Please click here to view a larger version of this figure.
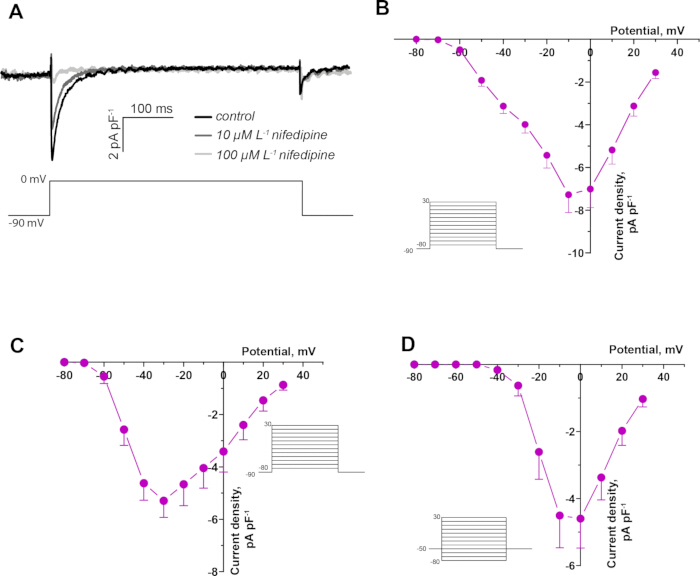
Figure 6: Calcium currents in a young N. furzeri ventricular cardiomyocyte. (A) Representative recording of the net calcium current in control and in the presence of 10 µM and 100 µM nifedipine in a young N. furzeri ventricular cardiomyocyte. (B) Current-voltage relationship for the net calcium current, activating near -60 mV with a peak near -10 mV (N = 5, n = 11). (C) Current-voltage relationship for the T-type component (ICaT) (N = 3, n = 6). (D) Current-voltage relationship for the L-type component (ICaL) (N = 5, n = 7). Values are represented as mean ± S.E.M. Please click here to view a larger version of this figure.
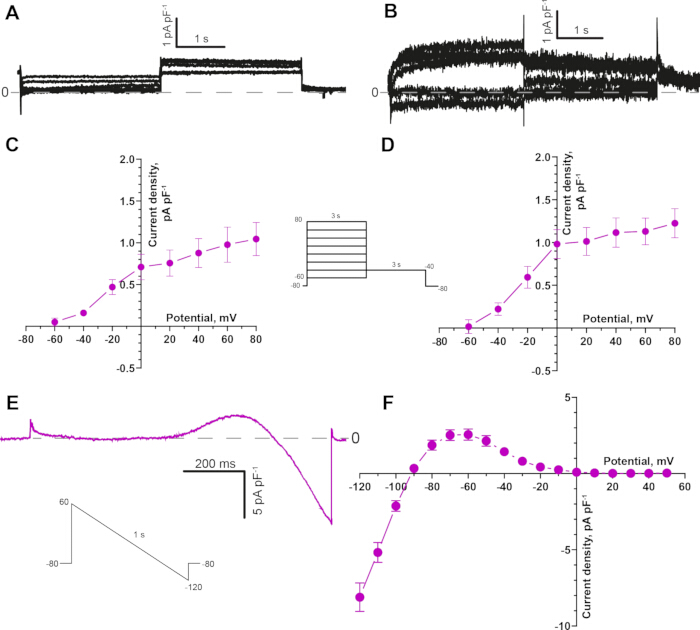
Figure 7: Potassium currents in young N. furzeri ventricular cardiomyocytes. (A) Representative recording of the slow delayed rectifier current (IKs), isolated in the presence of E4031 (1 µM) to block IKr. (B) Representative recording of the rapid delayed rectifier current (IKr), isolated in the presence of chromanol 293B (20 µM) to block IKs. (C) Current-voltage relationship for IKs current (N = 5, n = 9). (D) Current-voltage relationship for IKr current (N = 5, n = 10). (E) Representative IK1 recorded with a descending voltage ramp protocol from +60 mV to -120 mV. (F) Current-voltage relationship for IK1, reversing near -80 mV (N = 5, n = 18). Values are represented as mean ± S.E.M. Please click here to view a larger version of this figure.
| Solution Name | Reagent and concentration (mM) |
| Action potential and potassium currents Extracellular solution | 150 NaCl, 3 KCl, 1.2 MgCl2, 1.8 CaCl2, 10 glucose, 10 HEPES; pH 7.4 adjusted with NaOH |
| Action potential and potassium currents Intracellular solution | 140 KCl, 1 MgCl2, 5 EGTA, 4 MgATP, 0.03 Na2GTP and 10 HEPES; pH 7.2 adjusted with KOH |
| Sodium current Extracellular solution | 20 NaCl, 123 CsCl, 1 MgCl2, 1.8 CaCl2, 10 glucose and 10 HEPES; pH 7.2 adjusted with CsOH |
| Sodium current Intracellular solution | 5 NaCl, 130 CsCl, 1 MgCl2, 5 EGTA, 10 HEPES, 4 MgATP, 0.03 Na2GTP and 15 TEA; pH 7.2 adjusted using CsOH |
| Calcium current Extracellular solution | 150 NaCl, 3 CsCl, 1 MgCl2, 1.8 CaCl2, 10 glucose and 10 HEPES; pH adjusted to 7.2 by NaOH |
| Calcium current Intracellular solution | 130 CsCl, 1 MgCl2, 5 EGTA, 10 HEPES, 4 MgATP, 0.03 Na2GTP and 15 TEA; pH 7.2 adjusted with CsOH. |
Table 1: Composition of the extracellular and intracellular solutions for patch-clamp recording of action potentials and ionic currents.
| Recording current | Blocker concentration (μM) | |
| 1. | Action potential | No blockers required |
| 2. | IKr | 50 Nifedipine, 20 Chromanol 293B |
| 3. | IKs | 50 Nifedipine, 1 E4031 |
| 4. | IK1 | 50 Nifedipine, 20 Chromanol 293B, 1 E4031 |
| 5. | INa | 50 Nifedipine |
| 6. | ICaT | 1 Tetrodotoxin |
| 7. | ICaL | 1 Tetrodotoxin |
Table 2: Pharmacological blockers added to the extracellular solutions for selective recording of a given ionic current.
Discussion
A successful isolation of viable ventricular cardiomyocytes from N. furzeri represents a methodological advance that allows direct electrophysiological characterization of age-related cardiac remodeling at the cellular level. This resolution is essential for identifying the specific ionic mechanisms underlying age-related cardiac dysfunction, which cannot be distinguished with organ- or whole-heart preparations alone. Studying native cardiomyocytes provides direct insight into how aging changes fundamental electrophysiological properties, including ionic currents and action potential characteristics.
Several steps in the present protocol are critical for obtaining high‑quality, patch‑clamp-suitable cardiomyocytes from N. furzeri. First of all, the enzyme activity varies between batches, so collagenase and trypsin concentrations should be adjusted for each preparation. Over-digestion causes membrane damage and loss of ion channel function, whereas under-digestion yields few cells and prevents stable pipette-membrane contact. The isolated cells retain an elongated, rod-shaped morphology with a smooth, intact sarcolemma, indicating preservation of cellular integrity during isolation; in some cells, a faint sarcomeric striation could also be discerned under the light microscope. This preservation is critical for reliable electrophysiological data, as damaged cells often demonstrate altered ion channel function and compromised membrane properties. Secondly, the small size of the N. furzeri heart is a technical challenge that necessitates careful optimization of the enzymatic isolation and precise manual dissection, and the cellular yield per heart is lower than in mammalian preparations. Moreover, inconsistent perfusion or leakage from the cannulated heart is also one of the most common challenges that may occur during the procedure. Practice cannulation on several hearts to develop a consistent approach angle and depth. Ensure that the needle tip is free of air bubbles and that the bulbus is tied securely without cutting through the tissue. Also, before proceeding to recording, confirm that the cells are rod‑shaped, with a smooth, intact membrane (a faint striation may be visible in some cells). Rounded or granular cells should be discarded. Check that all solutions are freshly prepared and correctly pH‑adjusted. Ensure that the pipette resistance is in the recommended range (2.0–3.0 MΩ). During the recording, check the amplifier parameters described above; the access resistance after compensation does not exceed 10–12 MΩ; the resting membrane potential is less negative than −70 mV in current‑clamp mode, and the cell forms a stable gigaseal.
Nonetheless, the protocol reliably yields high-quality cells suitable for patch clamp recordings and potentially other applications, establishing N. furzeri as a practical model of cellular cardiac aging. As N. furzeri offers clear advantages over traditional mammalian models for cardiac aging studies. As the shortest-lived vertebrate that can be bred in captivity, it allows longitudinal studies of cardiac aging within practical timeframes, compared with mouse models that require 18–24 months to reach similar biological ages15. Despite its short lifespan, it shows key features of vertebrate cardiac aging, including electrophysiological remodeling, preserved action potential duration with reduced upstroke velocity, and downregulation of important ionic currents6.
Comparison with existing cardiomyocyte isolation approaches.
Enzymatic isolation of viable ventricular cardiomyocytes is a well‑established prerequisite for single‑cell electrophysiology in a wide range of species. In mammals, the gold‑standard approach relies on retrograde aortic perfusion of the intact heart with calcium‑free buffer followed by enzyme‑containing solution, typically collagenase and proteases, under controlled pressure and temperature. This strategy provides uniform delivery of enzymes through the coronary vasculature, efficient washout of blood, and relatively gentle dissociation of the myocardium, yielding large numbers of rod‑shaped myocytes suitable for high‑resolution patch‑clamp recordings16,17.
In teleost fish, however, the anatomical organization of the heart and the absence of a coronary arterial system comparable to that of mammals necessitate important modifications. In zebrafish, one of the most widely used small‑fish models in cardiovascular research, successful isolation of ventricular cardiomyocytes is based on digestion of the intact heart in an enzymatic solution for a relatively prolonged period8,9. In these protocols, the excised heart is transferred directly into a drop or small volume of enzyme solution, where it is incubated at room temperature or at a species‑appropriate temperature, followed by mechanical trituration to release individual cells. This approach has been shown to yield viable, striated cardiomyocytes that support recordings of major ionic currents11.
Despite its utility, the batch‑digestion strategy has several limitations when applied to very small or particularly fragile hearts. First, enzymatic exposure is less controlled: the outer layers of the ventricle are exposed to a higher effective enzyme concentration for a longer time than the inner layers, which can lead to heterogeneous digestion and a mixture of under‑ and over‑digested cells. Second, prolonged immersion in enzyme solution increases the risk of over‑digestion, especially when enzyme batches vary in activity or when the heart is exceptionally small. Third, blood washout relies primarily on passive diffusion and gentle manual rinsing, which may be insufficient to fully clear the narrow luminal spaces of a tiny teleost ventricle.
We retained the general principles of calcium-free treatment, enzymatic digestion, and gentle trituration. However, the study modified the delivery of the solutions by cannulating the bulbus arteriosus and perfusing the ventricular lumen directly. This approach allows the researcher to wash blood from the ventricular spaces before digestion, switch between solutions without transferring the heart, and terminate enzymatic treatment when the ventricular wall begins to loosen. These modifications are particularly important for the small and delicate N. furzeri heart, in which prolonged immersion in enzyme solution may result in excessive digestion and reduced cell quality.
Future applications
The present isolation method opens several avenues for future research. First, it enables systematic characterization of age‑dependent changes in action‑potential morphology and ionic‑current density, kinetics, and voltage dependence in N. furzeri cardiomyocytes, complementing recent molecular and histological descriptions of cardiac aging in this species2,3,4,5. Second, the protocol can be combined with pharmacological tools to test how interventions that modulate lifespan or healthspan affect cardiac electrophysiology at the single‑cell level. Third, isolated N. furzeri cardiomyocytes can be used for applications beyond patch‑clamp recordings, including molecular analyses (qPCR, RNA‑seq, proteomics) of age‑related changes in ion‑channel expression and post‑translational modifications, immunocytochemistry, and high-resolution imaging of sarcomeric organization. Finally, the methodological framework described here can be adapted to other small teleost models with similar heart size and anatomy, thereby extending the utility of N. furzeri as a translational model for cardiac aging research.
Disclosures
The authors declare that they have no competing financial interests.
Acknowledgements
This work was supported by the Russian Science Foundation (Grant No. 22-14-00075). The authors are grateful to Andrei Nikiforov for his assistance in breeding and maintaining the Nothobranchius furzeri population used in this study.
Materials
| Name | Company | Catalog Number | Comments |
|---|---|---|---|
| 1 mL insulin syringe | Med Aim | 939863 | |
| 10 mL syringes | Changzhou Jinlong Medical Plastic Appliancy Co | - | |
| 100 mm Petri dish | SARSTEDT | 83.3902 | |
| 100 μL micropipette | Thermo Scientific | 4640040 | |
| 35 mm tissue culture dish | SPL LIFE SCIENCES | 11035 | |
| 3-way infuson stop cock | iLife Medical Devices Pvt. Ltd | 902.07.10 | |
| 500 μL tube | Eppendorf | EP0030124537-500EA | |
| 5-200 μL tip | Deltalab | 200009 | |
| Amplifier | Molecular devices | Axopatch 200B | |
| Blu Tack | BOSTIK | 202401906 | |
| Borosilicate glass capillaries | Sutter Instrument | B150-110-10 | |
| Bovine serum albumin | Dia-M | 9048-46-8 BSA.0100 | |
| CaCl2*2H20 | Sigma-Aldrich | C5080 | |
| Chromanol 293B | Sigma-Aldrich | C2615 | |
| Collagenase 1A Type | Sigma-Aldrich | C9891 | |
| CsCl | Acros Organics | 422855000 | |
| CsOH | Sigma-Aldrich | 232068 | |
| Dispensing needle (32G) | BSTEAN | 744370739503 | |
| E4031 | MedChemExpress | HY-15551 | |
| EGTA | Sigma-Aldrich | E-4378 | |
| Glucose | helicon | Solarbio G8150-500G | |
| HEPES | Sigma-Aldrich | H3375 | |
| Inverted microscope | Nikon | - | Eclipse Ti-S |
| KCl | Chimmed | 00000000089 | |
| KH2PO4 | helicon | SRL-90654-500G | |
| KOH | helicon | SRL-38630-1KG | |
| MgATP | MACKLIN | A922363 | |
| MgCl2*6H2O | helicon | Solarbio M8161 | |
| MgSO4*7H2O | helicon | SRL-74440-500G | |
| Micromanipulator | RWD | MM-500 | |
| Microsurgical ophthalmic forceps | CILITA | F-111T | |
| Microsurgical ophthalmic scissors | CILITA | S-056S | |
| Na2GTP | Sigma-Aldrich | 51120 | |
| NaCl | helicon | H-1418-1.0 | |
| NaOH | helicon | SRL-13913-500G | |
| Nifedipine | Sigma-Aldrich | N7634 | |
| Perfusion system | Biotechnologies | Bio_4_p | |
| Pipette Puller | Narishige Group | PC-10 | |
| Silicone tubes (d = 8 mm) | MEDSIL | TY 9398-004-18037666-94 | |
| Stand | NV-lab | 00000034085 | |
| Stereo microscope | Labkompleks LCC | 10557 | |
| Taurine | Acros Organics | 166545000 | |
| Tetraethylammoniumchlorid (TEA) | Merck | 822148 | |
| Tetrodotoxin | Tocris Bioscience | 1078 | |
| Trypsin | Sigma-Aldrich | T0303 | |
| WinWCP software | University of Strathclyde | - | V5.7.5 |
References
- Nakou E et al. Healthy aging and myocardium: a complicated process with various effects in cardiac structure and physiology. Int J Cardiol. 2016;209:167-175.
- Ma X et al. Nothobranchius furzeri: a vertebrate model for studying cardiac aging and cellular senescence. NPJ Aging. 2025;11(1):63.
- Valdesalici S, Cellerino A. Extremely short lifespan in the annual fish Nothobranchius furzeri. Proc R Soc Lond B Biol Sci. 2003;270(Suppl 2):S189-191.
- Platzer M, Englert C. Nothobranchius furzeri: a model for aging research and more. Trends Genet. 2016;32(9):543-552.
- Otsuka T, Matsui H. The African turquoise killifish (Nothobranchius furzeri): a model of age-related diseases and declining regenerative capability across multiple organs. Mech Ageing Dev. 2025;226:112087.
- Filatova TS, Dzhumaniiazova IH, Shamshura AV, Abramochkin DV. Aging-associated remodeling of ionic currents in ventricular myocytes of seasonal fish Nothobranchius furzeri. Comp Biochem Physiol A Mol Integr Physiol. 2026;317:112013.
- Sander V et al. Isolation and in vitro culture of primary cardiomyocytes from adult zebrafish hearts. Nat Protoc. 2013;8(4):800-809.
- Singareddy SS, McClenaghan C, Roessler HI, Tryon R, Nichols CG. Isolation of cardiac and vascular smooth muscle cells from adult, juvenile, larval and embryonic zebrafish for electrophysiological studies. J Vis Exp. 2022;(180):63225.
- Vornanen M. Sarcolemmal Ca influx through L-type Ca channels in ventricular myocytes of a teleost fish. Am J Physiol Regul Integr Comp Physiol. 1997;272(5):R1432-R1440.
- Polačik M, Blažek R, Reichard M. Laboratory breeding of the short-lived annual killifish Nothobranchius furzeri. Nat Protoc. 2016;11(8):1396-1413.
- Dzhumaniiazova I, Vornanen M, Pustovit OB, Voronkov YI, Abramochkin DV. Effects of tetrodotoxin and ranolazine on the late INa of zebrafish ventricular myocytes. J Evol Biochem Phys. 2022;58(Suppl 1):S22-S30.
- Brette F et al. Characterization of isolated ventricular myocytes from adult zebrafish (Danio rerio). Biochem Biophys Res Commun. 2008;374(1):143-146.
- Filatova TS, Dzhumaniiazova IH, Shamshura AV, Pustovit OB, Abramochkin DV. Reduction of fast sodium current in the myocardium of fish (N. furzeri) during aging. Bull Exp Biol Med. 2026;181(1):109-116.
- Joukar S. A comparative review on heart ion channels, action potentials and electrocardiogram in rodents and human: extrapolation of experimental insights to clinic. Lab Anim Res. 2021;37(1):25.
- Holtze S et al. Alternative animal models of aging research. Front Mol Biosci. 2021;8.
- Wolska BM, Solaro RJ. Method for isolation of adult mouse cardiac myocytes for studies of contraction and microfluorimetry. Am J Physiol Heart Circ Physiol. 1996;271:H1250-H1255.
- Louch WE, Sheehan KA, Wolska BM. Methods in cardiomyocyte isolation, culture, and gene transfer. J Mol Cell Cardiol. 2011;51(3):288-298.
Reprints and Permissions
This article has been published
Video Coming Soon